USD-CAD bullish swing trading idea aheadHi Freedom Traders,
in the 240min chart of the USD-CAD a completion of a bullish bat pattern offers us a nice high probability trading chance.
Find possible entry and exits in the chart.
Happy Trading!
Advancedpatterns

DAX pot bearish setupHi Freedom Traders,
pot. bearish Bat pattern completion in the DAX.
Happy Trading!


AUDUSD 240min Bear TCTI've been waiting patiently for AUDUSD to pullback into an area where I can get a good R:R Trend Continuation Trade out of it. It has formed a Bat Pattern which allows me to place sell orders at very good level. I will be trading 2 targets on this trade and will trail stops on the 2nd position.
On the Daily chart, price has been channeling between Support and Resistance for quite some time now. It has recently come off of the Resistance Zone and is hopefully on its way down to the daily support level.

Shoulder-Head-Shoulder @ Resistance At the 240M the second shoulder is about to form. Looks like price will form a candlestick pattern on the 240M which is a Double Top on the 60M.
Perfect run:
Shorting the second shoulder for a "neck break"
Going long in support until the rebound to the neck then
Short trend continuation

AUD-USD long ideaHi Freedom Traders,
in the 30min AUD-USD chart a pot. completion of a bat pattern would offer us a high probability trading opportunity.
Find possible entry and exit levels in the chart.
Happy Trading!


Bullish Cypher Pattern on NZDUSDThere is a potential bullish Cypher pattern setting up on NZDUSD. This pattern will potentially complete @.68457. Minimum stops must be below X @.68176 with target 1 at .6885 and target 2 at .6909.
As always, follow your plan.
Good luck and good trading.

Complete Bat patternHello guys
here you can see my opinion about completion of bat pattern with a very good risk reward ratio.
Enjoy your trading
You can join me on telegram channel:
t.me/globalmarkett


300 pips cypher pattern shorting eurusdgood day everyone
on the radar now a cypher pattern for EURUSD shorting as per the targets showing
happy pips hunting

Advanced Pattern & Elliot Wave confluence +300 Pips OpportunityNice high probability , multi argument short opportunity on the daily. In line with a short trade on EUR/GBP that I opened yesterday.
Euro showed some strength since the first round of the #frenchelections2017 and the US dollar surely suffered after the #Trumpleaks. These fundamental facts pushed the EUR/USD with some significant momentum into an interesting resistance area. A combination of a completed 5 wave Elliot move + BatPattern + RSI overbought. Target on the 38.2% retracement should provide more or less 300 pips. If price comes back and double tops at entry a second chance is provided to target another 300 pips.
Those brave traders who are willing to sell into strength may receive some significant return if this strategy pays off. BatPattern, especially on EUR/USD have a high rate of success but remember, no trade is a sure game!

Bat Pattern on CJ!Hey guys,
this is a simple pattern formation that's about to complete around 81.60 level. This zone has multiple structures in there so i'm very interested in taking this pattern. Rsi is in oversold condition by the way.
Let's see how it plays out.
Stops below X, targets at 382 and 618 retracements of AD leg.
If you want to share your view or simply ask questions, feel free to comment below.
Otherwise, see you in the next chart!

Harmonic Pattern on CADJPY!Hey guys,
this is a simple pattern formation that's about to complete around 81.60 level. This zone has multiple structures in there so i'm very interested in taking this pattern. Rsi is in oversold condition by the way.
Let's see how it plays out.
Stops below X, targets at 382 and 618 retracements of AD leg.
If you want to share your view or simply ask questions, feel free to comment below.
Otherwise, see you in the next chart!

if you are brave enough 1120 PIPS on a batpattern formationgood day traders
we got here a bat pattern trade
on 1120 pips on a short USDJPY

Massive Bearish Bat PatternThere is a massive potential bearish bat pattern currently setting up on the EURUSD. Now this pattern is on the Daily Time Frame, so make sure to check your risk. If you use a 1 ATR Stop, you will have 200 pips of risk. If you can handle the risk though, this is a very nice potential opportunity. This will complete at 1.11896 with minimum stops above X at 1.12989. Target 1 will be at the 38.2 Fibonacci retracement level (1.08651) and target 2 at the 61.8 retracement level (1.06646). As always, follow your plan.
Good luck and good trading.

Cypher Pattern + Double Top on CHFJPYHi guys,
this may came too late but for pattern traders, this is still a valid entry reason, i usually take patterns with a limit order only when certain condition are met, and this is not the case. However i can still enter the trade with a valide structure reason, like the double top that you see here (with RSI Divergence). If and when price will come back, i'm going to sell this market, hoping for a completion of the pattern's targets.
Stops above the highs (and possibly above X), targets with 382 and 618 retracement of AD.
If you have questions or if you want to share your view, feel free to comment below.
Otherwise, see you in the next chart!

Harmonics + Structure! (CHFJPY analysis)Hi guys,
this may came too late but for pattern traders, this is still a valid entry reason, i usually take patterns with a limit order only when certain condition are met, and this is not the case. However i can still enter the trade with a valide structure reason, like the double top that you see here (with RSI Divergence). If and when price will come back, i'm going to sell this market, hoping for a completion of the pattern's targets.
Stops above the highs (and possibly above X), targets with 382 and 618 retracement of AD.
If you have questions or if you want to share your view, feel free to comment below.
Otherwise, see you in the next chart!

Discipline in trading is especially hard for forex tradersI love trading forex due to many reason one being the high volatility. You almost always get second chances for entries and exits. Prices tends to oscillate around their "fair value" al to more than in Stocks or ETF´s. There is almost no pair the rallies 50% in a year.
While there are scenarios for early exit, one should only execute such planed exceptions right? But even after 12 years of trading my n°1 mistake remain early profit taking!

GBPJPY CYPHER bearishWhen we have a broken trendline we always looking for a pullback-retest of the trendline or for an advance pattern formation in order to enter the market at the direction of the break.
Here there is a pending Cypher pattern formation that gives us the reason we are waiting for.
SL and TP points as in the chart

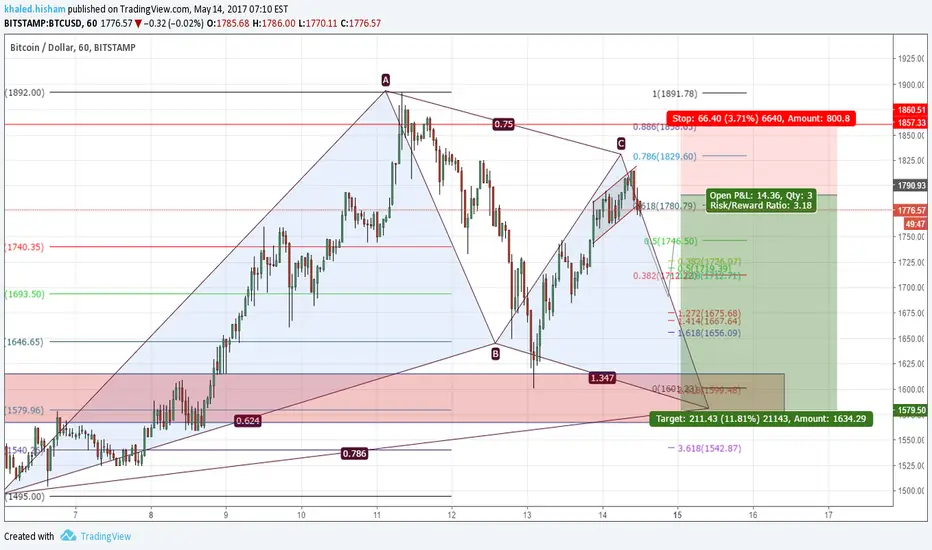
Bitcoin gartley patterngood day everyone
we got here the gartley pattern for shorting on the Bitcoin
lets see if we got a lucky coin to trade.
targets as per the showing .