Power of multiple Strategy System - Free Strategy coming up!No matter where the market is going? With a multiple Strategy System you can create opportunity in almost any market condition.
Here, red short ABCD and orange long Gartley to name only 2 of the upcoming opportunities.
My preferred package is mid-term trend-following + short-term anti-trend + Simple & Advanced Price Pattern. ROI +/- 200 pips p.a. and per FX pair, netted of trade size.
As the interest on my system increases on social media and my personal network, I am working on an online module to teach these basics of my system and show you how to use these principles if you wish to. This is no marketing and the modules are totally free so if you have any interest in following the publications please put your email in the comment.
Advancedpatterns


60% chance of making 2 time 500 Pips until SeptemberPreferred scenario for the summer:
USD/JPY did not made into the major support area 107 - 106´s. JPY could still show strength against the US dollar, hence I gave it a first split entry at resistance to chase the 107 low prices. However, new low prices often only come after a some kind of ABCD correction. I am typically planning a second entry on D somewhere between 1.141 & 1.618 of bc, depending n the lower timeframe price action and if an advanced price action pattern will appear. First target at the april lows and second around the 107 - 106 low depending on the momentum of the desired short fall.
If my underlying assumption is wrong I will hedge prices above the March highs to stay neutral and see if USD pushes above 118.6 JPY.
Any one having similar midterm assumption at this stage?


GBPUSD BAt pattenr formation 117 pips shortgood day everyone
we got now on the radar a bat pattern formation as a short position
as per the targets showing below
happy hunting

Bearish Gartley Formation On 1Hour ChartHave a barish Gartley Formation on the 1 hour chart. looking for a D leg completion around the 0.85073 area. taking 2 profit targets. lets see if it pops!

USDJPY cypher pattern short 170 pips good day traders
now we got a cypher pattern that got completed and a great chance for shorting
im gonna take this trade
waiting for a Lower low signal
happy hunting everyone .

Technical Analysis vs. NEWS! Back to Back Patterns on $EURUSD?We currently retrace from the bearish Gartley Pattern into previous structure. This gives us the opportunity to for another Gartley Pattern lining up @1.0866's.
Attention:
USD News Today:
ADP Non-Farm Employment change
FOMC Statement
Trade your plan!


Day Trading with Advanced Patterns!Hi guys,
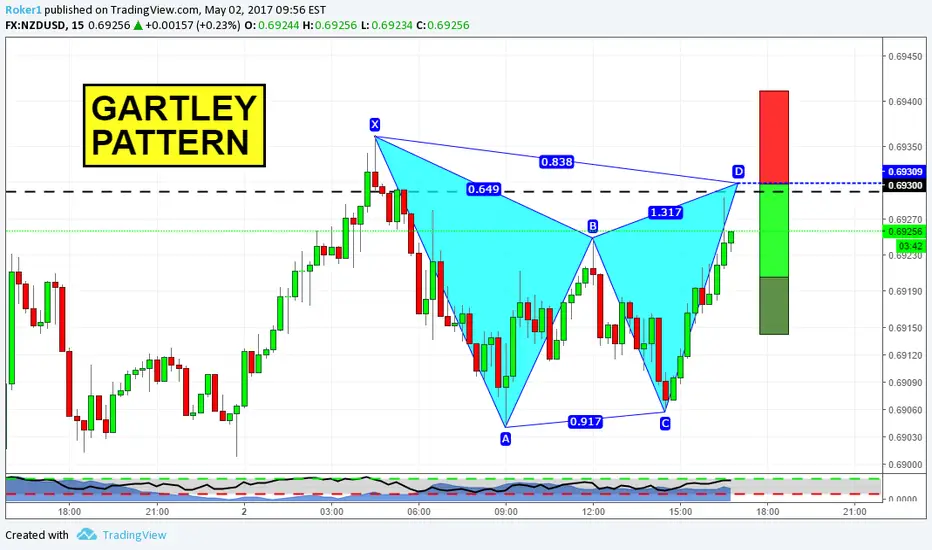
here on the chart you can see 15m timeframe on NZDUSD. This Gartley lines up pretty well with a former structure level that could act as resistance now. Therefore, the likelihood of this trade is increased by that. Stops above X, targets as usual for harmonics.
If you have questions, or if you want to share your view, feel free to comment below.
Otherwise, see you in the next chart!

Day Trading with Harmonics!Hi guys,
here on the chart you can see 15m timeframe on NZDUSD. This Gartley lines up pretty well with a former structure level that could act as resistance now. Therefore, the likelihood of this trade is increased by that. Stops above X, targets as usual for harmonics.
If you have questions, or if you want to share your view, feel free to comment below.
Otherwise, see you in the next chart!
AUDUSD gartley pattern formation 70 pips long positiongood day everyone
on the radar now we got a Gartley formation
to go for a long position waiting on a HH on a lower time frame (higher high ) and then go for the trade
happy hunting

EURUSD Bat pattern formation long good day traders
we got on the radar a bat pattern formation for the EURUSD for 40 pips
enjoy and happy hunting


Advanced Gartey Pattern Formation 1 HourHave a possible bearish Gartley Pattern Forming on the 1 hour chart looking to go short at 1.09349 (may wait for more confirmation) and placing to order looking to take 1st and second extended targets


GBPUSD Bat pattern formation long for 40 pipsgood day everyone
going now on leverage max 400 for this trade 40 pips trade long
for completion of the bat pattern
as per the targets showing


GU Cypher & ZonesLong term Short GBPUSD (looking at daily & 4H time frames)
SL: 1.29218
TP: 1.27600
Risk/Reward: 4.13 ish
Looking at roughtly 170 pips on the short, enjoy.

EUR.CAD - Short Opportunity @ 1.5109On the EUR.CAD Daily chart we have a potential short opportunity at the D leg completion of bearish Bat setup.
The price reversal zone on this pair is between 1.5109 & 1.5278
The PRZ zone is only a guideline of where we will be paying attention for trade setups and opportunity's.
Potential targets for the Bat setup placed at the .382% and .618% retracement of the C to D move.
There is also an opportunity to look for extended targets at around 1.4000
Stop loss would be placed above X leg structure resistance .
Target 1 - 1.4595
Target 2 - 1.4282

Harmonics with Structure!Hey guys,
here we are on AUDCAD hourly chart. As you can see price has created 4/5 point of the Bat pattern. Now we're just waiting for its completion to come; the black line represents a previous level of daily structure, and that increases the chances we can get a reversal from there.
Stops above X, targets as usual in harmonic patterns.
If you have questions, or if you want to share your viewpoint, feel free to comment below.
Otherwise, see you in the next chart!
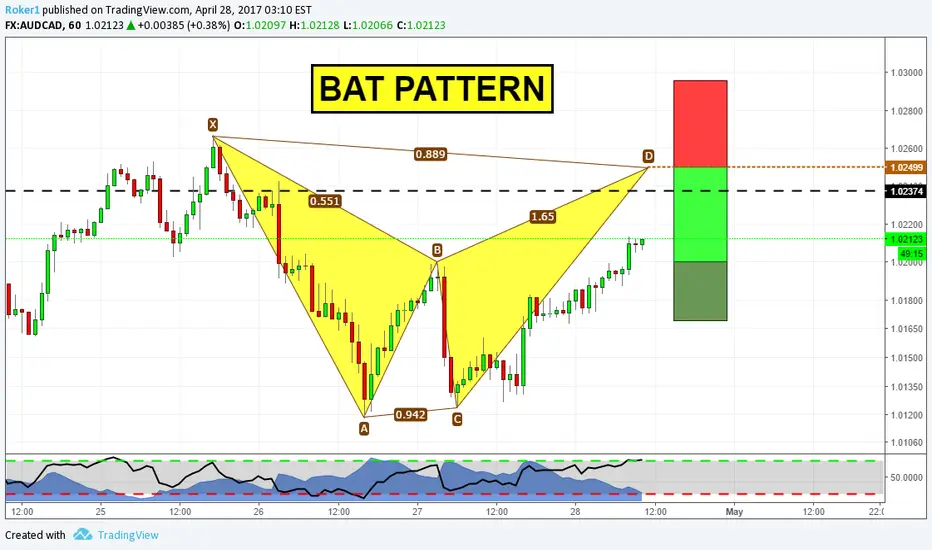
Bat Pattern on Daily StructureHey guys,
here we are on AUDCAD hourly chart. As you can see price has created 4/5 point of the Bat pattern. Now we're just waiting for its completion to come; the black line represents a previous level of daily structure, and that increases the chances we can get a reversal from there.
Stops above X, targets as usual in harmonic patterns.
If you have questions, or if you want to share your viewpoint, feel free to comment below.
Otherwise, see you in the next chart!

Bat and Butterfly on GBPI think first off all, we have decrease in gbp that support with bat pattern and then will increasing to complete bat pattern and then again fall!
Remember to use price action in 4 hour char when you want to enter the trade!
feel free to join my telegram channel:
t.me/globalmarkett
Cheers!
