An ADX Tip. :)Hello traders! I'm back from a few years away and found a little nugget on ADX in my trading notes which I wanted to share with you. As you may know I have focused the majority of my attention on candlestick analysis using Steve Nison training material. In one of his courses I have written down this quote by a significant trader he talks about sometimes,
" Some of the best buy signals are found when ADX is below 15 and begins to rise. " - Chuck Lebeau
Having seen that quote I brought up TradingView and found the most recent occurrence of that happening on the asset I was analyzing on the Weekly chart and look what I found:
Steve Nison teaches a strategy called "Trading the 9" which involves the 9, 20, & 50 period moving averages. Look, there was a Golden Cross of all of them exactly when ADX crossed above 15! Outstanding! Maybe look at adding an alert on the assets you watch for ADX crossing above 15! :)
ADX

AbuDhabi TAQA to target 4.4 after crossing resistanceDaily chart, the stock (TAQA) crossed a rising small channel (GREEN area), and is still trading inside a bigger channel, and is most likely to cross the resistance (at around 3.70)
After crossing resistance (BLUE) line, the target will be 4.40
Technical indicators RSI and MACD are positive.

Simple technicals, Northern Star Resources - NST (ASX)Northern Star Resources - NST (ASX)
In a long term bullish move, and medium term pullback with a recovery bounce off the 200-day moving average.
We are starting to see a possible convergence on the medium-term MACD, which could lead to a recovery in the medium term, if buying continues.
Full report details for members at marketmonkey.com.au
Please feel free to request more Blue Chip technicals via hello@marketmonkey.com.au
🙈

Aristocrat Leisure - is price over extended?#ASX #ALL - Aristocrat Leisure
Examining #ALL for July, the strength of buying remains moderate to strong, which is continuing to push the price higher towards the end of July.
Currently on directional indicators in the Blue Chip stock analysis report (marketmonkey.com.au), the price is over extended for a second month. This over-exuberant buying tends to decline into the third month, when prices often weaken.
No convergence as yet with the short-term moving averages, so price is likely to remain bullish in the very short term.
Please feel free to request ASX stock analysis via hello@marketmonkey.com.au
🙈

ADYEN : Many patterns and Divergence ROCADYEN : Many patterns and Divergence ROC
On the Rise : Detection of :
- 2 Falling Wedges
-Gaps to Monitor
On the decline :
-FLAG ( H1)
- Divergence ROC
-ADX and Di bearish signal
-GAPS to monitor

Borouge price is playing in a critical zone!Daily chart, Borogue stock is trading in a critical zone (YELLOW circle)
MACD is negative, RSI is descending, but -positively- near over-sold level.
Falling below support line (RED) will push the price towards 2.24, then 1.96
Above resistance line (BLUE) will target 2.60, 2.70, 2.84

After a 300% Run Mind has Retested and Gearing for More!First caught my attention by the scanner
🔎 *Symbol*: `MIND/USDT`
📈 *Signal*: `Long`
💲 *Current Price*: `0.005523`
🛑 *Stop-Loss*: `0.0029251700000000004`
💰 *Market Cap*: `0`
🚪 *Entry Prices*:
📥 Entry Price 1: `0.00422966`
📥 Entry Price 2: `0.00476767`
📥 Entry Price 3: `0.0052025000000000005`
📥 Entry Price 4: `0.005637329999999999`
🏁 *Exit Prices*:
📤 Exit Price 1: `0.00845267`
📤 Exit Price 2: `0.00932233`
📤 Exit Price 3: `0.01073`
📤 Exit Price 4: `0.01213767`
i realized this coin doesn't have an extensively long history, in fact it's very brief. But Recently We had a 300% Run. After that we Retested heading all the way down close to where a stop loss would be considerable at the bottom Fib Channel. On the other hand after a 300% a Correction is not only expected it's required.
Here are the the multiple reasons we'll Consider
MIND
a Continuation
We Have a Huge Breakout and the Swing Low Following Stayed above .213 Fib on Extension
Shortly After the Moving Average Providing Support Moved up through the Fib Channel it was Wicking toward during Correction
When ADX bottomed and turned around, the MACD Failed to break the signal line and signaled a buy now showing Strength

XEMPopped on my breakout finder
📈 *Symbol*: `XEM/USDT`
✅ *Qualification*: All MAs within 1% of MA7.
💰 *Market Cap*: `$314,594,092.89`
I'm noticing on the day the adx crossed below a level it never has and when it did the MACD signaled a Buy
With ADX When it's going upward that means trend following indicators work best
when its going down we use things like oscilators
MACD being an ocsilator pinged a buy and we're starting to uptrend. We also had a nice bounce of the .318 fib along with another breakout and swing low back tot the .5 fib showing a health upward trend as you see how volatility has completely dropped thats what the breakout/breakdown finder looks for tokens like that

Zee Super Low Marketcap with Loads of PotentialWe can see that it just pinged a buy on the MACD the same time it broke a Resistance Line on the ADX This is very Promising
We also had a second bounce of the .318 fib showing this is one of the final times for us to turn around an continue the uptrend from before.
Volume is starting to rise, seeing more bullish volume than bearish volume.
Keep an Eye out for this with such a high volume/marketcap level consistantly and previous all time high of almost $20 this thing could 1000x !
below is why zee came to our attention
📈 *Name*: ZeroSwap
🔖 *Symbol*: ZEE
💲 *Price*: $0.02238045564531504
📉 *24h Change*: -1.59%
📊 *7d Change*: 3.00%
💰 *Market Cap*: $1419572.20
🔄 *24h Volume*: $823542.18
🏷️ *Tags*: defi, launchpad, exnetwork-capital-portfolio, polygon-ecosystem, bnb-chain

ID ADX Breakout Before Price Breakout Channeling upThe MACD Signaled a Buy with the EMA Crossovers happening above the Signal Line.
We're Channeling on the 1.0 and 1.618 fib showing bullish Strength.
We can see before ID Broke out almost 100% the ADX Broke out a Resistance Line and is Now Channeling Upward
Below is the Call that Made ID Catch my Attention
🔎 *Symbol*: `ID/USDT`
📈 *Signal*: `Long`
💲 *Current Price*: `0.61248`
🛑 *Stop-Loss*: `0.18023112000000002`
💰 *Market Cap*: `286793089.6509273`
🚪 *Entry Prices*:
📥 Entry Price 1: `0.36552888`
📥 Entry Price 2: `0.42284556000000006`
📥 Entry Price 3: `0.46917000000000003`
📥 Entry Price 4: `0.51549444`
🏁 *Exit Prices*:
📤 Exit Price 1: `0.8154255600000001`
📤 Exit Price 2: `0.90807444`
📤 Exit Price 3: `1.05804`
📤 Exit Price 4: `1.2080055600000001

Ghitha is trading sideways, then targets 63 after crossing upDaily chart, Ghitha Holding (ADX, UAE) stock is trading between the resistance and support (almost a rectangle channel).
It is a good trading opportunity BUY at support, SELL at resistance, until crossing up the resistance (around 49.0), then the target will be 63.0 extending to 70.0
Technical indicators: MACD is positive. RSI indicates some minor correction or sideways movement.

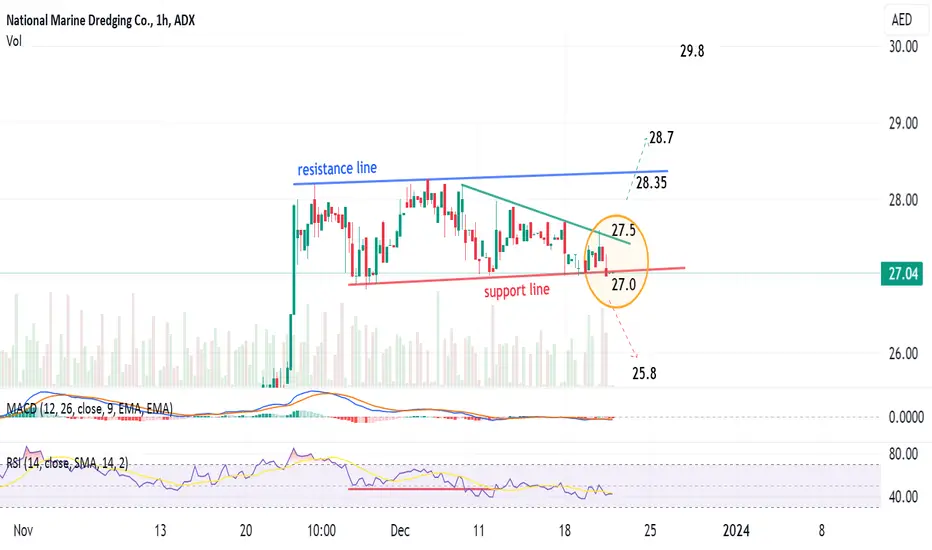
NMDC is trading in a critical level - Be careful!1-hour chart, the stock is almost on the support level, below which the target will be 25.8
Technical Indicators has inverse signals: MACD is negative, RSI is positive!
Above 27.5, the target will be 28.7 then 29.8
ADNOC GAS (ADX), to target 3.82 after crossing resistanceDaily chart, the stock ADNOC GAS is trading between support and resistance lines since mid June 2023.
A Triangle chart pattern is being formed - After the price clearly crosses the resistance line (BLUE), around 3.15 - 3.16, then the target will be 3.82, passing through some resistance levels as shown on the chart.
ENTRY #1 : BUY at touching the support line (RED) around 3.02 - 3.03 and rebounding.
Stop Loss below 3.00
ENTRY #2 : BUY after clear crossing of resistance line (closing 2 days above / or one day and high volume)
Stop loss after breaking down resistance line.

NMDC to target 31 / 32.4 after crossing 28.41-hour chart, NMDC, after crossing the blue line at 28.4, the target will be 31 extended to 32.4
A chart pattern (ascending rectangle) will be formed.
Technical indicators RSI and MACD are supporting this view.
Stop loss 27.5

ADX Trend-Based StrategiesThe Average Directional Index is a highly-respected tool in many traders’ arsenals, capable of measuring the strength of market trends. This article delves into two ADX-based strategies, exploring how to combine this tool with other popular indicators like RSI and EMA for a well-rounded trading system.
Understanding the ADX Trend Indicator
The Average Directional Index (ADX) is a trend strength indicator commonly used in technical analysis. It helps traders identify the strength of market trends, thereby serving as a key component in crafting an effective trend trading strategy.
Originally developed by Welles Wilder, the ADX oscillates between 0 and 100, providing a quantitative measure of trend strength. When its value is below 25, the trend is typically weak or non-existent. Conversely, readings above 25 signify a stronger trend, with values over 50 suggesting a very strong trend. Traders often use these numerical benchmarks to assess whether to enter or exit a trade based on the prevailing trend conditions.
Importantly, this tool does not indicate the direction of the trend; rather, it measures the trend's intensity. Therefore, it is often used in conjunction with other indicators to provide a complete picture of market conditions. This makes the ADX a versatile and valuable indicator for any trader aiming to build a robust trend trading strategy.
Basic Parameters for ADX
The ADX usually comes with a default setting of a 14-period lookback. This means the indicator evaluates the trend strength based on the last 14 bars, whether you're using a daily, hourly, or any other time frame.
In most trading platforms, including FXOpen’s own TickTrader platform, setting up the ADX involves selecting it from the platform's list and then choosing the period parameter. Some traders tweak the period to fit their trading style, although caution is advised when straying from the standard settings.
Interpreting ADX signals is straightforward: a rising value suggests an intensifying trend, while a falling value indicates a weakening trend. This makes it easier for traders to gauge market conditions and determine their trend-following strategy.
ADX and RSI Strategy
The Relative Strength Index (RSI) is often dubbed one of the best trend indicators when used in combination with ADX. When employed together, they form a powerful duo to identify trend strength and market momentum.
For this strategy, both indicators are used at their default settings: a 14-period lookback for both ADX and RSI. Horizontal lines are drawn at 45 and 55 on the RSI window and at 25 on the ADX window to serve as reference points.
Entry
When the RSI rises above 55 or falls below 45, traders wait for the ADX to cross above the 25 level to enter.
It's discretionary for traders to decide whether to enter when the RSI is in overbought (above 70) or oversold (below 30) territories. While these conditions may offer trading opportunities, they can also be riskier as the trend could easily continue.
Stop Loss
Traders often position a stop loss above or below a nearby swing point to protect their trades.
Take Profit
Profits may be taken when the ADX falls below 25, signalling a weakening trend.
Alternatively, traders can opt to exit the trade at a predetermined support or resistance level.
ADX and EMA Strategy
The Exponential Moving Average (EMA) is a type of moving average that responds quickly to price changes and new trends. For this setup, the EMA is configured to a 28-period lookback, while the ADX retains its default 14-period setting. The EMA is essentially another trend filter, acting as a useful baseline for trend direction.
Entry
Traders look for entry opportunities when the price is either above or below the 28-period EMA, indicating the direction of the trend.
Once the ADX crosses above 25, confirming trend strength, traders wait for the price to retrace back to the EMA line to enter the trade.
Stop Loss
A stop loss may be positioned just beyond the EMA.
Alternatively, placing the stop loss at a nearby swing point offers another way to mitigate risk.
Take Profit
Profits might be taken when the ADX falls below the 25 level, suggesting that the trend may be losing momentum.
As another option, traders may choose to exit at a predetermined support or resistance level.
Benefits and Risks of ADX Trend Trading Strategies
Understanding the benefits and risks associated with ADX-based strategies is crucial for traders aiming for consistent returns. Here's a breakdown:
Benefits
Objective Trend Strength: ADX quantifies trend strength, removing subjective guesswork.
Versatility: ADX can be combined with various other indicators like RSI and EMA to create multi-dimensional strategies.
Clear Signals: Thresholds like ADX 25 provide clear, easy-to-understand entry and exit signals.
Risks
Lagging Indicator: Being a trend-following tool, ADX can lag, potentially causing late entries or exits.
False Signals: Market volatility can lead to false ADX signals, especially in lower time frames.
The Bottom Line
In essence, mastering the ADX indicator can equip traders with the ability to discern even stock trend patterns effectively. Its versatility and simplicity mean it’s a great inclusion for trend-following strategies. The strategies given here offer a foundation to work with, but it’s well worth experimenting for yourself and seeing how the ADX works in practice.
If you’re looking to put these trading techniques into practice, you can consider opening an FXOpen account. You’ll gain access to the advanced TickTrader platform, hundreds of markets to choose from, and competitive trading fees. Good luck!
This article represents the opinion of the Companies operating under the FXOpen brand only. It is not to be construed as an offer, solicitation, or recommendation with respect to products and services provided by the Companies operating under the FXOpen brand, nor is it to be considered financial advice.

ADIB Abu Dhabi to target 46 after crossing 39 (blue line)ADX:ADIB
ADIB (ADX ), on the 1-hour chart, is seen as trying to cross the resistance line (blue) at 39, then the target will be 46.
EITHER Buy here, and stop loss is 37.6
OR Buy after crossing the blue line at 39, and Stop Loss at 38.8
Another scenario is going to test the support (red line) at 35.5, then it is a buy opportunity to go up to 39.5 (blue).
Stop Loss is 35.4
Either ways, it is a nice trading opportunity.

The ADX DeFi (Definace of the ADX)The ADX indicator has always been a eye sore for me. I thought it was time to clean it up a bit. While its been around for a long time, it never really seems to get better. The new releases I keep seeing are just more lines and more zigzags etc.
So this is my take on the ADX which I call "The ADX DeFi (Adx Defiance)"
I dont want to know that the momentum is almost there or just about bla bla. I want to know either there IS or IS NOT what I need and why.

A new wave up in ADNOC GASADNOC Gas Processing is a natural gas producing company and the largest gas processing complex in Abu Dhabi.
The share of ADNOC GAS went up in an impulse from march 2023 and completed the impulse wave up by august 2023
From Aug. 2023 to Oct 2023 the share corrected 61.8% of the entire rise in the form of an Elliot Wave zig zag(ABC).
The Wave 3 for the stocks seems to have started off and the projected target for the same would be approx.4.15 AED(26% from CMP).
Note*- This post is for educational purpose only

4 Best Trend IndicatorsIdentifying market trends can be challenging, but there are tools that can help. One common question traders often grapple with is: What are the best trend indicators? This article aims to shed light on four of the top trend tools traders use.
For the best experience, head over to FXOpen’s free TickTrader platform. There, you’ll find each indicator ready for you to practise with.
Moving Averages
Moving Averages (MAs) are one of the best stock trend indicators. It's also widely used in other financial markets, including forex, commodities, and cryptocurrencies*. They smooth out price data to create a single flowing line, which makes it easier to identify the direction of the trend. Two popular types are the Simple Moving Average (SMA) and the Exponential Moving Average (EMA), the latter giving more weight to recent prices.
One classic trading strategy involving MAs is the "crossover." A crossover occurs when a short-term MA crosses above or below a long-term MA. When the short-term MA crosses above the long-term MA, it's generally seen as a bullish signal, indicating a potential uptrend. Conversely, a downward crossover of the short-term MA below the long-term MA is considered bearish, suggesting a possible downtrend.
Additionally, the position of the asset's price relative to the moving average line can provide insight. If the price exceeds the MA line, it often signifies an ongoing uptrend. Conversely, a price below the MA typically indicates a downtrend.
Average Directional Index (ADX)
The Average Directional Index (ADX) is a technical indicator used primarily for gauging the strength of a trend rather than its direction. One of the best indicators for trend trading, the ADX operates on a scale from 0 to 100. It can include a single ADX line or can consist of three lines: the ADX line itself, which measures trend strength, and the Positive Directional Indicator (+DI) and Negative Directional Indicator (-DI), which identify the direction (the DMI indicator on the TickTrader platform).
A reading above 25 on the ADX line is generally considered indicative of a strong trend, either upward or downward. A reading below 20 often suggests no clear trend and that the market is moving sideways. Traders usually combine the ADX with other trend-following indicators to establish the direction of the trend.
It's important to note that the ADX does not signal the beginning of a trend; rather, it confirms that a trend is actually in place and gauges its strength. This makes it an invaluable tool for traders looking to enter trades that align with strong existing trends.
Relative Strength Index (RSI)
The Relative Strength Index (RSI) is a momentum oscillator that ranges from 0 to 100 and is used to identify overbought or oversold conditions. However, it can also serve as a rudimentary trend indicator. The RSI calculates the ratio of upward moves to downward moves and normalises the calculation to provide a value that is expressed on a scale from 0 to 100.
Traditionally, values of 70 or above indicate an asset may be overbought, while values of 30 or below suggest it may be oversold. But when it comes to trend analysis, a value above 50 often implies that the asset is in an uptrend, whereas a value below 50 can indicate a downtrend.
RSI is particularly useful when confirming trends identified by other indicators. For example, an RSI above 50, along with a moving average crossover, would be a strong signal supporting an uptrend.
Bollinger Bands
Bollinger Bands are a tool often favoured by trend traders. They consist of three lines: a middle band, which is a simple moving average (SMA), and two outer bands that are standard deviations away from the middle band. This creates a channel within which asset prices typically move.
Although primarily known for measuring market volatility, Bollinger Bands can also serve as trend indicators. When prices hug the upper band, it's usually a sign that the asset is in an uptrend. Conversely, a downtrend is likely if prices gravitate toward the lower band.
The width between the bands can also signify trend strength. A widening gap indicates increasing volatility and the possible continuation of a current trend, whereas narrowing bands suggest decreasing volatility and potential trend reversal. When used in conjunction with other tools, like those listed here, Bollinger Bands can be one of the best trend forex indicators.
Final Thoughts
Understanding and employing the right trend indicators can be a game-changer for traders seeking to maximise their effectiveness. These four tools provide invaluable insights into market direction and strength and deserve a place in any trader’s toolkit.
To put them into practice, consider opening an FXOpen account. You’ll gain access to hundreds of exciting markets, competitive trading costs, and lightning execution speeds. Happy trading!
*At FXOpen UK and FXOpen AU, Cryptocurrency CFDs are only available for trading by those clients categorised as Professional clients under FCA Rules and Professional clients under ASIC Rules, respectively. They are not available for trading by Retail clients.
This article represents the opinion of the Companies operating under the FXOpen brand only. It is not to be construed as an offer, solicitation, or recommendation with respect to products and services provided by the Companies operating under the FXOpen brand, nor is it to be considered financial advice.

Finally Adx Testing Multi Year Trendlineseems like bottomed out and getting ready for massive recovery
in downtrend from last year now testing trend line in 3 days tf expecting breakout too
incase of successful breakout expecting solid recovery in coming weeks expecting 120 to 140% bullish rally incase of breakout

Will it come down?The trend is still positive, for now Rak Properties is establishing its support zone, I think very soon bulls will charge in and push the price higher. I have bought some quantities at 1.14 will wait for a bullish candle to close above 1.16 to add more. Although it can even come down lower to retest 1.10 area. Will wait for price action at that support to buy more quantities.
Hit like & follow guys ;)

PowerfulTrend
It have started fresh trend, price is right near 200 day EMA once it clear sky is the limit. But for now 24.00 is a hurdle.
If it comes down to retest 22.35 i would consider this as buying opportunity. Volumes are now increasing on daily basis looks like people are jumping in.
Hit like & follow guys ;)

Its a PAINTrend
Its been just going side was for ages now, once it breaks 3.46 and closes above with good volumes thats when we can have a trend confirmation. With last weeks closing its looking weak.
Breakout
Once we see a confirmed breakout that's when we can plan out buys for now its in a no trading zone it can retest support 1 and support 2 area. Also the have announced bonds that got listed on ADX this stock is looking good.
Hit like & follow guys ;)
