ETH still favoring the bearsSupport and resistance can be found in this blue wedge type pattern as price falls. The previous historical low around $198 has been breached to the downside, which brings in the next area of support around $175 (a significant low from last year). The validated break below the blue 61.8% sets up a full retracement opportunity near $138.
Sentiment remains bearish this week ad the internal momentum gains strength. The ADX, which measure trend strength is increasing along with an elevated red negative directional index. Look for a flat to lower ETH market this week.
Critical Resistance: $255.00
Key Resistance: $236.49
Key Support: $175.00
Critical Support: $127.83
ADX

BTC still shows a flat to lower market this weekThe 61.8% level marked on the chart was once support (area of buying interest), but now is resistance (area of selling interest). This retracement level is actually critical resistance this week that needs price to bust to the upside with some buying momentum to back it up. This is what is needed to get BTC out of the sideways to lower pattern that has formed.
Sentiment is leaning toward a “sell any rally attempt” mentality. The ADX, which measures trend momentum is increasing with the red negative directional index line still in control. This highlights a triangle pattern where price is likely to travel this week. The previous low is the target around $5858 and could even slipp lower toward the $5400 mark.
This bearish call for the week would be negated on a break of the 61.8% level to the upside (with momentum indication to back it up). Happy Trading!
Critical Resistance: $6,458.60
Key Resistance: $6,375.00
Key Support: $6,119.00
Critical Support: $5,858.60
Want to talk technical.. come see me at the Cryptomarket360 Discord channel.

USD Strong on Geopolitical FactorsThe US dollar has been a bit volatile over the past several weeks owing to mixed signals over the trade war, an ongoing spat between Trump and the Fed over the trajectory of interest rate hikes, and the ongoing NAFTA saga.
Although the technicals for USDJPY seem to be bearish at the moment, we don't have a lot of conviction.
The current price of USDJPY is 111.09.
We will find resistance from levels from above including:
111.84 from highs and lows over the past 14 periods
112.16 from highs and lows over the past 30 periods
113.14 from highs and lows
We will find support from levels from below including the following:
109.80 from highs and lows over the past 14 periods
109.25 from highs and lows
As for Technical Analysis we have the following. Volatility is much lower than usual, anticipate a breakout soon. The RSI is 50, which suggests that we are in a bear trend, but not oversold. The MACD is above the signal line, but not by too much, suggesting that we are in a bull trend which may continue. USDJPY is under the 50 period SMA, which is currently at 111.18, indicating bearishness. The ADX does not indicate a trend, i.e. we are ranging.
We are above the central moving average of the Kovach Reversals Indicator at 111.01, and fairly close to it. If we can gain some momentum, the upper bound of the KRI indicator at 111.87 will provide resistance.
Daily scores: Bull Score: 1 Bear Score: 2 Ranging Score: 2
USDJPY intraday seems to be poised for a bull breakout. There is a bull wedge forming on 15 minute candles and the Kovach OBV is strong.
We will find resistance from levels from above including the following:
111.54 from highs and lows over the past 14 periods
111.84 from highs and lows over the past 100 periods
Levels from below will provide support, including:
110.94 from highs and lows over the past 30 periods
110.70 from highs and lows over the past 100 periods
As for Technical Analysis we have the following. Volatility is much higher than usual. We should expect some consolidation at some point. The RSI is 62, indicating that we are in a bull trend, but not yet overbought. The MACD is above the signal line, but not by too much, suggesting that we are in a bull trend which may continue. USDJPY intraday is above the 50 period SMA, indicating a bull trend. Furthermore, We are well above the 100 period SMA, which suggests that we are overbought. Finally, the 50 period SMA is even with the 100 period SMA, indicating longer term ranging. The ADX indicator is bullish.
Currently, USDJPY intraday is above the central moving average of the Kovach Reversals Indicator, which sits at about 111.29. However, it is getting closer to the upper bound of this indicator at 111.59, which will provide resistance.
Intraday Scores:Bull Score: 6 Bear Score: 0 Ranging Score: 1

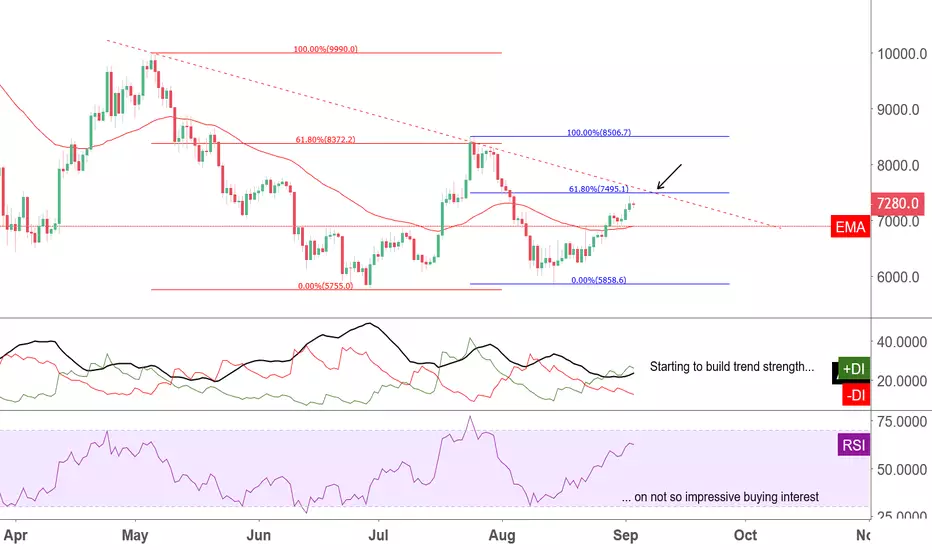
Fibonacci Levels Are Key for BTC$7,495.10 is the golden ratio line to watch this week as key resistance.
The black arrow marks an intersection of the bearish dotted trend line and the blue 61.8% Fibonacci level. This intersection is the spot where resistance is likely to be tested, but can price break to the upside this week?
The last time a key 61.8% Fibonacci level was tested the market held as a ceiling. The red 61.8% level shows where the rally stalled and dropped back. The Average Directional Index (ADX) at the time the red 61.8% line was being examined, price was looking to stall and indicators were gearing up for the bull trend momentum to dry up.
As price approaches the blue 61.8% level this time the ADX is making a small turn to the upside, and staying inside the 20-30 trend strength building zone. This indicates a small amount of buying interest is building and trying, but is likely not enough to push through this intersection of resistance. (There is a bearish divergence going on inside tighter time frame charts)
A break of the blue 61.8% Fibonacci level to the upside would set up a full retracement to the blue 100% level, which would put us right back to the test of the red 61.8% Fibonacci level. The red 61.8% level is the ceiling level price needs to break to get this market back in the bull camp longer-term.
For now a break to the upside is slim at the moment. If the blue 61.8% Fibonacci level is not breached this week, back to previous lows we go.
Critical Resistance: $8,372.20
Key Resistance: $7,495.10
Key Support: $6,872.00
Critical Support: $5,858.60
ADX is preparing for growthAdEx price of 3 weeks is in the range of 0.000026 - 0.000032. I expect further growth to levels: 0.00005 and 0.00008
I want to tell you about a service that expands trading opportunities. 3commas (3commas.io) is a service that is a platform for traders with various tools that help to trade more effectively. For example, you can simultaneously set stop loss and take profit
When registering, you will have 3 days of professional fare (free of charge)

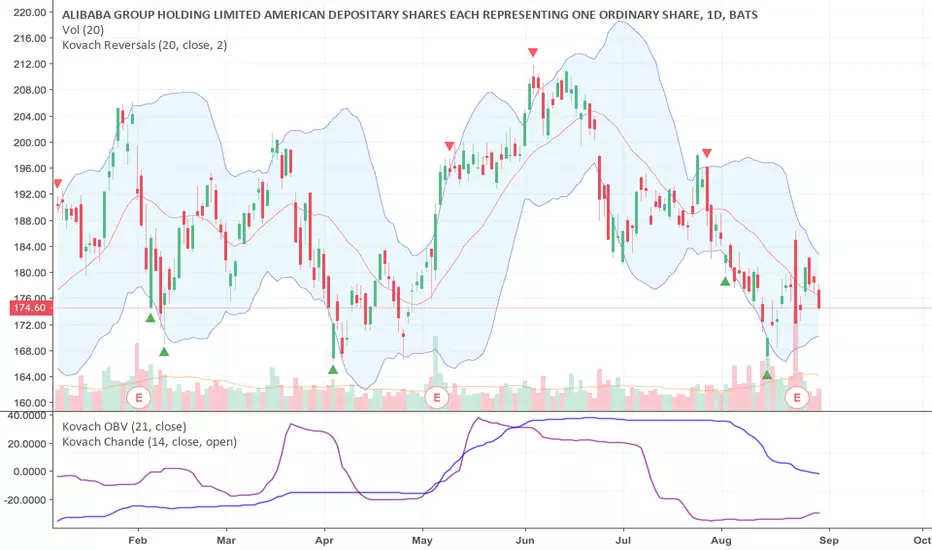
BABA Looking BearishThe technical analysis for BABA is somewhat bearish. There isn't a lot of conviction here so be careful when entering a trade.
Currently, BABA is trading at $174.61.
Levels from above include:
174.79 from gaps
176.20 from gaps
177.00 from gaps
178.16 from volume profile over the past 14 periods
178.90 from volume profile over the past 14 periods
179.53 from volume profile over the past 14 periods
180.38 from volume profile over the past 14 periods
181.95 from gaps
182.38 from volume profile over the past 14 periods
182.90 from gaps
We will find support from levels from below including:
174.20 from gaps
173.85 from gaps
172.41 from gaps
172.05 from gaps
171.29 from gaps
170.77 from gaps
169.85 from gaps
165.39 from highs and lows over the past 14 periods
As for Technical Analysis we have the following. Volatility is slightly higher than usual, but not to an extreme. An RSI value of 43 suggests that we are in bear mode but not oversold yet. The MACD suggests that we are in a bullish phase but not overbought yet. The 50 period SMA indicates that we are in a bear trend. Furthermore, We are well below the 100 period SMA, which suggests that we are oversold. Finally, the SMA(50) is below the SMA(100), a long term bearish confirmation. The ADX suggests that BABA is ranging.
Currently, BABA is well above the lower bound of the Kovach Reversals Indicator, at 169. This should provide support. The central moving average of the KRI will provide resistance at 178, if needed.
Bull score: 1, Bear score: 5, Ranging score: 2
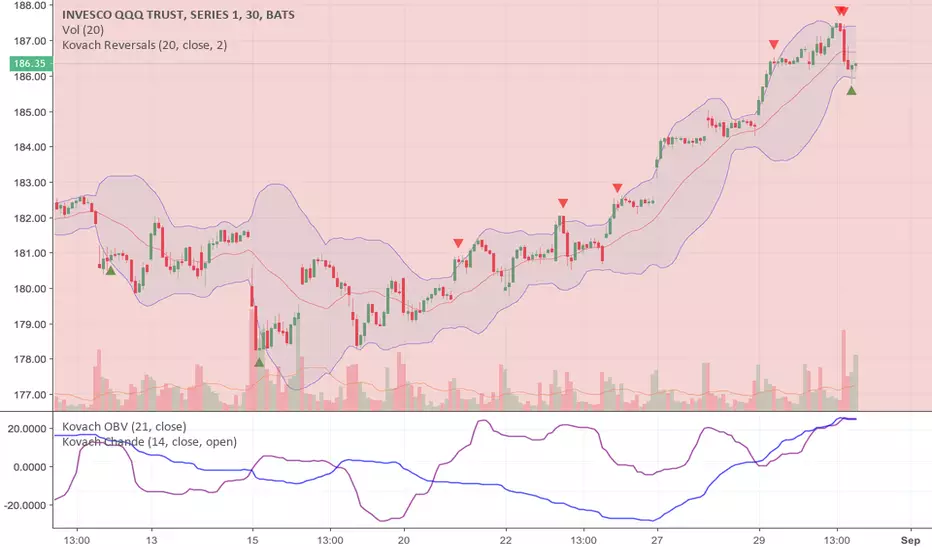
QQQ to the MoonQQQ is quite bullish. There are many technical indications of strength, but it would be wise to wait for a better price, rather than buying and getting caught in a retracement.
The current price of QQQ is $186.41.
We will find resistance from levels from above including the following:
187.52 from highs and lows over the past 14 periods
We will find support from levels from below including:
185.03 from volume profile over the past 14 periods
184.07 from volume profile over the past 30 periods
183.48 from volume profile
182.68 from volume profile over the past 30 periods
181.69 from volume profile over the past 30 periods
179.45 from volume profile
178.12 from highs and lows over the past 14 periods
177.74 from volume profile over the past 100 periods
177.12 from volume profile over the past 100 periods
175.72 from volume profile over the past 100 periods
As for Technical Analysis we have the following. Volatility is much lower than average, so a breakout can be expected. The RSI is 70, suggesting that we are in bull mode, but not overbought just yet. The MACD is above the signal line, but not to an extreme. This suggests we may have more room to appreciate. QQQ is substantially above the 50 period SMA, which is at 179. This indicates that QQQ is overbought. Also, QQQ is well above the 100 period SMA, which is 173 at the moment, suggesting that we are overbought. Finally, the SMA(50) is above the SMA(100), a long term bullish confirmation. The ADX indicator suggests a bull trend, at 35.
We are getting closer to the upper bound of the Kovach Reversals Indicator at 186. This should provide resistance. The central moving average of the KRI will provide support at 181.
bull score: 8 bear score: 0 ranging score: 0
Stocks Still StrongThe technical analysis for SPY is very strong. We see many indications of a strong bull trend. It would be wise to buy on a dip.
The current price of SPY is $290.32.
We will find resistance from levels from above including the following:
291.74 from highs and lows over the past 14 periods
Levels from below will provide support, including:
289.60 from volume profile over the past 14 periods
288.44 from volume profile over the past 30 periods
286.76 from volume profile over the past 14 periods
285.97 from volume profile over the past 30 periods
283.73 from volume profile over the past 100 periods
283.03 from volume profile
281.28 from volume profile over the past 100 periods
279.88 from volume profile
278.77 from volume profile
278.01 from volume profile over the past 100 periods
The technicals for SPY are as follows. Volatility has consolidated quite a bit, expect a breakout soon. The RSI is 68, which suggests that we are in a bull trend, but not overbought. The MACD is above the signal line, suggesting the bull phase may continue. SPY is well above the 50 period SMA, which is 281 at the moment, suggesting that we are overbought. Further, SPY is substantially above the 100 period SMA, which is at 276. This indicates that SPY is overbought. Finally, the 50 period SMA is above the 100 period SMA, indicating longer term bullish confirmation. The ADX indicator shows a bull trend.
We are above the central moving average of the Kovach Reversals Indicator at 285, but getting closer to the upper bound of this indicator at 291. Watch for resistance at this level.
Bull score: 8, bear score: 0, ranging score: 0

Square is Ripping! But Don't Buy out of FOMO...SQ shows multiple signs of a strong bull trend. Be careful when looking to buy lest you get caught in a retracement.
Currently, SQ is trading at $87.88.
We will find resistance from levels from above including the following:
89.22 from highs and lows over the past 14 periods
We will find support from levels from below including the following:
69.88 from sma 50
68.90 from highs and lows over the past 14 periods
63.21 from highs and lows over the past 30 periods
43.72 from highs and lows over the past 100 periods
38.80 from highs and lows
As for Technical Analysis we have the following. Volatility is extremely high. Expect some consolidation soon. The RSI is 79, indicating that we are overbought. A bear pullback or trend reversal can be expected. The MACD is quite a bit above the signal line suggesting that we may have a trend reversal or pull back soon. SQ is above the 50 period SMA by quite a bit, suggesting that we are overbought. Furthermore, We are well above the 100 period SMA, which suggests that we are overbought. Finally, the 50 period SMA is above the 100 period SMA, indicating longer term bullish confirmation. The ADX is at 70, which is strongly bullish.
We are above the central moving average of the Kovach Reversals Indicator at 74, but getting closer to the upper bound of this indicator at 85. Watch for resistance at this level.
bull score: 11, bear score: 0, ranging score: 0

Exxon Mobile RangingXOM appears to be ranging, based on the analysis. Be careful trading either long or short, so you don't get caught in a breakout.
At the time of this writing, XOM was trading at $80.50.
We will find resistance from levels from above including the following:
80.87 from gaps
81.04 from highs and lows over the past 100 periods
We will find support from levels from below including:
80.35 from highs and lows over the past 30 periods
80.12 from highs and lows over the past 100 periods
The technicals for XOM are as follows. Volatility is slightly higher than usual. The RSI is 51, indicating that we are in a bull trend, but not yet overbought. The MACD is below the signal line, but not to an extreme. This suggests we are in a bear phase with room to go. XOM is above the 50 period SMA, which is currently at 80, indicating bullishness. The 100 period SMA indicates that we are in a bear trend. Finally, the 50 period SMA is about on par with the 100 period SMA which suggests we are ranging. The ADX indicator, 2 suggests that XOM is ranging.
We are below the central moving average of the Kovach Reversals Indicator at 81, and fairly close to it. If we lose momentum, we'll have support from the lower bound of the KRI at 80.
bull score: 2, bear score: 2, ranging score: 3

XOM RangingXOM seems to be ranging. Bullish and bearish are extremely ambivalent right now.
Currently, XOM is trading at $80.86.
We will find resistance from levels from above including the following:
81.91 from volume profile over the past 30 periods
82.34 from volume profile over the past 100 periods
83.06 from volume profile over the past 100 periods
84.40 from highs and lows over the past 30 periods
Levels from below will provide support, including:
80.80 from volume profile over the past 100 periods
80.05 from volume profile
79.81 from volume profile
79.56 from volume profile
79.38 from volume profile
78.95 from volume profile
78.77 from volume profile
76.51 from highs and lows over the past 14 periods
74.80 from highs and lows over the past 100 periods
72.16 from highs and lows
As for Technical Analysis we have the following. Volatility is much lower than average, so a breakout can be expected. The RSI indicates that we are in a bull trend, but not overbought yet. The MACD is above the signal line, but not to an extreme. This suggests we may have more room to appreciate. The 50 period SMA indicates that we are in a bear trend. Also, XOM is above the 100 period SMA, which is currently at 81, indicating bullishness. Finally, the 50 period SMA is about on par with the 100 period SMA which suggests we are ranging. The ADX suggests that XOM is ranging.

MU Somewhat BearishMU shows bearish signs, but they're not overwhelmingly strong. Read further for more technical analysis.
At the time of this writing, MU was trading at $51.83.
Levels from above will provide resistance, including:
51.98 from volume profile over the past 14 periods
52.09 from volume profile over the past 14 periods
52.36 from gaps
52.80 from gaps
53.21 from gaps
54.17 from gaps
54.58 from gaps
54.83 from gaps
55.48 from gaps
55.64 from gaps
We will find support from levels from below including:
51.80 from volume profile over the past 14 periods
51.51 from volume profile over the past 14 periods
51.33 from volume profile over the past 14 periods
51.17 from gaps
51.03 from gaps
50.82 from gaps
50.68 from volume profile over the past 14 periods
50.39 from volume profile over the past 14 periods
50.25 from volume profile over the past 14 periods
50.01 from gaps
Lets look at some technical analysis for MU. Volatility has consolidated quite a bit, expect a breakout soon. The RSI is 51, indicating that we are in a bull trend, but not yet overbought. The MACD is above the signal line, but not to an extreme. This suggests we may have more room to appreciate. MU is below the 50 period SMA, which indicates a bear trend, but not oversold yet. The 100 period SMA indicates that we are in a bear trend. Finally, the 50 period SMA is below the 100 period SMA, indicating longer term bearish confirmation. The ADX indicator, 7 confirms that MU is ranging, that is, no significant trend is observed.

Stocks Looking BullishThe technical analysis for SPY is very strong. We see many indications of a strong bull trend. It would be wise to buy on a dip.
Currently, SPY is trading at $291.54.
We will find resistance from levels from above including the following:
291.65 from highs and lows over the past 14 periods
Levels from belowwill provide support, including:
289.47 from Volume profile over the past 14 periods
288.38 from Volume profile over the past 30 periods
286.77 from Volume profile over the past 14 periods
285.92 from Volume profile over the past 30 periods
282.69 from Volume profile over the past 100 periods
281.54 from Volume profile over the past 100 periods
280.16 from Highs and lows over the past 14 periods
278.71 from Volume profile
277.14 from Volume profile over the past 100 periods
275.93 from Volume profile
274.82 from Volume profile
274.08 from Volume profile
259.05 from Highs and lows over the past 100 periods
254.67 from Highs and lows
The technicals for SPY are as follows. Volatility is much lower than average, so a breakout can be expected. The RSI is 73, indicating that we are in a bull trend, but not yet overbought. The MACD is above the signal line, suggesting the bull phase may continue. SPY is well above the 50 period SMA, which is 281 at the moment, suggesting that we are overbought. Also, SPY is above the 100 period SMA by quite a bit, suggesting that we are overbought. Finally, the SMA(50) is above the SMA(100), a long term bullish confirmation. The ADX indicator shows a bull trend.

AdEx VS Bitcoin - Time for a Trend Reversal?Since the beginning of January AdEx has been loosing in value against the Bitcoin. Price has decline from 25k satoshis down to the recent low at 2.5k satoshis, resulting in a x10 time price drop, which is a 90% loss.
On the 15th of August, when ADX/BTC hast reached the bottom at 2.5k satoshis, AdEx has tested the lower trendline of two descending channels, which were rejected simultaneously. The interesting moment is that new Fibonacci Time Zone cycle has just started, exactly at the date when ADX reached the recent low.
It is very likely, that if current low will hold, AdEx could be on its way to establish a long term uptrend, or a strong corrective move north at the very least. Price is expected to reach strong resistance that is seen at 13.7k satoshis area, confirmed by 76.4% and 50% Fibonacci retracement levels.
The upside target also corresponds to the uptrend trendline and the next Fibonacci time zone cycle, which will start on the 12th of January 2019. Therefore, the upside potential is 450% with the time horizon of 5 months.
But at the same time price could reach the upside target earlier, that could be the confirmation of a strong bullish move up until the January 2019. Price could reach and surpass the previous all-time high, established back in August 2017, when price almost reached 60k satoshis.

Risk but valuable (25-08) #ADX #AdEx - CryptoStation#ADX (ADX/BTC)
Buy : 2770
Sell : 2800-2850-2875
If 2900 level break :
Sell : 2950-3000-3050-3100
Stop : 2550

[Red Apple] "What is the next movement??? "_BTC/USD_18.08.13I expected rebound and then, be blocked 20EMA on 4H. At the moment, it moves sideways.
Let's analysis BTC~
If you are busy, you can just read below briefly
'A. Briefing '
'E. Summary and Strategy'
before read, click '+Thumb up, +Follow' :-)
A. Briefing
. move sideways along with 20EMA on 4H
B. Weekly Chart
a. Candle
If there's one more bearish candle, it can be formed 'Three Black Crows' pattern.
b. EMA
20EMA will say to 50EMA soon "long time no see since Nov.2015"
c. Pattern
Adam & Eve pattern (Double bottom) -> right bottom can be dipped more -> the moment for Buy is the time when it penetrate neck-line, not now.
d. Sum.
There's no positive signal.
C. Daily Chart
a. Trend
Descending
b. Candle
possibility for Three method
c. EMA
All EMAs are in reverse order
d. Indicators
a) Hidden Bearish Divergence on CCI
b) MACD line and signal line are under '0'
c) ADX -> -DI -> +DI, ADX line is heading up -> indicate 'Bearish market'.
e. Sum.
There's no Buy signal. Many indicators are showing additional drop and even it goes up, $6500 can be resistance line shortly.
D. 4H Chart
a. EMA
All EMAs are in reverse order
b. Elliott Wave
if it falls down under $5755, Elliott waves fail.
c. Fibonacci
blocked by 0.786
d. Sum.
just following 20EMA on 4H and there's no special pattern. the most importance mission for BTC is penetration of 20EMA on 4H.
E. Strategy and Summary
High Time Frame charts show negative signal. if there's 'Dead Cross' on weekly chart, BTC can be in long period of stagnation. hope this week is reversal point. In personal, it can be dropped one more time.(if it becomes real, check my previous idea)
a. About previous briefing : keep commenting about 20EMA on 4H and it's moving along with it.
b. About this briefing :
b.1 For Aggressive Traders : Buy when it penetrate 20EMA -> take profits(1~2%) shortly($6500 can be worked as resistance line)
b.2 For Conservative Traders : wait until breakout of 20EMA and check Buy signal.
Trade Safely~~
If you think my idea is helpful for you, Click ' +Thumb up, +Follow'
Also, if found something special, i will comment in real time.

Adex(ADX) Support Line BuyAdEx(ADX) is hitting its all-time low support, from 1 year ago, @ 4.2k
Around 2 weeks ago, it had a breakout from the trendline, with the price peaking with an increase of 2x and a global volume of 100$ million, which shows that there are a lot of eyes watching this market, waiting for something to happen.
Now that the price is right at the support(green), also near the new support trendline(orange), it is a good time to start slowly buying, and enter into your actual trade once the volume & price start increasing again(Don't buy too much unless if you see it quickly gaining momentum).
Also, there is strong macd divergence, with the price falling but the macd increasing, as seen with the blue arrows.
You should always cash out as the price increases, but my plan is to place a the main sell order near the resistance(red), and sell along as time passes.
As I said before, wait for it to gain some momentum, as it could just slowly go below the support without much action, if there isn't an initial push upwards.
Coin Details:
Market cap: $21.288.606
24 Hour Volume: $1.928.644 USD
Price: $0,289914
I haven't published a public idea on tradingview for a long time now, let's see how this goes

Wheat, Soybeans, and CornWhy Wheat and why now. What about Soybeans and Corn.
Looking across the Ags, it seems that Wheat is enjoying the most upside. Why is this. In keeping with my focus on the DMI and ADX, I think you’d have start by looking at the monthly chart of the 3. One of the key tenants of DMI/ADX is that best trades seem to originate when the ADX is below 20 for an extended period of time. And, for Wheat, that has been since June of 2013. Since then, it has moved between a couple of lines and for the most part, remaining below the 13 period EMA of the high.
As an aside, in my previous articles, I used EMA’s on the close of price but have moved to a 13EMA on high, 26EMA on low and 20EMA on close with the intent to use them as a channel for pullbacks based of ADX action.
June of last year, the downtrend line was sharply broken but before that, the DMI made a significant move when the +/-DI swapped. Although this had happened several time during the past 4 years, what eventually became important is that the low of this candle was never broken while the high was continually tested and broken with the last time starting the recent uptrend. Also, note that during this time that the +DMI continued to make higher highs will not making lower lows. With the ADX moving above 20 in May of this year, a strong signal was given that the market was ready to move up.
Now, consider the same discussion for ]Soybeans :
Notice the size of the candle that caused the last swap. I’ve included a possible consolidation pattern.
And for Corn :
With Corn the interesting thing on recent action is that the DI’s changed dominance but did so where the swap was to -DI but with a green candle. I don’t see this too often but seems to give mixed signals.

Trading the DMI with ADX, TSI and EMA (WHEATUSD) PullbacksSo far, I’ve focused on how to get into the market based on the DMI swap in dominance between the +DI and -DI. Once you’re in or if you missed the original entry, how can you get into a trend while minimizing your risk. As I’ve noted before, I’ve not been able to successfully trade on a regular basis but my hope is to use everything I’m documenting here to change that.
In one of the links that I shared in my first article is a PDF that has some really good stuff on using the PDF to trade breakouts. In it, there is a section on how to trade pullbacks within a trend using a 20 period EMA. In my charts, I use a combination of the 13 and 26 period EMA to sort of do the same thing (I use a range between the two vs. just one EMA).
Full credit for the strategy is given in the PDF and the basics of it are outlined as follows:
1. The ADX must me moving up and above 20
2. Look for a price retracement to the 20 period EMA. It goes on to note that “usually the price retracement will be accompanied by a turndown in the ADX”
3. When price touches the 20 period EMA (in my case, when it enters the range or touches the 26 period EMA), “put a BUY STOP above the high of the previous bar”
4. Once filled, enter a protective stop at the newly formed swing low
5. If stopped out, re-enter the trade by placing a new BUY STOP at the original entry price
6. After a successful trade, the ADX must once again turn up above 20 before another retrace
The PDF walks through this strategy as outlined above along with providing some examples.
However, the examples are based on the same time frame as the original entry. I’d like to explore and propose that in a strong trend at the daily level, the 4 hour chart will provide a short term strategy. By applying the same concept to the 4 hour chart as outlined above then you may be able to find points that either provide opportunities to enter into an existing trend, or add to positions you may already have within the trend.
As the 4 hour chart begins to show weakness and a breakdown below the 26 EMA, it’s possible this is an indication that the daily chart will now cycle through the same steps as noted above which would provide an opportunity take profit on existing positions while waiting for the next setup to enter with the trend on the daily chart.
I’ve hi-lited areas on the 4 hour chart for WHEATUSD that fit into this strategy with the current up trend on the daily chart that started recently. Note, that the last area in yellow appears to be breaking down below the 26 EMA signaling that the daily chart may begin to cycle through it's own pullback.

Trading the DMI with ADX, TSI and EMA (BTCUSD)Continuing with using the ADX/DMI on a daily chart to trigger a trade with the 4 hour chart to refine the entry, I’ve marked up the recent BTCUSD action similar to the wheat chart in previous article. As you can see from the daily chart, price dropped on the 4th causing the DI’s to swap dominance on the DMI. With the ADX still above 25, this could be viewed as a good signal that a real change is occurring.
On the 4hr chart, I’ve boxed out the day for the candle that caused the change and placed some entry targets for a possible retrace to enter.
Again, as I noted at the end of the last article, the Wilder strategy would call for the sell to be placed at or below the extreme of the day of the change. However, this does open up the trade to more risk. By tracking the day and subsequent action on the 4 hr chart, it’s possible to reduce the risk by placing a stop order in the 25-75% range with a stop just above the high of the day.
In this case, it would have worked however, there are cases which I’ll review next where the trade would have been missed.


Trading the DMI with ADX, TSI and EMA (WHEATUSD) cont.Setting up a trade based on daily signal using 4 hour chart for timing.
In this scenario, the daily chart had its ADX below 20 since July 3rd. When trading with DMI/ADX, periods of breakout after the ADX has been below 20 for at least 7-10 periods can provide good results. In this case, the 4 hour chart had dropped below 20 for an extended period too.
On July 17th , price moved up which caused the +DI to cross up over the -DI. Based on Wilder's strategy, you would place a buy stop above the high of the day (either the high or a number greater than it). With this strategy, you may consider the stop at a point below the low for the same day. In cases where the daily range is small, then placing orders in this way may not cause too much of a draw down. However, in case where the daily range is large, the risk is much higher though there are cases where it's just the way it works out (recent ngas activity that I'll use in an example in a future article). Alternatively, you could choose to place the stop at something like a 75% retrace of the daily candle when placing the buy stop at the high of the day.
Another option is to place your buy order as a limit order somewhere in the 25-75% pullback of the daily range that caused the DMI to swap .
On the 4hr chart, marks the day that daily DMI swapped dominance while shows the 25/50/75% breakdown of this price range.
While this strategy can reduce the risk of having a larger draw down, it also introduces the risk of missing a trade. I'll review more examples of both of these scenarios in next article.

Trading the DMI with ADX, TSI and EMA (WHEATUSD)In my first article, I provided a summary of the tools I’m using plus links to some good material that gives more in-depth details of each. As I go through each concept, I’ll refer to the 3 time frames that I will use in determining a trade.
• Weekly: to get the overall bias of the market
• Daily: to identify a day to take a trade or to setup a trade
• 4 hour: to identify the timing or refine the timing of the trade
My goal is to trade a small set of markets across various types which will include E-Mini contracts of Wheat and Corn and E-Micro contracts of Euro, Aussie$, and Gold. I’ve tried to trade crude oil (wti) options with mixed success but won’t actually outline trades but use it in the examples. For the E-Mini’s, I’ll limit my initial entry to 1 contract while the for the E-Micro’s (except Gold), I’ll up limit to 2 contracts. My main goal now is to make more money than I lose to remain in market so that I can continue my education in trading.
In this article, I’ll review one of the primary aspects of the DMI as outlined by Wilder and that is the equilibrium point of a market. In his book, on page 45, he states that “Good directional movement is not simply straight up or straight down movement. It is also good up and down movement in excess of the equilibrium point. This, in effect, is what the ADX measures. The equilibrium point is reached when the +DI equals -DI.” More detail can be found in his book and various online articles.
In the example of WHEATUSD (I trade e-mini wheat but use WHEATUSD for analysis as I can get near real-time data feed on TV without additional cost), I’ve noted 3 times since April of this year that the market has been at an equilibrium point on the daily chart (A, B, and C picked to mark the spot but not to imply any type of wave stuff). In the first 2 cases, the ADX was above 20 while in the 3rd, the ADX was below 20 at the time of the cross.
General speaking, when the ADX is declining and is at 25, it is best to be cautious when the DI’s cross. However, when the ADX drops below 20, it’s best not to trade but to wait for some type of pattern to evolve and trade the breakout. I’ll go through examples of this in future articles.
For now, I’ll focus on the 3 times where the market reached equilibrium. In his book. Wilder notes that the day this happens, it is an important date to note (on the daily chart but translates into the period of chart you’re using) as it can prove to be significant in the future too. On page 47 of his book, he reviews a key concept in his systems called the Extreme Point Rule and this is either the high or low made on the day. Depending on if you’re long, you would use the low as the stop and if you were short, you’d use the high as the stop. If not in the market, you could use this point to enter the market by placing a ‘stop’ order at this point.
In reviewing these three lines, from a hindsight perspective, it’s obvious now that the markets moved in the direction you wanted but in case ‘B’ only after a considerable drawdown. And, in ‘A’ and ‘B’, potentially the same depending on your appetite for drawdowns. There are cases where the market does continue quickly in the direction of the cross but there are also times that it doesn’t immediately. This is the area I’m studying now trying to discover what conditions lead to one vs. the other. Looking at these three cases, another strategy to think about is that of placing the order at a 25-50% pullback level into the candle that caused the market equilibrium with a stop just below/above the extreme of the same day.
In my next article, I’ll focus in on the markets noted above and review the daily charts YTD to see how this strategy would have played out.
