ADX

Interesting ADX pattern to watch forDuring the past several weeks, I've noticed something evolve in crude oil on the daily ADX called a 'change in dominance'. This is where the ADX is above 20 and the +/-DMI swap dominance resulting is a 'V' type ending to a trend. The setup for the pattern was an ADX reading below 20 resulting in a consolidation in price. Then, price broke out and ADX began to move up. Then, without much of a pullback, price reversed and the -DMI crossed up over the +DMI causing the change in dominance. During this time, price was pulling back but the +DMI was still up so waiting for the two DMI's to cross would have resulted in missed trade.
Looking out across other markets now, I see a similar setup in Soybean Oil (which I'm trading on short side). If this is a similar pattern, then two of the three steps have completed and this week should see price move down.
DXY is another market that could be setting up the same pattern. It will be interesting this week to see how this plays out. Should it work, it could be an interesting pattern to tuck away for future reference
British Pound may be another candidate for this pattern.

USOIL - 1D - patternthis is what I see on TVC:USOIL chart :
- trend line forming in the middle of parallel channel
price crossing it could create hesitation.
- RSI had similiar pattern but already brake out
- ADX makes a lower high. This could indicate a sideway movement.
should wait for new trend to take place

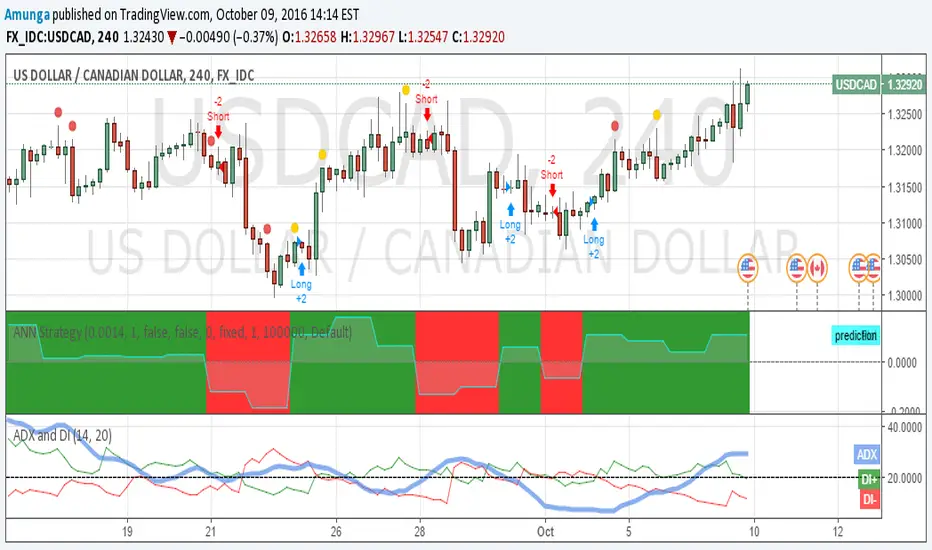
ADX showing decreasing trendUSDCAD is currently in an uptrend. The ADX shows a decrease in the strength of the trend. This shows there is soon to be a a downtrend
EURUSD Can continue Bearish Move?I can see Momentum cross down the OBV and D- cross above the D+. Dont you think we are looking into continues bearish move of EURUSD?

Strong Short, Tronox Ltd.Very good short play on Tronox Ltd. This stock has broken its upwards trend posting a lower high after 4 higher highs in a row and it is at the top of the linear regression channel. TROX has bounced off of a resistance line and is experiencing decrease in volume. The MACD is also about to crossover to a sell signal and the Directional Movement Index is showing a downwards trend. Also, the stock is in oversold territory showing at 65 and is about to cross under the 9 Day MA.

JCP Bullish TriangleBullish triangle on the JCP chart, watch for a breakout if the price clearly passes and closes above resistance. Chart also has clear indicators of a stong trend with the DMI showing an uptrend and the Aroon showing new uptrend. Would like to see an increase on the OBV along with the others for clarification of a strong trend though.

Civeo Broken SupportCiveo has broken support, MACD shows a sell signal, DMI shows downtrend. Short until DMI shows slowdown of trend.

NeoPhotonics Corp Strong UptrendLong until DMI shows slowdown of trend, reasons for uptrend shown on chart.

Resistance Broken & UptrendResistance at $10.38 broken and turned into support, long until DMI shows end of trend.

Resistance Broken & Stong UptrendResistance has been broken and a strong uptrend is occuring. Watching the DMI to see when the trend slows down, long until then.

Resistance Broken & TrendingA very stong resistance has been broken and the ADX/DMI is indicating a very stong uptrend has started.

Erickson Inc SwingErickson Inc set up for a swing trade. Reasons shown on the chart, but several other reasons are also the RSI is gaining strength, CCI has moved up over 0, and MACD is showing a buy signal.

EnteroMedics Swing TradeETRM looking like a solid swing trade, Reasons shown on the chart along with a second chart with other reasons linked to this idea.


STRONG BULL TREND FOR GBPThis day and yesterday Brits showed great economic results and ADX shows strong bearish trend on dialy chart...

Bearish Head and Shoulders forming on SPYA combination of lukewarm earnings for Q1 and talks of an impending Federal Reserve interest rate hike seem to be slowing down the bullish recovery we've seen in the S&P the past several weeks.
On the technical side, notice the failure to attain a new high. In fact SPY has consistently been unable to break new highs going back to May 2015, when the bear market truly began. Further, note the bearish head and shoulders pattern forming, Heikin Ashi candles with longer wicks to the downside, and somewhat strong resistance from above via the Ichi Moku Cloud.
Recommendations for a short trade: wait for the price to decisively break the neckline with a strong bar. The next fibonacci level serves as a decent profit target at about $200. Note that there is a relative vacuum between the hypothesized entry point and this value, aside from one level of support indicated by the dashed red line. For a stop loss, consider the apex of the right shoulder.

Bullish ADX at HORMEL FOODSHere we have a nice bullish ADX crossing signal at HORMEL FOODS Inc. with a risk reward ration of 2.5

SPDR ADX ShortThere is a nice short ADX crossing here. The most recent low of the uptrend at $21.91 was broken. So this makes the crossing very compelling for me.
Target for this trade is about $19.50 and the stop at $22.51 which gives a nice risk reward ratio of 2.5.
Let's see how the market plays this.

Gold bouncing off 21 day EMAGold has found support on the daily 21 EMA. This combined with bullish medium and long term momentum and the ADX indicating a weakening bear trend leads to a bullish overall outlook.

BTC/USD Major Trend StartingCurrent indication is that the new major trend is up. My suspicion is a lot of people are seeing the very long term dashed blue trendline as a significant support line. This looks reasonable to me as well as it has much more significance than the newly dashed red trendline, which has been breached on Bitstamp.
The ADX is also at a historic low point, which normally signals a large trend forming. It has already turned up signaling the trend is up (and fits with the monthly uptrend continuing), but obviously this can change at any time. Whatever the final direction that occurs, we can rest assured it's likely to be a rather large move.
My suggestion is to act on whatever trading signals you get this month as they are likely to be quite profitable. Also try not to become married to your position as this could be a fakeout for a large downtrend (it should be very clear if this reverses).
Good luck everyone, hopefully we can say good riddance to this range.

Bearish ADX This is a nice opportunity for a short trade based on the ADX crossing. Target for this trade is the support area around $ 1.52 and the stop is at the high of the previous bar at $ 5.81.
It got a very good risk/reward ratio of 2.5.
