VIDT - UpdateVIDT is approaching the edge of its current trading channel. Caution is warranted, as a pullback to the first support level at $0.0009 remains a possibility. The next support level is less encouraging and would signal further weakness.
VIDT has struggled post-delisting, unlike projects such as ALPACA, VOXEL, and ARGO, which experienced a resurgence. At this point, VIDT is showing little sign of recovery and may even be considered a dormant or "dead" coin. ATM it is very indecisive.
That said, if buying interest returns, a move toward the $0.003–$0.006 range is feasible — a modest recovery that would place the market cap between $3M and $6M, still far below the FWB:30M cap it held before the major sell-off.
Aergo

AERGO Structure Has Turned Bullish (1W)After 1428 days, AERGO has powerfully reclaimed a major zone. In addition to reclaiming this area with strength, it has swept the liquidity pool, meaning there are no more liquidity magnets left below the chart.
It has also completed its core CH (Change of Character) and cleared an important zone.
Considering the time range it has spent in correction, we have identified the targets on the chart.
We are looking for a buy around the green zone.
A weekly candle closing below the invalidation level will invalidate this analysis.
For risk management, please don't forget stop loss and capital management
When we reach the first target, save some profit and then change the stop to entry
Comment if you have any questions
Thank You

AERGO/USDT Analysis – 2 Strong Buying Zones
For this futures pair, we are approaching zones where abnormal buyer aggression was previously recorded.
If we test the $0.23–$0.205 or $0.185–$0.153 zones and see a reaction from buyers, we could see a strong upward move, potentially reaching at least the $0.30 level.

AERGO Crashes 61% After Binance Futures Listing Aergo (AERGO) saw a dramatic price crash on April 16, falling by 61.32% within 24 hours to $0.1590, despite high trading activity. The sharp drop followed Binance’s launch of the AERGOUSDT Perpetual Futures Contract, which allows trading with up to 15x leverage. The contract went live at 11:00 UTC.
Before this event, Aergo had reached a recent all-time high close to $0.76, marking strong bullish momentum. However, the futures launch triggered heightened volatility, leading to a swift decline in market price shortly after trading opened.
Currently, Aergo’s market capitalization stands at $75.95 million, while its fully diluted valuation (FDV) is $79.61 million. The 24-hour trading volume has skyrocketed to $1.56 billion, reflecting a 204.66% increase, with a volume-to-market cap ratio of 2060.24% — signaling extremely high turnover. The token’s circulating supply is 477.49 million AERGO, with a total and max supply capped at 500 million AERGO. Holders of the asset currently number 7.65K.
Aergo is a hybrid enterprise blockchain platform built by Blocko, a Samsung-backed South Korean firm. The platform enables SQL-compatible smart contracts and supports both public and private blockchain systems. It has seen adoption by major institutions such as Hyundai Motors and the Korea Exchange.
Following its high, near $0.76, Aergo's price broke down sharply. It currently hovers around $0.1596. With the RSI close to oversold territory, traders may look for stabilization before any potential bounce.

AERGO: Golden Pocket Hit – Crash Incoming?On April 3rd, AERGO hit a historic low of $0.04746—and just 13 days later, it's trading around $0.60, an astonishing +1500% surge in less than two weeks. The rapid rise begs the question: What are the bulls aiming for next, and how sustainable is this move?
Key Observations:
Explosive Rally:
AERGO’s meteoric move from $0.04746 to $0.70 in just 13 days has propelled the coin into uncharted territory. Such a dramatic spike is not only eye-catching but also raises concerns about overextension.
RSI Overbought:
The daily RSI sits at 98, indicating extreme overbought conditions. This level suggests that the current rally is unsustainable and may be ripe for a pullback.
Historical Resistance Levels:
Looking back at 2021, key highs were established around $0.60 to $0.62. These levels serve as critical resistance zones.
Fibonacci Confluence:
Taking the Fibonacci retracement from the low at $0.04746 to the previous rally's high at $1.0809 (April 13, 2024), the 0.618 level is projected at $0.68613. The bulls just tested that golden pocket.
Trade Strategy & Potential Setups:
For Longs:
With the market showing signs of being overbought (RSI at 98) and the explosive move possibly winding down, this may be the perfect opportunity to take profits rather than accumulate further.
Take Profit Consideration:
Target: Near the 0.618 fib retracement at $0.68613.
Observation: If bulls push beyond this level, the move might extend — however, the risk of a sharp pullback is high given current overbought conditions.
For Shorts:
A corrective move is very much on the table, and traders looking to short should focus on the key resistance zone between $0.60 and $0.70.
Short Setup:
Entry: Look to initiate shorts near the $0.60–$0.70 zone.
Target: $0.4 and $0.2 as take profit targets
The Big Question:
Will AERGO drop as sharply as it surged? Given the extreme overbought conditions and the rapid, unsustainable spike, a healthy—and perhaps brutal—correction seems very possible. Keep a close eye on volume and price action near the $0.60–$0.70 resistance zone and be ready to adjust positions accordingly.
Anyone riding this wave has experienced one of the wildest moves in recent memory. For those in long positions, consider taking profits now; for potential short traders, watch those key levels tightly. The market's rhythm will soon reveal its next chapter.

Breaking: Despite Binance Delisting $AERGO The Coin Spiked 730% The well known crypto exchange Binance has released on her X page that they would be delisting about 5 tokens of which $AERGO happens to be one of them claiming they don't follow industry standards, despite being listed on top CEX like Coinbase, Upbit, etc.
Binance delisted $AERGO late March, 2025, however, the event took a deja vu as $AERGO has been surging consecutively for over 2 weeks now breaking out of a falling wedge pattern, equating to 730% ROI so far so good despite the delisting campaign by Binance.
While the asset is up 14% as of the time of writing, $AERGO is currently overbought with the RSI of 75, we may experience a cool-off. Regardless, $AERGO is sitting on $194+ million market cap is feasible for a trend continuation.
What is Aergo?
Aergo describes itself as an open-source enterprise blockchain platform optimized for hybrid deployments, which consist of both permissioned and permissionless blockchain architectures. It includes support for SQL allowing for easy data handling and familiar smart contract programming for developers.
The platform is built and utilized by Blocko, the Samsung-backed South Korean blockchain technology company that, according to Korean media sources, has deployed production blockchain solutions for large-scale clients including Lotte Card, Shinhan Bank, Korea Exchange, Hyundai Motors, and more.
Aergo Price Metric
The live Aergo price today is $0.419087 USD with a 24-hour trading volume of $518,508,512 USD. The current CoinMarketCap ranking is #177, with a market cap of $200,113,830 USD. It has a circulating supply of 477,499,996 AERGO coins and a max. supply of 500,000,000 AERGO coins.

Breakout in Aergo (AERGOUSDC)...Chart is self explanatory. Levels of breakout, possible up-moves (where crypto may find resistances) and support (close below which, setup will be invalidated) are clearly defined.
Disclaimer: This is for demonstration and educational purpose only. This is not buying or selling recommendations. Please consult your financial advisor before taking any trade.

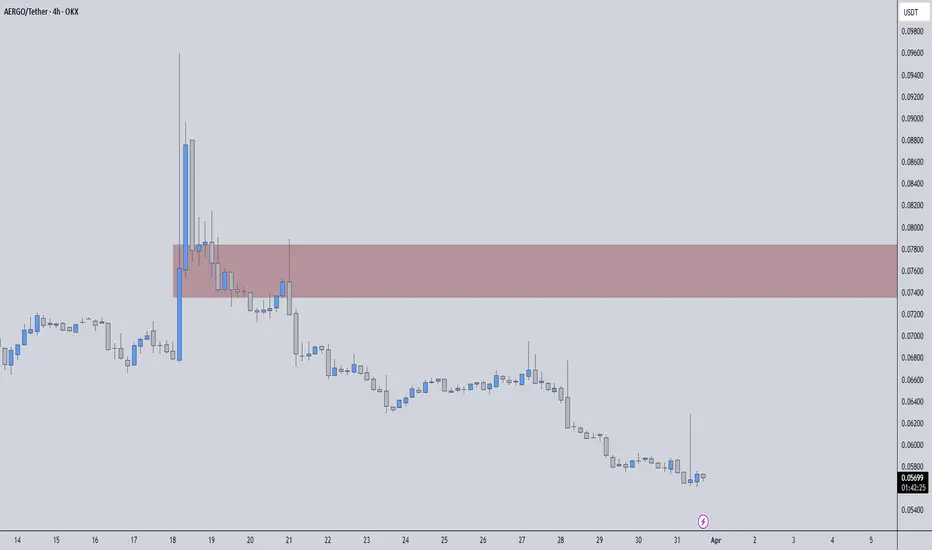
Aergo price analysis The #Aergo coin is “old” from 2019, and its capitalization is only 59 million, and that's after a few days of 200%+ pumping from Korean exchange users in a falling market.
🟡 At the current price, of course, it's not worth buying OKX:AERGOUSDT , but why not keep an eye on it.
🟢 If the price is kept above the buying zone - $0.075 - $0.087, then the pump can easily be extended, at least to $0.30 - $0.32 (potentially modest x4, or maybe not)
🔴 Below this zone, in our opinion, it is dangerous to buy, because there will be weakness of buyers and the price of #Aergo has a place to fall.
_____________________
Did you like our analysis? Leave a comment, like, and follow to get more

AERGOUSDT | Critical Resistance Zone AheadThe price is weak. Now, we are approaching the red box, a well-defined resistance zone where I will be watching closely for my usual short confirmations.
🔴 Key Observations:
✔️ Red Box = Strong Resistance – This level has historically been difficult to break, and I expect sellers to step in here.
✔️ No Need to Chase – If the price breaks upwards without giving a proper confirmation, I won’t force a short.
✔️ LTF Confirmations Are Everything – The smartest move is waiting for a breakdown with CDV alignment before taking action.
🔥 How to Approach This Trade:
🔹 If the price rejects the red box, I will evaluate shorts with confirmation.
🔹 If we break above with volume and retest, I might consider looking long.
🔹 As always, I stick to my rules, and that’s why my success rate speaks for itself.
Most traders get caught in emotional decisions, but I stay ahead because I focus on data, structure, and discipline. That’s why people follow me—because I deliver real results. Stay sharp and trade smart!
I keep my charts clean and simple because I believe clarity leads to better decisions.
My approach is built on years of experience and a solid track record. I don’t claim to know it all, but I’m confident in my ability to spot high-probability setups.
If you would like to learn how to use the heatmap, cumulative volume delta and volume footprint techniques that I use below to determine very accurate demand regions, you can send me a private message. I help anyone who wants it completely free of charge.
I have a long list of my proven technique below:
🎯 ZENUSDT.P: Patience & Profitability | %230 Reaction from the Sniper Entry
🐶 DOGEUSDT.P: Next Move
🎨 RENDERUSDT.P: Opportunity of the Month
💎 ETHUSDT.P: Where to Retrace
🟢 BNBUSDT.P: Potential Surge
📊 BTC Dominance: Reaction Zone
🌊 WAVESUSDT.P: Demand Zone Potential
🟣 UNIUSDT.P: Long-Term Trade
🔵 XRPUSDT.P: Entry Zones
🔗 LINKUSDT.P: Follow The River
📈 BTCUSDT.P: Two Key Demand Zones
🟩 POLUSDT: Bullish Momentum
🌟 PENDLEUSDT.P: Where Opportunity Meets Precision
🔥 BTCUSDT.P: Liquidation of Highly Leveraged Longs
🌊 SOLUSDT.P: SOL's Dip - Your Opportunity
🐸 1000PEPEUSDT.P: Prime Bounce Zone Unlocked
🚀 ETHUSDT.P: Set to Explode - Don't Miss This Game Changer
🤖 IQUSDT: Smart Plan
⚡️ PONDUSDT: A Trade Not Taken Is Better Than a Losing One
💼 STMXUSDT: 2 Buying Areas
🐢 TURBOUSDT: Buy Zones and Buyer Presence
🌍 ICPUSDT.P: Massive Upside Potential | Check the Trade Update For Seeing Results
🟠 IDEXUSDT: Spot Buy Area | %26 Profit if You Trade with MSB
📌 USUALUSDT: Buyers Are Active + %70 Profit in Total
🌟 FORTHUSDT: Sniper Entry +%26 Reaction
🐳 QKCUSDT: Sniper Entry +%57 Reaction
📊 BTC.D: Retest of Key Area Highly Likely
I stopped adding to the list because it's kinda tiring to add 5-10 charts in every move but you can check my profile and see that it goes on..
A tiny part of my runners;
🌊 WAVESUSDT.P: Demand Zone Potential
🟣 UNIUSDT.P: Long-Term Trade
🔵 XRPUSDT.P: Entry Zones
🔗 LINKUSDT.P: Follow The River
📈 BTCUSDT.P: Two Key Demand Zones
A tiny part of my runners;
💼 STMXUSDT: 2 Buying Areas
🐢 TURBOUSDT: Buy Zones and Buyer Presence
🌍 ICPUSDT.P: Massive Upside Potential | Check the Trade Update For Seeing Results
🟠 IDEXUSDT: Spot Buy Area | %26 Profit if You Trade with MSB
📌 USUALUSDT: Buyers Are Active + %70 Profit in Total
🌟 FORTHUSDT: Sniper Entry +%26 Reaction
🐳 QKCUSDT: Sniper Entry +%57 Reaction
j
📌I keep my charts clean and simple because I believe clarity leads to better decisions.
📌My approach is built on years of experience and a solid track record. I don’t claim to know it all but I’m confident in my ability to spot high-probability setups.
📌If you would like to learn how to use the heatmap, cumulative volume delta and volume footprint techniques that I use below to determine very accurate demand regions, you can send me a private message. I help anyone who wants it completely free of charge.
🔑I have a long list of my proven technique below:
🎯 ZENUSDT.P: Patience & Profitability | %230 Reaction from the Sniper Entry
🐶 DOGEUSDT.P: Next Move
🎨 RENDERUSDT.P: Opportunity of the Month
💎 ETHUSDT.P: Where to Retrace
🟢 BNBUSDT.P: Potential Surge
📊 BTC Dominance: Reaction Zone
🌊 WAVESUSDT.P: Demand Zone Potential
🟣 UNIUSDT.P: Long-Term Trade
🔵 XRPUSDT.P: Entry Zones
🔗 LINKUSDT.P: Follow The River
📈 BTCUSDT.P: Two Key Demand Zones
🟩 POLUSDT: Bullish Momentum
🌟 PENDLEUSDT.P: Where Opportunity Meets Precision
🔥 BTCUSDT.P: Liquidation of Highly Leveraged Longs
🌊 SOLUSDT.P: SOL's Dip - Your Opportunity
🐸 1000PEPEUSDT.P: Prime Bounce Zone Unlocked
🚀 ETHUSDT.P: Set to Explode - Don't Miss This Game Changer
🤖 IQUSDT: Smart Plan
⚡️ PONDUSDT: A Trade Not Taken Is Better Than a Losing One
💼 STMXUSDT: 2 Buying Areas
🐢 TURBOUSDT: Buy Zones and Buyer Presence
🌍 ICPUSDT.P: Massive Upside Potential | Check the Trade Update For Seeing Results
🟠 IDEXUSDT: Spot Buy Area | %26 Profit if You Trade with MSB
📌 USUALUSDT: Buyers Are Active + %70 Profit in Total
🌟 FORTHUSDT: Sniper Entry +%26 Reaction
🐳 QKCUSDT: Sniper Entry +%57 Reaction
📊 BTC.D: Retest of Key Area Highly Likely
📊 XNOUSDT %80 Reaction with a Simple Blue Box!
📊 BELUSDT Amazing %120 Reaction!
I stopped adding to the list because it's kinda tiring to add 5-10 charts in every move but you can check my profile and see that it goes on..
AERGOUSDT Analysis: Only the Best Trades, Believe MeListen, folks, sometimes a trade not taken is better than a losing one . Believe me, I know winners, and this blue box? It’s a fantastic demand zone , one of the best out there. Smart traders wait for the right moment—patience is key.
Here’s the Deal:
Smart Moves Only: Don’t be hasty, don’t lose. Focus on great setups.
The Blue Box: It’s incredible, carefully chosen, and full of potential.
Top-Tier Confirmations: I use CDV, liquidity heatmaps, volume profiles, and volume footprints. The best tools, the greatest techniques, all to make sure it’s the right trade.
Learn From the Best: If you want to dominate like a pro, I can teach you how to use CDV, liquidity heatmaps, volume profiles, and volume footprints . Just DM me. You’ll be learning from the best, believe me.
Remember: Great trades come from great levels. No rushing, no losing—only winning.
If this analysis helps you, boost it, comment, share it with everyone you know. Let’s make trading great again. Success is waiting, folks!
Let me tell you, folks, this is amazing. Nobody does analysis like I do. Believe me. If this helps you, don't forget to boost and comment! It’s a big deal, motivates me to share even more winning insights with you. Tremendous insights.
I keep my charts the best—clean, simple, and clear. You know it, I know it, clarity leads to better decisions. No question about it. My approach? Built on years of tremendous experience. Incredible track record. I don’t claim to know it all, but I spot high-probability setups like nobody else. Trust me.
Want to learn how to use the heatmap, cumulative volume delta, and volume footprint techniques I use to determine demand regions with stunning accuracy? Send me a private message—totally free, folks. That’s right. I help anyone who wants it, absolutely no charge. Unbelievable value.
Here’s the list—long list, great list—of some of my previous incredible analyses. Each one, a winner:
🎯 ZENUSDT.P: Patience & Profitability | %230 Reaction from the Sniper Entry
🐶 DOGEUSDT.P: Next Move
🎨 RENDERUSDT.P: Opportunity of the Month
💎 ETHUSDT.P: Where to Retrace
🟢 BNBUSDT.P: Potential Surge
📊 BTC Dominance: Reaction Zone
🌊 WAVESUSDT.P: Demand Zone Potential
🟣 UNIUSDT.P: Long-Term Trade
🔵 XRPUSDT.P: Entry Zones
🔗 LINKUSDT.P: Follow The River
📈 BTCUSDT.P: Two Key Demand Zones
🟩 POLUSDT: Bullish Momentum
🌟 PENDLEUSDT.P: Where Opportunity Meets Precision
🔥 BTCUSDT.P: Liquidation of Highly Leveraged Longs
🌊 SOLUSDT.P: SOL's Dip - Your Opportunity
🐸 1000PEPEUSDT.P: Prime Bounce Zone Unlocked
🚀 ETHUSDT.P: Set to Explode - Don't Miss This Game Changer
🤖 IQUSDT: Smart Plan
⚡️ PONDUSDT: A Trade Not Taken Is Better Than a Losing One
💼 STMXUSDT: 2 Buying Areas
🐢 TURBOUSDT: Buy Zones and Buyer Presence
🌍 ICPUSDT.P: Massive Upside Potential | Check the Trade Update For Seeing Results
🟠 IDEXUSDT: Spot Buy Area | %26 Profit if You Trade with MSB
📌 USUALUSDT: Buyers Are Active + %70 Profit in Total
🌟 FORTHUSDT: Sniper Entry +%26 Reaction
🐳 QKCUSDT: Sniper Entry +%57 Reaction
📊 BTC.D: Retest of Key Area Highly Likely
And that’s just the start. The list goes on and on, folks. It’s a tremendous list, the best. I stopped adding because, frankly, it’s tiring. So many wins. People are amazed. You can check my profile and see for yourself—winning moves, all the time. Believe me, nobody does it better.

#AERGO (SPOT) entry range (0.0800- 0.0920) T.(0.1799) SL(0.0755)BINANCE:AERGOUSDT
entry range (0.0800- 0.0920)
Target1 (0.1399)- Target2 (0.1799)
SL .1D close below (0.0755)
*** Collect slowly in the entry range ****
**** #Manta ,#OMNI, #DYM, #AI, #IO, #XAI , #ACE #NFP #RAD #WLD #ORDI #BLUR #SUI #Voxel #AEVO #VITE #APE #RDNT #FLUX #NMR #VANRY #TRB #HBAR #DGB #XEC #ERN #ALT #IO #ACA #HIVE #ASTR #ARDR #PIXEL #LTO #AERGO ****

AERGO LOOKS BULLISHYou should also note that this symbol is low-volume and highly volatile.
Before anything, pay attention to the time frame, the time frame is big and time consuming.
It seems that the B wave diametric is ending and the price is now in the G wave which is the last wave of this diametric.
It can go up while maintaining the green range.
Closing a weekly candle below the invalidation level will violate the analysis.
For risk management, please don't forget stop loss and capital management
When we reach the first target, save some profit and then change the stop to entry
Comment if you have any questions
Thank You

AERGO/USDT About to Produce a Bullish Wave? 👀🚀AERGO Analysis💎AERGOUSDT is currently showcasing dynamic market movements, poised on the cusp of breaking free from its descending channel pattern.
💎At the moment, #Aergo is undergoing sideways consolidation within a demand zone, which used to be a supply area. There's a significant chance for the price to rebound from this zone and initiate an upward trajectory, aiming for the bearish OB area as its forthcoming milestone.
💎If AERGO does not manage to rebound and instead dips below the demand zone, it might withdraw to the Bullish OB area, situated around the $0.122 mark, in search of fresh impetus for an ascent.
💎The Bullish OB area has historically been a catalyst for notable recoveries upon its examination. Yet, a failure of this zone, substantiating a bearish trend, could lead AERGO to seek bullish signals from an even lower stance.
💎In the event AERGO doesn't leverage upward momentum from this subsequent level, it would likely sustain its descent. Rest assured, we're here to assist you in navigating through these market shifts.

aergo long hello Traders, here is the full analysis for this pair, let me know in the comment section below if you have any questions, the entry will be taken only if all rules of the strategies will be satisfied. I suggest you keep this pair on your watchlist and see if the rules of your strategy are satisfied. Please also refer to the Important Risk Notice linked below.

AERGO/BTC - Aergo: Resistance Breakout◳◱ On the $AERGO/ CRYPTOCAP:BTC chart, the Resistance Breakout pattern suggests a consolidation phase that could precede a trend continuation or reversal. Traders might observe resistance around 0.00000368 | 0.00000386 | 0.0000042 and support near 0.00000334 | 0.00000318 | 0.00000284. Entering trades at 0.00000352 could be strategic, aiming for the next resistance level.
◰◲ General info :
▣ Name: Aergo
▣ Rank: 459
▣ Exchanges: Binance, Kucoin, Hitbtc
▣ Category/Sector: Infrastructure - Enterprise and BaaS
▣ Overview: None
◰◲ Technical Metrics :
▣ Mrkt Price: 0.00000352 ₿
▣ 24HVol: 1.081 ₿
▣ 24H Chng: 0.571%
▣ 7-Days Chng: 2.64%
▣ 1-Month Chng: -14.75%
▣ 3-Months Chng: 52.77%
◲◰ Pivot Points - Levels :
◥ Resistance: 0.00000368 | 0.00000386 | 0.0000042
◢ Support: 0.00000334 | 0.00000318 | 0.00000284
◱◳ Indicators recommendation :
▣ Oscillators: SELL
▣ Moving Averages: BUY
◰◲ Technical Indicators Summary : NEUTRAL
◲◰ Sharpe Ratios :
▣ Last 30D: -1.61
▣ Last 90D: 2.29
▣ Last 1-Y: 1.09
▣ Last 3-Y: 0.91
◲◰ Volatility :
▣ Last 30D: 0.58
▣ Last 90D: 1.19
▣ Last 1-Y: 0.84
▣ Last 3-Y: 1.33
◳◰ Market Sentiment Index :
▣ News sentiment score is N/A
▣ Twitter sentiment score is 0.52 - Bullish
▣ Reddit sentiment score is 0.58 - Bullish
▣ In-depth AERGOBTC technical analysis on Tradingview TA page
▣ What do you think of this analysis? Share your insights and let's discuss in the comments below. Your like, follow and support would be greatly appreciated!
◲ Disclaimer
Please note that the information and publications provided are for informational purposes only and should not be construed as financial, investment, trading, or any other type of advice or recommendation. We encourage you to conduct your own research and consult with a qualified professional before making any financial decisions. The use of the information provided is solely at your own risk.
▣ Welcome to the home of charting big: TradingView
Benefit from a ton of financial analysis features, instruments and data. Have a look around, and if you do choose to go with an upgraded plan, you'll get up to $30.
Discover it here - affiliate link -

Trade signal | Aergo completed setup for upto 22.50% pumpHi dear friends, hope you are well and welcome to the new trade setup of Aergo token.
Previously we caught almost 87% pump of AERGO as below:
Now on a 4-hr time frame, AERGO with BTC pair has formed a bullish Gartley move for the next pump.
Note: Above idea is for educational purpose only. It is advised to diversify and strictly follow the stop loss, and don't get stuck with trade.

AERGO/USDT - Aergo: Trend Reversal◳◱ On the $AERGO/ CRYPTOCAP:USDT chart, the Trend Reversal pattern suggests indications that the trend may be gaining or losing strength. Traders might observe resistance around 0.152 | 0.162 | 0.1851 and support near 0.1289 | 0.1158 | 0.0927. Entering trades at 0.1626 could be strategic, aiming for the next resistance level.
◰◲ General info :
▣ Name: Aergo
▣ Rank: 353
▣ Exchanges: Binance, Kucoin, Bybit, Gateio, Mexc
▣ Category/Sector: Infrastructure - Enterprise and BaaS
▣ Overview: None
◰◲ Technical Metrics :
▣ Mrkt Price: 0.1626 ₮
▣ 24HVol: 9,077,508.508 ₮
▣ 24H Chng: -10.463%
▣ 7-Days Chng: 13.45%
▣ 1-Month Chng: 49.36%
▣ 3-Months Chng: 77.29%
◲◰ Pivot Points - Levels :
◥ Resistance: 0.152 | 0.162 | 0.1851
◢ Support: 0.1289 | 0.1158 | 0.0927
◱◳ Indicators recommendation :
▣ Oscillators: NEUTRAL
▣ Moving Averages: SELL
◰◲ Technical Indicators Summary : NEUTRAL
◲◰ Sharpe Ratios :
▣ Last 30D: 3.55
▣ Last 90D: 3.23
▣ Last 1-Y: 1.17
▣ Last 3-Y: 0.85
◲◰ Volatility :
▣ Last 30D: 1.79
▣ Last 90D: 1.12
▣ Last 1-Y: 0.83
▣ Last 3-Y: 1.33
◳◰ Market Sentiment Index :
▣ News sentiment score is N/A
▣ Twitter sentiment score is 0.52 - Bullish
▣ Reddit sentiment score is 0.58 - Bullish
▣ In-depth AERGOUSDT technical analysis on Tradingview TA page
▣ What do you think of this analysis? Share your insights and let's discuss in the comments below. Your like, follow and support would be greatly appreciated!
◲ Disclaimer
Please note that the information and publications provided are for informational purposes only and should not be construed as financial, investment, trading, or any other type of advice or recommendation. We encourage you to conduct your own research and consult with a qualified professional before making any financial decisions. The use of the information provided is solely at your own risk.
▣ Welcome to the home of charting big: TradingView
Benefit from a ton of financial analysis features, instruments and data. Have a look around, and if you do choose to go with an upgraded plan, you'll get up to $30.
Discover it here - affiliate link -

The key is whether it can rise above 0.1115Hello?
Hello traders!
If you "Follow" us, you can always get new information quickly.
Please also click “Boost”.
Have a good day.
-------------------------------------
(AERGOUSDT chart)
The key is whether it can rise above 0.1115.
(1D chart)
To do so, we need to see if the price can be maintained by rising above 0.1081.
If not, and it falls,
1st: 0.0951-0.0966
2nd: 0.0875-0.0914
You need to check if you receive support around the 1st and 2nd levels above.
-------------------------------------------------- -------------------------------------------
** All explanations are for reference only and do not guarantee profit or loss in investment.
** Trading volume is displayed as a candle body based on 10EMA.
How to display (in order from darkest to darkest)
More than 3 times the trading volume of 10EMA > 2.5 times > 2.0 times > 1.25 times > Trading volume below 10EMA
** Even if you know other people’s know-how, it takes a considerable amount of time to make it your own.
** This chart was created using my know-how.
---------------------------------

The key is whether it can rise above 0.1115Hello?
Hello traders!
If you "Follow" us, you can always get new information quickly.
Please also click “Boost”.
Have a good day.
-------------------------------------
(AERGOUSDT chart)
Caution is required as support and resistance may be weak as the chart has just been created.
Currently, the key is whether it can rise above 0.1115, which is the volume profile section of the 1W chart.
To do so, the key is whether the price can be maintained above 0.0951 and rise.
-------------------------------------------------- -------------------------------------------
** All explanations are for reference only and do not guarantee profit or loss in investment.
** Trading volume is displayed as a candle body based on 10EMA.
How to display (in order from darkest to darkest)
More than 3 times the trading volume of 10EMA > 2.5 times > 2.0 times > 1.25 times > Trading volume below 10EMA
** Even if you know other people’s know-how, it takes a considerable amount of time to make it your own.
** This chart was created using my know-how.
---------------------------------

Keep an eye on $AERGO/BUSDTarget mentioned 4x, Keep hold for long term
Noted: Not a financial advisor.
It's always recommended to carefully consider all the factors and conduct thorough research before making any investment decisions. I suggest seeking advice from a licensed financial advisor.

Aergo token forming bullish Shark for upto 28% moveHi dear friends, hope you are well and welcome to the new trade setup of Aergo token with US Dollar pair.
Previously we caught more than 52% pump of AERGO as below:
Now on a 4-hr time frame, AERGO is about to complete a bullish Shark move for another price reversal.
Note: Above idea is for educational purpose only. It is advised to diversify and strictly follow the stop loss, and don't get stuck with trade

AERGO/BTC - 1W - Fib & S/R Aergo is something you want to accumalate with strong FA. From 2021 til now it has been in a range with large impulses throughout the period, Despite the bearish period it has managed to retain its value in comparion to many other cryptos in the bear market. The FA is strong with this on though, if like the future of South Korea then they are in line with the success of Aergo. Samsung Electronics backs Blocko, the company behind Aergo, while the project focuses on cloud computing and dapps. Aergo provides large-scale business clients with blockchain solutions such as corporate apps and closed private blockchain networks and some of its key clients are Hyundai Motors and Korea Exchange.

AERGO Rising WedgeGot news for you: AERGO's not the only token trending in a RW pattern. There are many others. Upper shadows are long and deep above microtrend resistance, volume is relatively low on the upthrusts. Blood is on the forecast, but perhaps not before another bull trap rally. Don't get fooled by the FOMO. Stay safe!
Be sure to subscribe for more clean, accurate, easy-to-follow swing charts with exceptionally high win ratios (80-85% average). I'm a fulltime crypto trader/investor and I handpick all the runners myself after conducting a series of volume-to-spread reads and Wyckoff schematic comparisons.
Not financial advice. Always DYOR & trade at your own risk.
