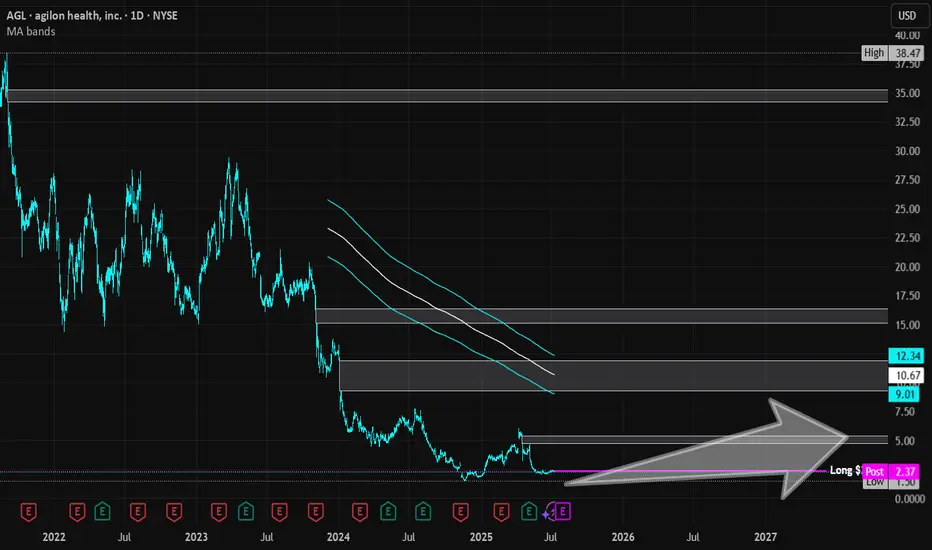
Agilon Health | AGL | Long at $2.36Reentering this trade (original: )
Agilon Health NYSE:AGL
Pros:
Revenue consistently grew from 2019 ($794 million) to 2024 ($6.06 billion). Expected to reach $9.16 billion by 2028.
Current debt-to-equity ratio 0.07 (very low)
Sufficient cash reserves to fund operations and strategic initiatives
Strong membership growth (659,000 in 2024, a 38% year-over-year increase)
Recent insider buying ($2 - $3) and awarding of options
Cons:
Rising medical costs - currently unprofitable and not forecast to become profitable over the next 3 years
Medicare Advantage Membership issues with the new political administration
No dividend
It's a gamble and I think it's a possibility this could drop near $1 in the near-term due to the Medicaid changes/fear... regardless, long-term, personal buy-zone at $2.36.
Targets in 2027
$3.70 (+56.8%)
$5.25 (+122.5%)
AGL
Bearish potential detected for AGLEntry conditions:
(i) breach of the lower confines of the Darvas box formation for ASX:AGL
- i.e.: below low of $9.84 of 7th April, and
(ii) swing increased bearishness of indicators such as DMI/RSI along with a test of prior level of support of $10.02 from 11th March.
Stop loss for the trade (based upon the Darvas box formation) would be:
(i) above the high of 10th April (i.e.: above $10.89), or
(ii) above the prior support level from the open of 10th January (i.e.: above $11.15), depending on risk tolerance.

AGL - Bowl chart with a Golden cross- AGL is in a long-term uptrend.
- AGL made a golden cross on 04.08.2025 (MA50 & MA200).
- The price chart is forming a bowl of patterns.
- Price now (05.01.2025): $3.93.
- Price target: $7.62.
If the bowl pattern fails, cut loss when the intraday price is below $3.66.
IMO, amateur trader.

AGL - Bull pending?Are there bulls lurking here ahead of potential rate cuts?
Our Bullfinder-official Team has identified a potential opportunity within ASX:AGL
If price can hold above the $10.00 mark, there may be potential for a re-rating of momentum to 'bullish'.
We would like to note however that below ~$10.00 significant bearish continuation risk comes into play.
We're inspired to bring you the latest developments across worldwide markets, helping you look in the right place, at the right time.
Thank you for reading! Stay tuned for further updates, and we look forward to being of service along your trading & investing journey...
Disclaimer: Please note all information contained within this post and all other Bullfinder-official Tradingview content is strictly for informational purposes only and is not intended to be investment advice. Please DYOR & Consult your licensed financial advisors before acting on any information contained within this post, or any other Bullfinder-official TV content.

Agilon Health | AGL | Long at $2.24Agilon Health NYSE:AGL
Pros:
Revenue consistently grew from 2019 ($794 million) to 2023 ($4.3 billion) and through three quarters of 2024 ($5.6 billion). Expected to reach $8.7 billion by 2027.
Current debt-to-equity ratio 0.06 (very low)
Sufficient cash reserves to fund operations and strategic initiatives
Strong membership growth (525,000 as of Q3 2024, a 37% year-over-year increase)
Recent insider buying ($2 - $3) and awarding of options
Cons:
Rising medical costs - currently unprofitable and not forecast to become profitable over the next 3 years
No dividend
Targets (into 2027):
$2.72
$4.00
$5.00
$7.00
$11.50
$16.00

ASX: AGL Fibonacci retracements
ASX:AGL AGL Energy is have been underperforming for long time , now for one year return is just 3.16%
Look the chart and notice
- double bottom formation on weekly chart
- higher high higher low formation
- no supply
- stock also above the key level of fib levels
disc: invested and tracking

AGL - Long TriggeredJSE:AGL broke out of a long term descending triangle and has triggered our long position with today's price action so far. We are looking at a target around the 664 area with our stop loss just below the bottom of the triangle at around 538.

Downward momentum on AGLAll three of our momentum indicators have crossed downwards on JSE:AGL . It is looking good for a short position. Target levels around the support area of late September 2021.

AGLAgilon Health Inc (NYSE:AGL) had another impressive trading session. I feel the stock looks poised to breakout in the coming sessions as attention appears to be returning to the stock via price gains and volume.

AGL Demerger or Bullet dodging?Good Day Ladies and Gentlemen,
This one goes out to the average retail trying to make sense of this crazy market. In no way is this chart supposed to fearmonger, however it is important to truly understand not only are you investing in a company when you buy shares you are also investing in the crew that runs it.
Its not hard to believe so many investors are wondering what the hell is going on with AGL and how the (incompetent) poorly run 20 year old giant could be put in such a position. Its as if the company has done everything wrong for the past 3 years.. which makes you wonder was it on purpose?
The executive board are pushing hard for a demerger, but why?
With large liquidity pools at 17-20 dollars (that will at some point need to be filled) as a result of price being heavily shorted taking over 70% of retail money (talk about greedy) its no wonder people are asking questions. What are the intentions of the demerger which have been seemly announced at almost to convenient of times. Are they burying the evidence?
Take a look at the chart and tell me what you think?

AGL - Trade PlanAGL looks like it has broken out of its long term downtrend and is expected to head higher. The break of the Bearish trendline coupled with High Volume and huge MACD Bullish Divergence confirms that it is expected to move higher. I am bullish AGL with a target of $10.70 and it may even go much higher towards the strong Resistance level of $12.00.
Please note these are my own notes, by no means trading advice. Please do your own research before entering into any trade.

JSE:AGL Pullback Gaining MomentumAs indicated previously - see post below - Anglo American is ready for a pullback and is now gaining momentum. Still looking for a test of R400 to determine what is next.

JSE:AGL Anglo American Time to Let it GoWe were looking at a markup in Anglo American - see post below - but with declining interest in the stock, divergence on the volume RSI and break of the 50 Day SMA I think this stock is ready for a pullback probably to R400.

AGL.ASX_Range Breakout Trade_ShortENTRY: 8.59
SL: 9.23
TP: 7.86
- ADX>20
- RSI<50, RSI>30
- Daily RS -ve
- Daily FFI -ve
- Daily MACD -ve
- Weekly RS -ve
- Weekly FFI -ve
- Weekly MACD -ve
- Breakout from range with good volume on 13 Apr 2021

AGL.ASX_Breakout Trade_ShortENTRY: 9.25
SL: 9.75
TP1: 8.68
TP2: 7.86
- ADX>25
- RSI<35
- RS and FFI -ve
- MACD -ve
- Breakdown with good volume on 16 Apr 2021

AGL BreakPosting for interest. dealing with a tight, ugly MACD for a short time, 1D confirmation 16th April. I'll be back to see what happens


AGL - UpdateG'day Ladies and Gentlemen,
AGL - Has confirmed a further target breaking with the breaking of the lows. If the bears can hit their targets I would expect a bottom to form somewhere in the buy zone. If that is the case the targets have been listed on the chart.
Remember AGL is in a bear market. Which means the trend can continue for as long as the market makers wants. That being said I do believe the bottom is close (Temporary Bottom).
Give me a follow and a like and I will supply you with more money. and comment on what TA you want to see next.

JSE:AGL Anglo American MarkupAfter some consolidation that started in April 2019, there has been a spring, break out of the trading range, backup and now the markup phase. After a pullback, the stock is again being pushed higher to likely new highs.

Possible short for AGL coming soon.Following a stochastic, MACD and EMA momentum strategy, AGL is showing two of the three confirmations for a short, if it trades lower today and the EMA's cross, I will take this as confirmation to enter a short position.

AGL - Long if we see a triangle breakoutJSE:AGL has formed a flat-top triangle and it is looking like we might see a bullish breakout soon. If it breaks through the top of the triangle, I will consider going long with a target around the previous highs of mid-August.


Ready ? AGL has been making higher lows & lower highs, a sure sign that it will burst out of the trendlines. It has burst out of the iChimoku cloud but is just below the 200 DMA which is at $21.61. A break & close above that price will be potentially bullish. I do not own it but my bias is to the upside.
