Wheat Futures ( ZW1! ), H1 Bullish rise!Type : Bullish rise
Resistance 1132'6
Pivot: 1106'4
Support : 1084'4
Preferred Case: With price breaking above the ichimoku cloud and making a new high on the donchian channel, we have a bullish bias that price will rise to our 1st resistance in line with the horizontal swing high resistance and 100% Fibonacci projection from our pivot in line with the pullback support.
Alternative scenario: Alternatively, price may break pivot structure and head for 1st support in line with the 50% Fibonacci retracement.
Fundamentals: No Major News
Agricultural Commodities

🍭Sugar fever! Top of the trend ?● Sugar #11 - ICE (SB.F) 🕐 TF: 30D
Fig.1 USX lb (pound)
In Figure 1 , you can see the wave count from January 2021 . A continuation of the upward correction Ⓑ with the target zone 18.04-21.27 was predicted. At the moment, the set goal has been achieved, the corrective wave looks completed. The probability of resuming the decline by the final impulse Ⓒ of e of (IV) is high.
_______________________________________
● SUGARUSD - OANDA 🕐 TF: 1D
Fig.2
An alternative wave count is marked in black, in which the minimum of 2020 , the level of 0.9051 , corresponds to the top of the supercycle (IV) . This counting option will become more relevant if the subsequent series of ascending zigzags, which at this stage is marked as (W)-(X)-(Y) of Ⓑ , takes the form of a diagonal .
_______________________________________
● SUGARUSD - OANDA 🕐 TF: 4h
Fig.3
Provided that waves (1)-(2) are formed as part of the emerging bearish trend, the first of which goes beyond the top (X) and consolidates under the lower border of the rising channel, there will be a good prospect for a short position.
_______________________________________
❗ Disclaimer:
— The owner of the TradeWaves-EWA © community is not responsible and has no direct or indirect obligations to the User/Customer in connection with any possible losses or financial damages related to any content of this community.

Soy beans Futures ( ZS1! ), H1 Potential for Bearish ContinuatioType : Bearish Continuation
Resistance : 1622'6
Pivot: 1611'2
Support : 1581'0
Preferred Case: With the ichimoku indicating some bearish momentum, we have a bearish bias that price will drop to our 1st support in line with the swing low support at 1581'0 from our pivot of 1611'2 in line with the 38.2%, 50% Fibonacci retracement and 78.6% Fibonacci projection.
Alternative scenario: Alternatively, price may break pivot structure and head for 1st resistance in line with the 50% Fibonacci retracement and 100% Fibonacci projection.
Fundamentals: No Major News

Wheat Futures ( ZW1! ), H1 Bullish rise!Type : Bullish rise
Resistance 1132'6
Pivot: 1084'2
Support : 1068'2
Preferred Case: With price bouncing off the ichimoku cloud support, we have a bullish bias that price will rise to our 1st resistance in line with the horizontal swing high resistance from our pivot in line with the horizontal swing low support and 50% Fibonacci retracement.
Alternative scenario: Alternatively, price may break pivot structure and head for 1st support in line with the 61.8% Fibonacci retracement.
Fundamentals: No Major News

wheatwe have a 2 senario
1: w4 can be complete as a triangle and finish soon as possible.
2: w4 can be continue and we are at the wb (triangle form)
i think scenario 1 can be happen

Wheat Futures ( ZS1! ), H1 Bullish rise!Type : Bullish rise
Resistance 1143'0
Pivot: 1123'0
Support : 1105'2
Preferred Case: With price moving above the ichimoku cloud, we have a bullish bias that price will rise to our 1st resistance in line with the 161.8% Fibonacci extension from our pivot in line with the horizontal pullback support and 23.6% Fibonacci retracement.
Alternative scenario: Alternatively, price may break pivot structure and head for 1st support in line with the 61.8% Fibonacci retracement.
Fundamentals: No Major News

COFFEE Wait For Breakout! Sell!
Hello,Traders!
COFFEE is again retesting a key level
And the price action looks somewhat bearish
So IF we see a breakout then I think that
The price will go further down
Towards the target below
Sell!
Like, comment and subscribe to boost your trading!
See other ideas below too!

Another Wheat cycle? - RSI AnalysisRSI has been consistent above the 50 level. Looks like another Wheat commodity cycle.

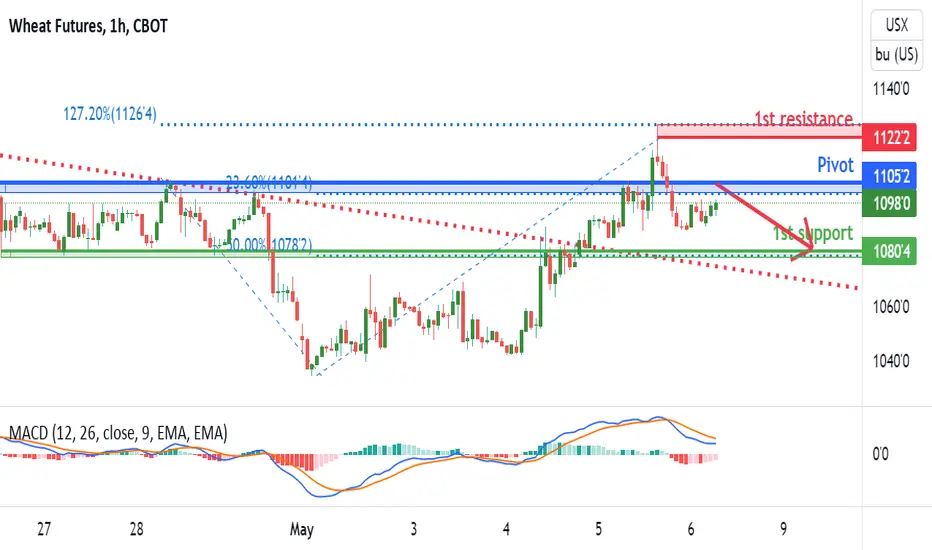
Wheat Futures ( ZW1! ), H1 Potential for Bearish ContinuationType : Bearish Continuation
Resistance : 11122'2
Pivot: 1105'2
Support : 1080'4
Preferred Case: With the MACD indicating some bearish momentum, we have a bearish bias that price will drop to our 1st support in line with the 50% Fibonacci retracement and horizontal pullback support from our pivot of 1105'2 in line with the 23.6% Fibonacci retracement and the horizontal overlap support.
Alternative scenario: Alternatively, price may break pivot structure and head for 1st resistance in line with the 127.2% Fibonacci extension and horizontal swing high resistance.
Fundamentals: No Major News
Dow Jones Coffee Index: Reversal H&S?Main Pattern: Weekly Reversal Head & Shoulders
Minor Pattern: Continuation Bearish Daily Head & Shoulders could confirms the Weekly Pattern
downside: the neckline is not horizontal
the trigger points are:
Daily 201
Weekly 199/198

THREAD #3 : Commodities Update ‼️I know it took time to get this thread update, I'm sorry for that, but here it is !
▶️ How it works ?
Ask me in comment my chart analysis of the asset you want if it didn't have already done under. If I find something intersting to say and show, I will update the idea with it. A comment of each asset expose will be post under, come react about it or debate.
▶️ Before to start I want to remind that we are in a period of conflict and news can emerge at any moment with strong effect and reaction on market. So invest carefully on this hard times and reduce your loss exposition on market when you can. Don't forget to take profit too.
CRUDE OIL ✅
One of my perspectives in the last update was to see price going to the A line before to fall back rapidly, we falled but we can see we stopped just before the resistance. Precision of the market is remarquable so I keep this target in mind to get reach it in the future. For the moment we can expect a return on the 2b line, constructing a channel, even if the exact channel would be to target 3b but it can be an exageration of the market. Like each commodities update, I remind that it's a highly manipulated asset so, or stay away of it, or be very careful of your loss exposure.
GOLD ✅
"The chart don't have change since the commodities update of the 20th of January. We are coming to the end of the bull scenario. I invit to take profits on the conjoncture of the resistance area and the (2c) resistance. There is no interest to sell a refuge asset like gold, even more in this time of conflict. So if there is selling signals take it like an opportunity to buy it lower. Especially here, we will wait for buying signals on the (1b) or (1a) support and the best case would be the support area of $1,700 - $1,675 but far from now."
This was my exact words two months ago, I think there is nothing to add because it's exactly what is happenning. We've seen a buying pressure on (1b) but without buying volume, so no reason to buy, now we are going for the next area : the (1a) support. Wait signals, if there isn't on (1a), wait the support.
SILVER ✅
Like for the gold : "I don't expect a breakout of (1b) and the resistance area, so for me we will see the construction of a range between them around $27 and $29. The biggest probability for me is a bull outcome of the range to target the (1c) resistance (scenario A) and probably more after. If we reject the resistance strongly after lateralization I expect price to go deeply retest the (1a) support around $20."
Very close again from the reality, in fact, we ranged (2$ lower from my expectations). Unfortunetly we didn't got the bull outcome and strongly rejected on supply. Like expected a deep retest to the supports. Speaking of now, the close of tonight is really important cause we broke the 2b support and reacted with buying pressure on support area. If we close tonight back inside the channel (upper of (2b)), we could expect a reintegration and so with buying volume tomorrow, a confirmation of it. Else we could expect a simple pullback on the broken support (which mean short opportunities on lower timeframe) to go back lower to the expected bear scenario of 2 month ago, the $20 area. Furthermore we can see a stop hunt pattern taking place on support, nice setup to see climax.
COPPER ✅
Copper have been one of the assets that I most spoke. Because of the Wyckoff Reaccumulation pattern we had, and which brought signals and targets. The last update was the failed SOS, closing the long position because of the expectation to see a pullback to the support. In fact we are going for it, we are always in between so expectations didn't changed. We will see on support if we have long signals to exploit. Maybe we could build a bigger Wyckoff pattern (reaccumulation or distribution), in this case it would be really interesting because we could exploit as long and short signals around, respectively, support and resistance.
PLATINUM ✅
Very similar as silver we can observe the sames patterns, sames signals. So no much things to add, if we reintegrate we can exploit pullback on (2b), else we wait opportunity given by stop hunt to take a deeper position around $840 or $760.
PALLADIUM ✅
"We made an SOS which has also failed. So technically, the biggest probability is to see it go down on the (2b) line in a first time (scenario A) maybe more with (1a) before to retest the resistance (1b)."
Nothing more to add again, the plan continue to go in the right way. We are ranging around (2b), no signal for the moment so we can expect a continuation to (1a) (SCENARIO A) but it's important to stay aware about the possibility to see a Wyckoff acummulation here (SCENARIO B), no signal of it for the moment.
WHEAT & CORN ✅
The master word on the last update on wheat was to take profit on ATH because of the expectation of a strong selling pressure like oil, in fact it happened. We already made half of the job to go back to the last resistance being broke. Wait signals around here to target a retest of ATH. Else each broken resistance become a nice spot to target entry. Corn is similar to it. For both, with the macroeconomic context we can expect retests of ATH. In all case stay careful, it stay heavily influenced by the macroeconomic dynamics so from news also.
SUGAR ✅
A nice way to finish is to speak from the plan we had in the last update and which succeed ! We had a Wyckoff Reaccumulation Pattern, it was EXACTLY the same setup as the one on the copper which also succeed. The spot to survey was the pullback on the creek, entry signal was perfect on H4 timeframe. Target on 2:1 ratio, then second target on resistance level, then exit because of the failed SOS. It was a nice setup shared it and I'm happy of that.
Let's speak of future expectation now, it's really close to the copper analysis. We will see if we could build a bigger pattern, in this case everything is exploitable ON SIGNALS always!
Furthermore we stay in a monthly interest area where as Wyckoff Reaccumulation and Wyckoff Distrubution pattern could bring to a big movement. So it will be an asset to look closely on in the future.
🛑"Making money in trading is math and respect of strategy, so never let your emotions guide you in uncomfortable positions"🛑
👉 Like, follow or comment* if you like, I need it to continue !
*Speaking of comments, come ask questions, come share your point of view, come debate, I need to feel that my without counterpart work is usefull for some !

Wheat Futures ( ZW1! ), H1 Bullish rise!Type : Bullish rise
Resistance : 1105'2
Pivot: 1081'4
Support : 1065
Preferred Case: With price moving above the ichimoku cloud and and the recent break of the descending trendline which signifies bullish momentum, we have a bullish bias that price will rise to our 1st resistance in line with the 1105'2 in line with the 61.8% Fibonacci retracement and swing high resistance from our pivot of 1081'4 in line with the 61.8% Fibonacci retracement and the horizontal overlap support.
Alternative scenario: Alternatively, price may break pivot structure and head for 1st support at 1065 in line with the 50% Fibonacci retracement and the horizontal pullback support.
Fundamentals: No Major News

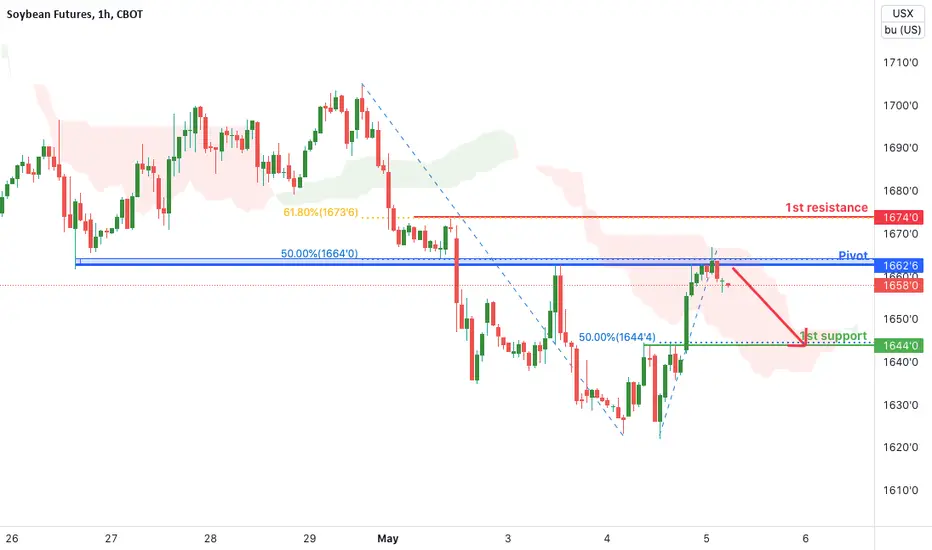
Soybean Futures (ZS1!), H1 Potential for Bearish ContinuationType : Bearish Continuation
Resistance: 1674
Pivot: 1662'6
Support : 1644
Preferred case: With price moving below the ichimoku cloud, we see a potential bearish continuation from our pivot level of 1662'6 which is in line with 50% Fibonacci retracement and horizontal pullback resistance towards our 1st support level of 1644 which is in line with the horizontal pullback support.
Alternative scenario: Alternatively, price may break our pivot structure and head for 1st resistance level of 1674 in line with 61.8% Fibonacci retracement and horizontal pullback resistance.
Fundamentals: No major news.
Wheat Futures ( ZW1! ), H1 Bearish dip!Type : Bearish drop
Resistance : 1105'2
Pivot: 1080'2
Support : 1042'4
Preferred Case: With price expected to reverse off the stochastics indicator, we see a potential bearish continuation from our pivot level of 1080'2 which is in line with 61.8% Fibonacci retracement and horizontal pullback resistance towards our 1st support level of 1042'4 which is in line with the horizontal swing low support and 61.8% Fibonacci projection.
Alternative scenario: Alternatively, price may break our pivot structure and head for 1st resistance level of 1105'2 in line with 61.8% Fibonacci retracement and horizontal pullback resistance.
Fundamentals: No Major News

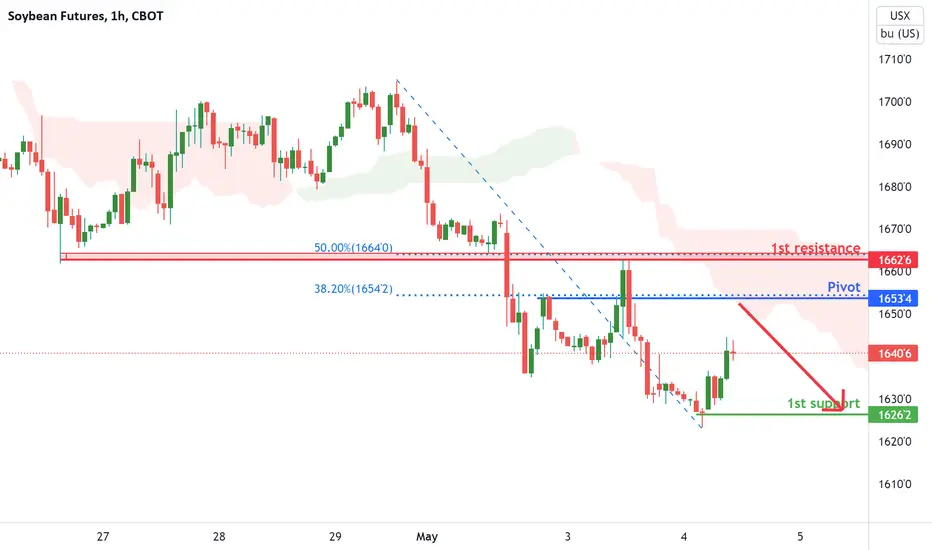
Soybean Futures (ZS1!), H1 Potential for Bearish ContinuationType : Bearish Continuation
Resistance: 1662'6
Pivot: 1653'4
Support : 1626'2
Preferred case: With price moving below the ichimoku cloud, we see a potential bearish continuation from our pivot level of 1653'4 which is in line with 38.2% Fibonacci retracement and horizontal pullback resistance towards our 1st support level of 1626'2 which is in line with the horizontal swing low support.
Alternative scenario: Alternatively, price may break our pivot structure and head for 1st resistance level of 1662'6 in line with 50% Fibonacci retracement and horizontal pullback resistance.
Fundamentals: No major news.
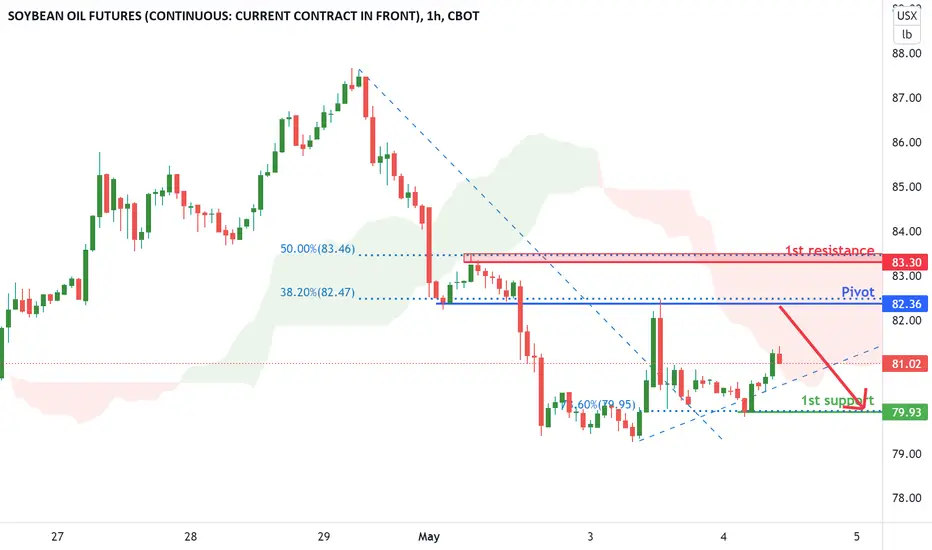
Soybean Oil Futures (ZL1!), H1 Potential for Bearish ContinuatioType : Bearish Continuation
Resistance: 83'30
Pivot: 82'45
Support : 79'93
Preferred case: With price expected to reverse off the resistance of the ichimoku cloud, we see a potential bearish continuation from our pivot level of 82'45 which is in line with 38.2% Fibonacci retracement and horizontal pullback resistance towards our 1st support level of 79'93 which is in line with the horizontal swing low support and 78.6% Fibonacci retracement.
Alternative scenario: Alternatively, price may break our pivot structure and head for 1st resistance level of 83'30 in line with 50% Fibonacci retracement and horizontal swing high resistance.
Fundamentals: No major news.
SUGAR SHORT..... 6.5RR OPPORTUNITYOh Sugar!
I know most of us do not trade this pair, but I have managed to make so good trades from this commodity so far. I think you guys should check it out. As for commodity, I only trade Silver and Sugar. I would like to trade Gold but the lot size requirement is not for me as at now.
Anyways, this pair has been bullish and has hit the monthly high, it is likely to retrace to the marked zone bring about some short opportunity.
Cheers!

Why has the Russian ruble not collapsed yet?
Russia’s efforts to prop up the ruble appears to be working despite sanctions imposed by Western countries aimed at cutting the Kremlin’s access to external resources and crippling the nation’s ability to fund its war against Ukraine.
Last week, the ruble surged to a more than two-year high against the euro and the US dollar, recouping its losses during the war. The rally was triggered by Russia’s last-ditch attempt to avoid defaulting on a eurobond on Friday.
Russia’s finance ministry paid $564.8 million in interest on a 2022 eurobond and $84.4 million on another 2042 bond, the ministry said Friday. Both payments were made in US dollars, marking a reversal from its previous threat to pay its debts in rubles.
To begin this week, the ruble has continued its strong performance, with the USDRUB down almost 3%. As it stands, Rubles are exchanging hands at less than 69 per USD.
Rating cut to selective default
Prior to the payment of these bonds, Russia had earlier paid its dollar-denominated bonds in rubles, triggering a rating downgrade by S&P Global Ratings to “selective default.”
The rating agency said investors won’t likely be able to convert those payments into dollars equivalent to the amount due as sanctions on Russia are predicted to worsen in the coming weeks.
Gas for ruble
In a bid to bolster the ruble and retaliate against Western sanctions, Russia, one of the top oil-producing countries worldwide, required “unfriendly” buyers of the country’s natural gas to pay in rubles. While many European Union leaders were quick to reject the Kremlin’s demands, one of Germany’s biggest energy companies, Uniper, said it was ready to buy Russian gas by converting its euro payments into roubles.
"We consider a payment conversion compliant with sanctions law and the Russian decree to be possible," a spokesman was quoted by BBC as saying recently, adding that the absence of Russian gas “would have dramatic consequences for our economy.”
Russian national energy giant Gazprom recently cut off its gas supplies to Poland and Bulgaria due to their refusal to pay in rubles.
Commodity powerhouse
Many countries’ reliance on Russian oil and other commodities like wheat has helped the ruble avoid collapse and may play a role in supporting the currency moving forward.
Vyacheslav Volodin, a top Russian lawmaker, over a month ago said Russia should demand ruble payments for other commodities like wheat, fertilizer, and lumber, adding that Western governments have to pay for their decisions to sanction Russia.

$CC #Cocoa #Cacao Short term analysis of cocoa market trend giving the latest information on the commodity. DXY and VIX must be taken into account.

CT1!. P-Modeling Pt 2. Cottons of Cajun: A Hyperinflation Story Welcome Hyperspace Travelers,
This is a 1-week time-series model of CT1! Cotton No 2. Futures Contracts.
The purpose of this model is to potentially pick up early warning signs of hyperinflation.
I think I found a juicy early warning sign.
I may of course be incorrect.
If we look at data starting in 1973 we can see a well defined coordinated harmonics string with one big event between 2010 and 2012.
There is a strong probability that a continuously rising cost of cotton is an early warning sign of hyperinflation.
IF.. we continued on the path we are on. THEN... we hit a Strike Target of $220.00. This was the 2010-2011 ATH.
Do we repeat the past?
I say yes. Maybe? I guess? Sure, why not.. Seems logical.
But what do I know?... I just draw irrelevant spirals and lines. Right? Zero Predictive Value. So why attempt or even try? Waste of time if you ask me.
But what if..
Global supply and transportation issues. On the cusp of the next industrial revolution.. finite resources.. extreme weather.. destruction of our planet.. cheap labor shortages.. biggest division of wealth ever... You know this.. Right?
I just look at the same data as everyone else.
Just.. with a different grasp of the future..
Sometimes, I really wonder if we are apart of a simulation.
Is this real life? Or is this a test?
Communicative Cyclic Filters: Rendered along harmonic string.
Are you a test?
Is this just a big test?
Things to think about I guess..
See you soon :).
Thanks for Pondering the Unknown with me,
Glitch420

SoyBeans: Cup & Handle + H&SMain Pattern: Cup & Handle?? a little dirty
Daily Pattern: Confirmation H&S?? a little dirty too
maximum risk 0.50%
long above 1734 first one 0,25%

10 yr KC Wheat potential10yr KC Wheat outlook: Potential course of the KC Wheat market for the next 10 years. Overall the Wheat chart takes a more gradual incline up over the past 50 years but when the market gets spooked, prices can rally in a violant way. After this market tops, I feel the World’s supply and demand fundamentals of all Ag Commodities could support a more gradual transition lower for wheat if food security and shortages remain elevated. The market should remain very sensitive for another few years. Sensitive to world demand and production misses across the globe. There are many climate cycles coming ahead that could add to potential Ag production shortages. Wheat is used for food, Corn and beans have other purposes that could influence more volatile markets ahead for them…
**Not a prediction, something to watch**

KC Wheat Rate of Change PotentialKC Wheat – 3mo Continuous: Comparing our current Bull market with the previous major bull markets of the past 50 years. Currently the 24 mo ROC high was set in March at 225% with a price of 12.99. If KC Wheat is to match the 06-08 ROC of 275%, then that would project a price of $15.00
**Disclosure** Do not take this as trading advice. The potential is there for higher markets, but anything could keep us from getting above today’s High.
