Options Blueprint Series: Leveraging Diagonals with Corn FuturesIntroduction to Corn Futures (CBOT)
Corn Futures, central to the commodities market, are traded on the Chicago Board of Trade (CBOT). These futures contracts are standardized agreements to buy or sell 5,000 bushels of corn, providing traders with a mechanism to hedge against price changes or to be exposed to future price movements in the agricultural sector.
Contract Specifications:
Contract Size: 5,000 bushels
Quotation: Cents per bushel
Minimum Tick Size: ¼ cent per bushel, equivalent to $12.50 per contract
Trading Hours: Sunday to Friday, electronic trading from 7:00 PM to 7:45 AM CT, and Monday to Friday, daytime trading from 8:30 AM to 1:20 PM CT
Contract Months: March, May, July, September, December, with additional serial months providing year-round trading opportunities
Margin Requirements: Margins are set by the exchange and can vary, with initial margins typically being a fraction of the contract value to secure a position ($1,300 at the time of this publication)
The liquidity and volume in Corn Futures make them an attractive market for traders. Factors influencing corn prices include weather patterns affecting crop yields, global supply and demand dynamics, and changes in energy prices due to corn's role in ethanol production.
Understanding Diagonal Spreads
Diagonal Spreads are a sophisticated options strategy that involves simultaneously buying and selling options of the same type (either calls or puts) with different strike prices and expiration dates. This approach is designed to leverage the time decay (theta) and volatility differences between contracts, making it particularly suitable for markets with expected directional moves and distinct volatility characteristics, like Corn Futures.
Key Components:
Long Leg: Involves buying an option with a longer expiration date. This option acts as the foundational position, typically chosen to be in-the-money (ITM) to capitalize on intrinsic value while also benefiting from time decay at a slower rate due to its longer duration.
Short Leg: Consists of selling an option with a shorter expiration date and a different strike price, usually out-of-the-money (OTM). This leg generates immediate income from the premium received, which helps offset the cost of the long leg.
Strategic Advantages:
Directional Flexibility: Diagonal spreads can be tailored to bullish or bearish outlooks depending on the selection of calls or puts, strikes and expirations.
Time Decay Harnessing: By selling a shorter-term option, the strategy aims to benefit from the rapid acceleration of time decay on the sold option, improving the position's overall theta.
Given the cyclical nature of the agricultural sector and the specific factors influencing corn prices, diagonal spreads offer a strategic method to trade Corn Futures options. They provide a balance between long-term market views and short-term income generation through premium collection on the short leg.
Application of Diagonal Spreads to Corn Futures
In applying Diagonal Spreads to Corn Futures, we focus on a bearish strategy to capitalize on an anticipated gap fill below the current price level. This strategic choice is driven by the analysis of Corn Futures' price action, indicating potential downward movement. A bearish diagonal spread can be particularly effective in such scenarios, offering the flexibility to benefit from both time decay and directional movement.
Bearish Diagonal Spread Setup:
Long Leg (Buy Put): Select a put option with a longer expiration date to serve as the foundation of your bearish position. Choose a strike price that is at-the-money or in-the-money (ATM/ITM) to ensure intrinsic value.
Short Leg (Sell Put): Sell a put option with a shorter expiration date at a lower strike price that is out-of-the-money (OTM).
Trade Example:
Assumption: Corn Futures are trading at 434 cents per bushel.
Long Put: Buy a 47-day put option with a strike price of 435 cents, paying a premium of 7.49 cents per bushel ($374.5 – point value =$50).
Short Put: Sell a 19-day put option with a strike price of 415 cents, receiving a premium of 1.01 cents per bushel ($50.5 – point value =$50).
As seen on the below screenshot, we are using the CME Options Calculator in order to generate fair value prices and Greeks for any options on futures contracts.
The goal is for Corn Futures to decline towards the 415-cent level (origin of the gap).
Risk Considerations: While diagonal spreads can offer controlled risk (premium paid = 6.48 = 7.49 – 1.01 = $324 – point value =$50) and strategic flexibility, it's crucial to be mindful of the potential for loss, particularly if the market moves sharply in an unintended direction. Employing risk management techniques can help mitigate these risks:
Adjustments and Rolls: Proactively manage the position by adjusting or rolling the short leg to a different strike price or expiration date in response to market movements or changes in volatility. This can help collect additional premium and potentially offset losses on the long leg.
Use of Stop Losses: Implement stop-loss orders based on predefined risk tolerance levels. This could be set as a percentage of the initial investment or based on the technical levels in Corn Futures prices.
Diversification: While not specific to the strategy, diversifying your portfolio beyond just Corn Futures options can help manage overall market risk. Different markets may react differently to the same economic indicators or geopolitical events, spreading your risk exposure.
Regular Monitoring: Given the dynamic nature of Corn Futures and the options market, regular monitoring is crucial. Stay informed about market conditions, news impacting agricultural commodities, and changes in volatility that could affect your position.
Diagonal spreads in Corn Futures offer a strategic avenue for traders looking to exploit market conditions and time decay with a defined risk profile. However, the key to successful implementation lies in diligent risk management, including making informed adjustments, employing diversification, and maintaining a disciplined approach to monitoring and exiting positions.
Conclusion
In this edition of the Options Blueprint Series, we explored the strategic application of Diagonal Spreads to Corn Futures traded on the Chicago Board of Trade (CBOT). This advanced options strategy offers traders a nuanced approach to potentially capitalize on market movements, leveraging the inherent time decay of options to enhance potential returns.
Employing Diagonal Spreads allows traders to express a directional bias—bearish, in our case study—while managing the investment's risk profile through a combination of long-term and short-term options. By buying a longer-dated, in-the-money put and selling a shorter-dated, out-of-the-money put, traders can set up a position that benefits from both the expected downward movement towards a gap fill and the accelerated time decay of the sold option.
However, as with any sophisticated trading strategy, understanding and managing the associated risks is paramount. Directional risks, volatility changes, and the potential for early assignment on the short leg require vigilant management and a readiness to adjust the position as market conditions evolve.
By adhering to disciplined risk management practices—such as making timely adjustments, employing stop losses, and maintaining portfolio diversification—traders can seek to navigate the complexities of the options market and aim for consistent, strategic gains.
The Corn Futures market, with its dynamic price movements influenced by a range of factors from weather to global supply and demand dynamics, provides a fertile ground for applying Diagonal Spreads. Traders who invest the time to understand both the underlying market and the intricacies of this options strategy may find themselves well-positioned to exploit opportunities that arise from market volatility.
In summary, Diagonal Spreads present a strategic option for traders looking to leverage market insights and options mechanics in pursuit of their trading objectives. As always, education and practice are key to mastering these techniques, with paper trading offering a risk-free way to hone one's skills before venturing into live markets.
When charting futures, the data provided could be delayed. Traders working with the ticker symbols discussed in this idea may prefer to use CME Group real-time data plan on TradingView: www.tradingview.com This consideration is particularly important for shorter-term traders, whereas it may be less critical for those focused on longer-term trading strategies.
General Disclaimer:
The trade ideas presented herein are solely for illustrative purposes forming a part of a case study intended to demonstrate key principles in risk management within the context of the specific market scenarios discussed. These ideas are not to be interpreted as investment recommendations or financial advice. They do not endorse or promote any specific trading strategies, financial products, or services. The information provided is based on data believed to be reliable; however, its accuracy or completeness cannot be guaranteed. Trading in financial markets involves risks, including the potential loss of principal. Each individual should conduct their own research and consult with professional financial advisors before making any investment decisions. The author or publisher of this content bears no responsibility for any actions taken based on the information provided or for any resultant financial or other losses.
Agricultural Commodities

wheat in strong downtrendwheat is ready to go... excellent RR here... not only 3.5 to first target, but ocasion to build position towards much lower... moving stops to Be or trail
*not financial advise

Soybeans will take off with inflationI see a sharp ramp up in commodities after Powell's presser on Friday when the inflation metrics come out and he sends a Dovish message (not hawkish enough). The dollar will end up turning back up this summer so I see this upward trend momentarily until after the FED goes in with CBDC's and then commodities will take off. At that point I doubt stocks will exist so I would just caution you to buy freeze-dried food and some precious metals because a Global Depression is coming.

COCOA about to crashNot much of a technical analysis as we can see but there is not much we can do about it. The chart is just parabolic due to the high amount of big companies hedging against the worse-than-expected harvest. The fundamental analysis could not be much of a help either because nothing can resonate with such pricing for the cocoa. This type of trade is just speculative because it has a decent Risk-Reward.
Stops above the previous high
TP between 7,000-7,600$

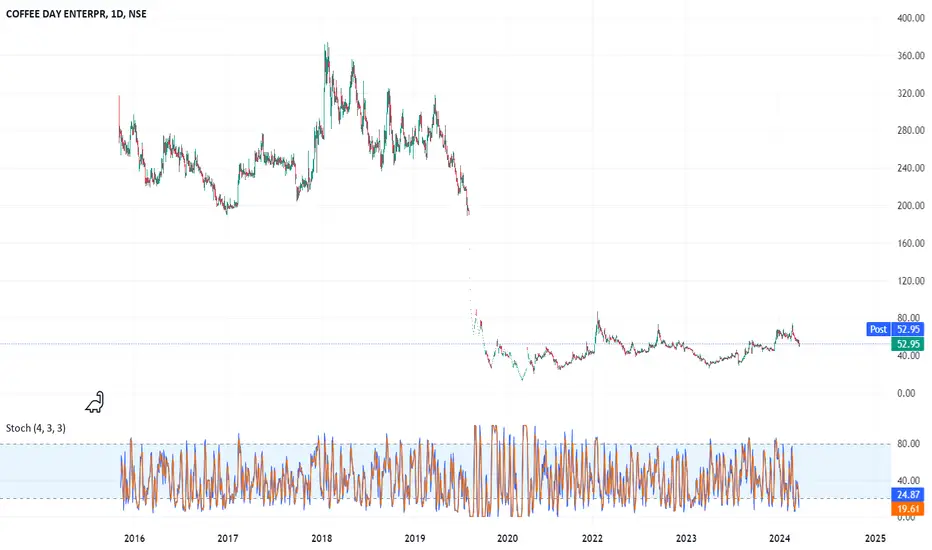
Buy Coffee Day Enterprises LtdCoffee Day Enterprises Ltd. which runs cafe chain with brand name Cafe coffee day is trading at a current price of 53.2 rupees but it's book value is 146. Its around 2.744 times book value. The company is running and generating profit even after the death of its founder years back. It shows that the management of the company is keen to take the company to new heights.
Hope you love my analysis.
Please invest after your own analysis.
Do like and follow.
Thank you.
SOYBEANS Excellent buy opportunity.Soybeans (ZS1!) has been trading within a Channel Down pattern since early 2023 just last week, it almost hit its bottom (Lower Lows trend-line). So far the price has reacted with a minor rebound, while the 1D RSI has been on a major Bullish Divergence (Higher Lows against the price's Lower Lows).
This is the best buy signal since the May 31 2023 bottom where again after an RSI Bullish Divergence, the price rebounded aggressively to the 0.618 Fib on a +12.56% rally. So far within this long-term Channel Down, we have had similar rebounds of +12.56%, +14.26% and +11.86%.
Assuming the minimum of +11.86%, we are setting a Target on Soybeans at 1263'5, which may almost make contact with the 1D MA200 (orange trend-line), which has been the natural technical Resistance since April 24 2023.
-------------------------------------------------------------------------------
** Please LIKE 👍, FOLLOW ✅, SHARE 🙌 and COMMENT ✍ if you enjoy this idea! Also share your ideas and charts in the comments section below! This is best way to keep it relevant, support us, keep the content here free and allow the idea to reach as many people as possible. **
-------------------------------------------------------------------------------
💸💸💸💸💸💸
👇 👇 👇 👇 👇 👇

CORN Excellent 4-month buy opportunity.Corn's (ZC1!) price action since the COVID recovery in early 2020 is showcasing an amazing resemblance with the previous full Cycle of 2009 - 2014. This is better illustrated on the 1M (monthly) time-frame. Both started the Bull phase on a roughly +175% rebound on the 17 year Support Zone, topping on a Higher Highs (which was a Bearish Divergence with the Lower Highs of the 1M RSI) and then declined both astonishingly by -51.93%.
This is where the market is at now. In 2014 the price rebounded by +28.78% back above the 1W MA50 marginally and just below the 0.382 Fibonacci retracement level, before resuming the long-term decline to the 17 year Support Zone.
As a result, this presents an excellent 4-month buy opportunity with 506'4 as the Target (+28.78%). Notice also that the 1M RSI is on the exact same level (33.75) as it was on the January 2014 Low, and is reversing.
-------------------------------------------------------------------------------
** Please LIKE 👍, FOLLOW ✅, SHARE 🙌 and COMMENT ✍ if you enjoy this idea! Also share your ideas and charts in the comments section below! This is best way to keep it relevant, support us, keep the content here free and allow the idea to reach as many people as possible. **
-------------------------------------------------------------------------------
💸💸💸💸💸💸
👇 👇 👇 👇 👇 👇

Cotton # 2 Futures. The Epic 52-Week Highs BreakthroughThe main technical graph is for Cotton # 2 Futures that firmly up this year, with solid 13.5 percent performance in 2024 to this time.
The weekly Commitment of Traders report showed managed money cotton traders dropped 6k existing shorts and added 11.6k new longs during the week that ended 2/6. That raised their net long to 46,344 contracts. Commercial cotton hedgers added 17.5k short hedges for a 90,540 contract net short as of 2/6.
NOAA’s 7-day QPF has another band of heavy precip for the South/East. From the Gulf of TX through TN/NC/KY accumulations top out near 4”. Most of Northern LA, North/Central MS, Northern AL, and Northern GA will get ~2”. Central TX cotton area will also get ¾ to 1 ½” of precip to build up soil moisture reserves. Yesterday’s Drought Monitor confirmed there was still some D3-D4 in Northeast MS, but the total D3-D4 area has fallen from 29% to 2% since December 5th for the South-Southeast.
The monthly WASDE update showed a 150k bale lighter domestic cotton use, now at 1.75 million bales. Exports, however, were raised by 200k bales to offset. On net ending stocks tightened by 100k to 2.8 million in the report.
The main technical graph for Cotton # 2 futures ICEUS:CT1! indicates on 52-week highs breakthrough, as massive 20-years SMA supported the price over the past 12-15 months.
Weekly RSI(14) sub chart is to confirm this epic breakout, while COT data says, Largest speculators are still positive in net position all the time, keeping calm above Zero-level, while producers are to massively sell the production.

[COCOA] Cacao timing to take the correctionCurrently, the PEPPERSTONE:COCOA (cacao) market has undergone a notable upside rally over recent days, culminating in a significant move towards the $6000 level. Today, we observed a precise hit of this key psychological level, followed by a clean rejection, prompting a short position.
The primary objective now is to remain below this crucial $6000 level, aiming to capitalize on a potential correction in the recent upward surge. By maintaining short positions, we aim to capture the potential downside movement with a relatively small risk, yet the possibility of a substantial gain.
Initially, the trade unfolded favorably, with the price action aligning with our short position. However, subsequent movement saw a retracement back towards the entry level, highlighting the need for vigilance and adaptability in response to evolving market conditions.
As we await further price action, it's imperative to remain attentive to developments in the PEPPERSTONE:COCOA market. Tomorrow's movements will provide valuable insights into the durability of the recent rejection and the potential continuation or reversal of the prevailing trend.
In navigating this trade, maintaining a disciplined approach and closely monitoring key levels and indicators will be crucial. While the potential for a significant win exists, it's essential to manage risk effectively and remain adaptable to changing market dynamics.

Wheat Futures IdeaI will monitor price action on this floor and have set alerts for entry.
Wheat futures need a correction to the upside.
Let me know your thoughts.
The Professor

SUGAR is sweetwww.tradingview.com
White Sugar price increase will lead to the breakout of local Delta sugar price.
Long position is foreseen
check the analysis to determine whether it suits you

WHEAT Bearish pressure under the 1D MA50 and MA200.Wheat (ZW1!) has been trading within a long-term Channel Down pattenr since July 2022. The price is currently on a bearish sequence below both the 1D MA200 (orange trend-line) and 1D MA50 (blue trend-line). It appears that technically this is a Bearish Leg following the December 06 2023 Lower High rejection, similar to the one that started on the October 10 2022 Lower High.
That sequence reached the Channel Down bottom on the 1.786 Fibonacci extension. As a result, our long-term Target is 455'7.
-------------------------------------------------------------------------------
** Please LIKE 👍, FOLLOW ✅, SHARE 🙌 and COMMENT ✍ if you enjoy this idea! Also share your ideas and charts in the comments section below! This is best way to keep it relevant, support us, keep the content here free and allow the idea to reach as many people as possible. **
-------------------------------------------------------------------------------
💸💸💸💸💸💸
👇 👇 👇 👇 👇 👇

MFPC & ABUK will lead the EGX30Urea & White sugar prices increased in the commodities market; this price increase will flirt with the bullish fertilizers sect of the EGX. ABUK & MFPC will lead EGX30 to the 30K Bar.
SUGAR is TAILGAITING

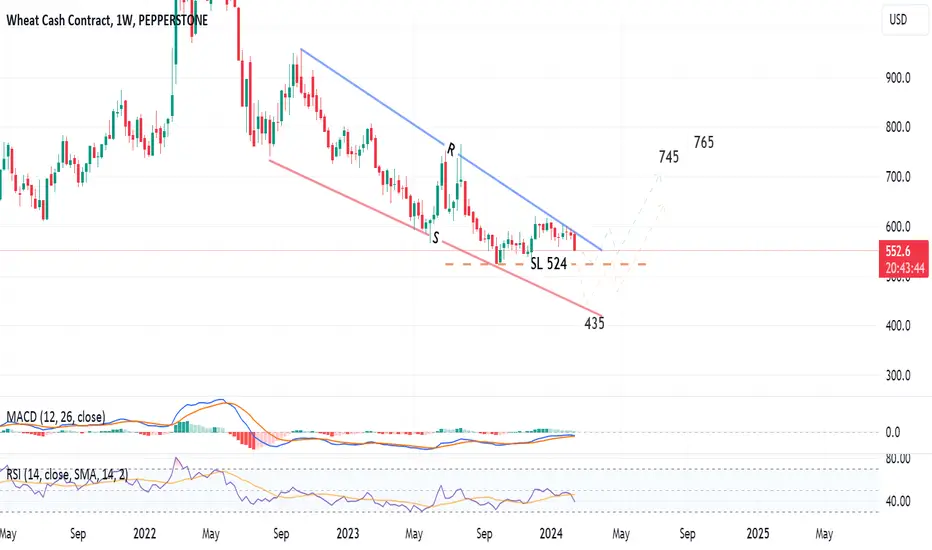
Wheat is trading in a falling wedge!Weekly chart, wheat cash contract is trading in a falling wedge!
Will we see the 435 - 400 price level or rebound upwards from 520 - 525?
It is tough to confirm.. However, this falling wedge pattern has a higher probability that the price will cross the resistance (line R) upwards towards 745 and 765 in the long term.
Descending Wedge & Bullish Divergence on March SoybeansFundamental Outlook:
There’s no beating around the bush - the fundamental outlook for soybeans is bearish. Global ending stocks are now at all time highs per the last WASDE report, and export demand for U.S. soybeans has slowed considerably - currently down around 19% year-over-year. As South American harvest progresses, the outlook of the Brazilian soybean crop has also improved.
Talking Technicals:
Despite the bearish fundamental outlook - the descending wedge, bullish divergence on 14-day RSI, and declining volume profile presents a bullish setup. Managed money funds remain aggressively short - holding a net-short position greater than 150,000 contracts across futures and options on soybeans. An upside breakout could result in short-covering, ultimately propelling prices higher in the near-term. Descending wedge patterns typically see sharp, upside breakouts which would be akin to the price action observed in a short-covering rally.
Check out CME Group real-time data plans available on TradingView here: www.tradingview.com
Disclaimers:
CME Real-time Market Data help identify trading set-ups and express my market views. If you have futures in your trading portfolio, you can check out on CME Group data plans available that suit your trading needs www.tradingview.com
*Trade ideas cited above are for illustration only, as an integral part of a case study to demonstrate the fundamental concepts in risk management under the market scenarios being discussed. They shall not be construed as investment recommendations or advice. Nor are they used to promote any specific products, or services.
Futures trading involves substantial risk of loss and may not be suitable for all investors. Trading advice is based on information taken from trade and statistical services and other sources Blue Line Futures, LLC believes are reliable. We do not guarantee that such information is accurate or complete and it should not be relied upon as such. Trading advice reflects our good faith judgment at a specific time and is subject to change without notice. There is no guarantee that the advice we give will result in profitable trades. All trading decisions will be made by the account holder. Past performance is not necessarily indicative of future results.

Shree Renuka SugarBuy different levels marked.
*Education purpose only. Investment in stock market is subject to market risk.

BULL TK cross & Kumo Twist 13:45 on Thursday, Bullish signals were present.
Sugar is supertrending, taking into consideration stability of USD EGPp rate.

Coffee going lower!?!?Potential bearish scenario for the next days, lets see if we reach the swing low

EU faces pressure to defuse mounting anger as farmers protest aGiven the mounting anger and protests by farmers across Europe, there appears to be a significant challenge stemming from contradictory and potentially detrimental agricultural policies. The grievances include increased costs for agricultural diesel, additional fees for water consumption, complex regulations, and objections to bans on pesticides and herbicides mandated by the EU's Green Deal. The farmers are also concerned about the import of beef from countries like Brazil and Argentina, which they argue have laxer rules on animal welfare, making competition difficult.
This unrest, originating in France but spreading to neighboring countries, signals a broader issue with unpredictable government decisions affecting agriculture. In the Netherlands and Germany, similar protests have arisen over regulations to cut nitrogen emissions and phase out fuel subsidies, respectively. In Germany, there is also resentment over what is perceived as the unfair application of environmental policies.
With protests extending to Poland, Romania, Slovakia, Hungary, and Bulgaria, concerns range from unfair competition from cut-price cereals to high taxes and tight regulations. The impact of droughts, floods, and wildfires, combined with the squeeze from green policies, has fueled discontent.
For investors, this could be a pivotal moment to consider commodities such as cereals, soybeans, and copper. The disruptions in European agriculture may create fluctuations in the market, making these commodities potentially attractive for investment. However, it is crucial to monitor developments closely as tensions continue to grow, and the agricultural sector shapes up to be a major issue in the upcoming European Parliament elections in June.

Where is the bottom for soybeans? Soybean futures are off to a rough start in 2024. In the first week of trading, March soybeans were down nearly 42 cents on the back of beneficial rains sweeping Central Brazil. Selling pressure permeated into Monday’s session as well, with soybeans trading down into the mid 1230’s. So, the question now becomes, will March soybeans make new contract lows?
Fundamental Snapshot :
Monday’s lower price action is not all that surprising considering U.S. export inspections for soybeans were reported at 675k metric tons - below average trade estimates. Meanwhile, Brazil has been exporting both corn and soybeans at record paces each of the past two years, and is expected to have a record or near-record soybean crop this year as well. Wednesday, CONAB will release data pertaining to their estimations of corn and soybeans. Currently, they are less optimistic about the state of the Brazilian soybean crop than the USDA, and USDA will release their World Agricultural Supply and Demand Expectations report on Friday. If we see sweeping downward adjustments to production estimates from both CONAB and USDA, it may help soybeans find a bottom. However, if the market is disappointed in the data released this week, we may see soybeans test 1200 sooner rather than later.
Technical Outlook :
After last week’s precipitous drop, it was surprising that March beans failed to enter oversold territory. However, it did not take long to break into OS territory on Monday’s session. The head-and-shoulders pattern that’s developed over the past fiscal quarter has a difference of approximately $1.20/bu, which puts an operative price target between 1198 and 1208. That also happens to be the 78.6% retracement level between the mid-June lows and late-July highs. Markets can stay in overbought/oversold territory for extended periods of time, so if data disappoints this week, we may see the head-and-shoulders reach its price target. However, a positive reception to fundamental data this week may serve as a launching pad for soybeans to start moving higher.
Check out CME Group real-time data plans available on TradingView here: www.tradingview.com
Disclaimers:
CME Real-time Market Data help identify trading set-ups and express my market views. If you have futures in your trading portfolio, you can check out on CME Group data plans available that suit your trading needs www.tradingview.com
*Trade ideas cited above are for illustration only, as an integral part of a case study to demonstrate the fundamental concepts in risk management under the market scenarios being discussed. They shall not be construed as investment recommendations or advice. Nor are they used to promote any specific products, or services.
Futures trading involves substantial risk of loss and may not be suitable for all investors. Trading advice is based on information taken from trade and statistical services and other sources Blue Line Futures, LLC believes are reliable. We do not guarantee that such information is accurate or complete and it should not be relied upon as such. Trading advice reflects our good faith judgment at a specific time and is subject to change without notice. There is no guarantee that the advice we give will result in profitable trades. All trading decisions will be made by the account holder. Past performance is not necessarily indicative of future results.

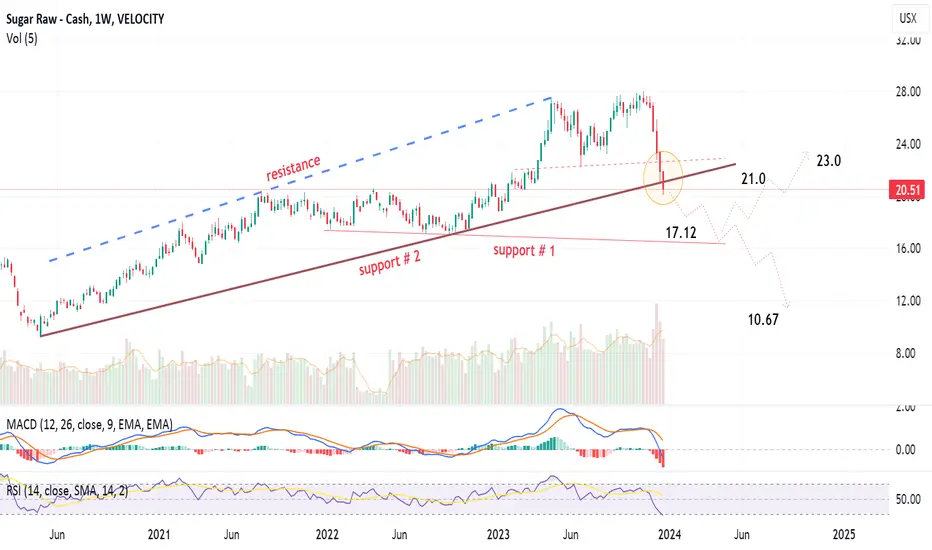
Time for SUGAR (commodity) international prices to cool down?Weekly chart, SUGAR commodity has broken down support line # 2, and is heading towards #1 at around 17.12
Below that, the next target price will be 10.67
Another scenario is to rebound from Support # 1 towards 21 then 23
MACD indicator went negative, while RSI is getting into the buy area
Soybean Futures almost formed a bullish pattern; 1550 then 1770Weekly chart, Soybean Futures almost formed a bullish chart pattern - Descending Wedge.
After crossing resistance 2 line and line 1, the target will be 1550 then 1770
The other side probability is activated by breaking down support line 1.
However, support line 2 can be a strong barrier and force a price rebounding.

Will the Wheat futures (CBOT) form a Bullish pattern?Wheat futures (CBOT) is rebounding from the support level, and it seam a bullish pattern is being formed - Cup and Handle!
After complete formation of chart pattern, the target will be 760 US cent/bushel (23.4% increase from current level)
Indicator RSI is positive
