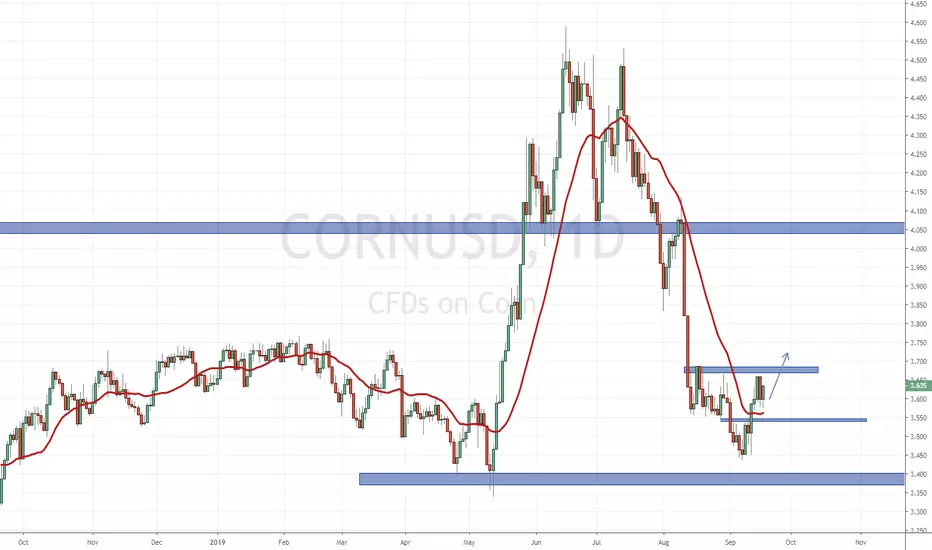
Corn can Test Resistance Levels
Hello friends, especially in the Agricultural Commodity Market :
Corn and Soybeans had been trading discounted for a long time.
I shared my prediction earlier because the Soybeans exceeded intermediate resistance.
That analysis continues (On related ideas)
Now it's time for Corn.
Because Corn just broke up its minor resistance,
under the influence of the buy signal.
When we look at the relevant Terminals
14 Weeks Period :
Autonomous LSTM Adaptive Period :
We can observe that it is being discounted.
It contains a very nice Risk / Reward Ratio.
So it can be tried with a low amount of position.
The parameters I recommend for this analysis:
Risk/Reward Ratio : 1/2.99
Position Size : % 1
Stop-Loss : 3.622
Goal : 4.435
Let us not go into heavy positions, if an otherwise sudden development occurs, we keep our lead when the conditions improve.
Regards.
Agriculture

Soybeans : Over Minor ResistancePrices of Soybeans are seen to be above the minor resistance. (9.118)
Although it may contain a slightly lower risk / reward ratio, it may be more profitable in low time-frame periods.
Those traders who want to be more safe can enter after a period of 1-2 weeks if prices below the resistance status is clear.
Furthermore, the highest basis of this analysis is the idea that both sides will make concessions in the trade wars between the US and China (My personal opinion).
Parameters :
Position Size : %1
Risk / Reward Ratio : 2.11
Stop-Loss : 8.75
Target : 10.256

Food prices to keep getting cheaper [+Photosynthesis tuto]Seems like an easy prediction.
With rising levels of CO2 agri prices will keep going down.
And I guess interest in soft commodity futures will keep going down.
Especially noobs, they could not care less, they want to chase the next high tech big thing that will make them rich, er typo I mean that will make them lose their shirt. Statistically they are better off playing lottery or going to the casino.
Until we run out of fertilizers (At current consumption levels, we will run out of known phosphorus reserves in around 80 years, but consumption will not stay at current levels). Unless we replace those by a new type of fertilizer OR find more phosphorus. Brace yourselves for yet a new mass hysteria clownery "the world will end soon because we will run out of phosphorus".
Remember "we will run out of water" "world will get overpopulated" "co2 will cause mass extinctions" "acid rains will destroy everything" and so on.
I think fertilizers support half of the planet population, this means they double yields.
And CO2 increased yields by something like 20% I think.
I can 100% guarentee without a single doubt there will be a "science settled very serious" mass hysteria fear about fertilizers (P) levels getting low in the future lmao.
This is what plants need:
Plants also need magnesium and sulfur. Not sure what else.
I think they can synthesize all vitamins from C H O N but I really don't know for sure. I just know those are the typical atoms in vitamins.
Expressed in dollars, the monetary benefit:
www.co2science.org
An extract:
I think that to produce 1kg of grain something like 100 liters of water is required.
Just because that's how it has been for centuries does not mean it is "normal".
If one is actually able to think out of his little box and little dogmas, he would realize agriculture uses huge amounts of water, and also, many plants (C4 type - not to be mistaken with the explosives) have even evolved to be more water efficient and to survive with very little CO2. I think also when you measure the CO2 around crops during the day you notice they sucked it all up (concentration is down a big amount maybe 50%).
So anyway, as CO2 goes up, plants will use less water (or use the same amount to grow bigger).
There is going to be possibly new plants evolve, the old world plants will make a comeback, and alot more but I'll save this for another idea.
The CO2 famine is over for plants they're going to take over.
Here is corn & sugar:
I don't know how agr companies work...
Better productivity means they get more productive? But prices drop so they make less?
They probably are undervalued right? At least compared to high tech for sure.
Of course this is all cancelled if primitive monkeys of abysmal stupidity remove CO2 from our atmosphere "to save the planet".

Lean Hogs: Ranged 2-month plan. Leans Hogs is on a strong rejection this first few session of 2020, after the top on the 72.100 1D Resistance. The price is currently testing the 1D MA50 (blue line) which has been acting as the pivot since October.
With the long term Higher Low trend line (since August 2018) providing Support, we are expecting a bounce on the 61.400 Symmetrical Support back towards the 1D Resistance. 2 way opportunities exist within this range. Make the most out of it.
** If you like our free content follow our profile (www.tradingview.com) to get more daily ideas. **
Comments and likes are greatly appreciated.

Hard Red Winter Wheat: Sell Opportunity on the 1W Resistance.The price is testing the 499'4 1W Resistance after a prolonged rise since the rebound on the 380'4 1W Support. We've made a Double Top on the 1D chart which remains bullish (RSI = 65.798, MACD = 12.030, ADX = 55.290, Highs/Lows = 2.8750). However MACD is forming a top on a bearish reversal pattern. We are expecting a strong rejection after that Double Top and our Target Zone is 393'2 - 380'4.
** If you like our free content follow our profile (www.tradingview.com) to get more daily ideas. **
Comments and likes are greatly appreciated.

COCOA: On a multi month Higher High. How to trade it.Cocoa has been trading on a multi-year Channel Up since May 2017 with the 1D chart trading near the overbought territory (RSI = 70.555, MACD = 51.220, Highs/Lows = 144.4643).
If the Channel stays intact then the price should pull back towards the 1D MA200 for a Higher Low near 2,365. If however it breaks as it did in March 2018 then it can easily reach 2,940 which is the 2 year high. We have identified 2,700 as this break out point. You may trade accordingly with a tight SL.
** If you like our free content follow our profile (www.tradingview.com) to get more daily ideas. **
Comments and likes are greatly appreciated.


Corn: Short opportunity on 1D Death Cross and RSI.Corn has been consolidating recently following the 402 peak on 1D (RSI = 54.610, STOCH = 53.472, MACD = 0.760, ADX = 18.642) after the September Death Cross. A similar candle sequence took place in August 2018, when after a 1D Death Cross (MA50 under MA200) and a market Top, the price made a new Low (Higher Low on 1W).
Since the RSI is on the same zone as then, we are expecting a decline towards 368'2 - 360'2.
** If you like our free content follow our profile (www.tradingview.com) to get more daily ideas. **
Comments and likes are greatly appreciated.

SOYBNUSB Long and ShortLooking at the long term chart, soybeans are poised to make an aggressive move to the upside. However, this can happen in two flavours: a failure at the 9.224ish level followed by a correction and an extension of the building divergences, or, a break past that level followed by more upside. If the price hits the aforementioned price target and stalls out or piddles across on low volume / weak price momentum, then it would be wise to go short. At that point, soybeans will likely retest the 8.061 level and power on up from there. The other scenario is that soybeans cross above on a decisive move and continue further. There may be a pull back and retest of the wedge's current resistance but either opportunity will provide an objective long entry. For this trade, SOYB will be the vehicle of choice.

FMC BUYBUY signal at 79.92$.
Timeframe - 1 week.
FMC Corporation is a diversified chemical company serving agricultural, consumer and industrial markets. The Company operates in three business segments: FMC Agricultural Solutions, FMC Health and Nutrition, and FMC Lithium.
If you want to see more history of this strategy, I able to show you if you request me.
__________________________________________________________________________
You can use the signals independently or like indicator of trends together with other indicators in your trading strategy.
Know that the success of your strategy that based on those signals depends from your money management and the additional conditions that you make in these strategies.
You use these signals inside your strategies at your own risk.
The chart shows the last trades on the product + the last signal.
I have several strategies for different products, and I want to show you proof of it works on history, and you will be able to see it, when returns to that profile.
Therefore, subscribe and watch for that profile.
The signals rare but useful.

CORNUSD : LONGThe support and resistance levels are pivot bands and adaptive. Updates will be made about the idea.
You can use supports for profit realization and resistances for stoploss according to your leverage and risk .
NOTE: My ideas made only as a result of some predictions, do not agree completely. Just consider it as an idea between your opinions.

GROW LongBroke out of descending wedge today, daily stochastic and RSI crossed out of oversold. Nice rebound from support in low 0.20s. Weekly candle looks like trend reversal, very few shares for sale and bids stacking up. Next few weeks should be good!
Hopefully see 0.40 again soon. Health Canada clarification October 17th for use on cannabis and new contracts being signed in the near future!

Feeder Cattle: Strong Buy Signal on potential Golden Cross.Feeder Cattle is coming off a strong Higher Low rebound early this month with 1D already on strong bullish technical action (RSI = 60.454, MACD = 0.850, Highs/Lows = 3.0514). Since this bullish sequence started on a strong August rebound on the 128.800 1W Support, it is more likely to see an extension towards the 161.000 1W Resistance.
A potential 1D Golden Cross formation in October should come as validation of this just as it has done twice already since 2017. We are long on GF with 155.000 - 161.000 as our Target Zone.
** If you like our free content follow our profile (www.tradingview.com) to get more daily ideas. **
Comments and likes are greatly appreciated.

Hard Red Winter Wheat: Medium term Sideways Signal.Hard Red Winter Wheat is trading within a Descending Triangle on 1M (RSI = 40.777, MACD = -11.870, Highs/Lows = -63.0357). This month has rebounded on the 382 1W Support marking the 3rd time it bounced on that level since May, practically making a technical Triple Bottom.
As seen on the chart it appears to be replicating the July 2018 - January 2019 pattern, when then price after a Lower High within the 1M Descending Triangle, it declined and consolidated before eventually making the bottom on the 382 1W Support.
As a result we have calculated a trading range within 382 - 417 that may last until late November. This can be a very profitable medium term scalp opportunity.
** If you like our free content follow our profile (www.tradingview.com) to get more daily ideas. **
Comments and likes are greatly appreciated.

Live Cattle: Strong long term Buy Opportunity.Live Cattle has hit this month the 94.300 1M Support, with the last time we saw these levels being in October 2016. The price appears to be trading within a long term Rectangle within 94.300 and the 130.500 - 134.525 Resistance Zone. The current 3 week rebound on the 1M Support makes LE an automatic long term buy opportunity. We are therefore long at the moment and having calculated all possible scenarios within this Rectangle, we concluded that profit should be taken within 116.500 - 127.500. Take advantage of this opportunity based on your won risk tolerance levels.
** If you like our free content follow our profile (www.tradingview.com) to get more daily ideas. **
Comments and likes are greatly appreciated.

Sugar: Buy Opportunity with an end-of-year horizon.Sugar has been trading within a 1M Channel Down for almost 1 full year (RSI = 40.519, MACD = -0.770, Highs/Lows = -0.1543). It is close to pricing a Lower Low, turning the current levels into a buy opportunity. Our Target Zone is 11.65 - 11.90.
** If you like our free content follow our profile (www.tradingview.com) to get more daily ideas. **
Comments and likes are greatly appreciated.

Corn to make a Head and Shoulders Pattern? Bullish Agriculture!I have been trading the agricultural commodities much more lately. On a long term approach (investing) I am bullish agricultural because I see food supplies diminishing due to weather. Just this Spring and Summer, crop yields did not produce as much as before and according to information on Martin Armstrong's blog, farmers planted crops late in the East due to a lingering winter. I expect these weather uncertainties to keep occurring.
Soil in the west is also diminishing. This can easily be remedied through things such as Zinc and other things like phosphate etc but don't want to get too scientific here.
What this means is that in the future we will likely transition to indoor/greenhouse farming.
Another bullish aspect is China. If you follow my work, I have said the only reason China would come to make a trade deal/truce is if their credit problem worsens, and if their food issue worsens. China has been hit hard with the swine flu and the army virus and the government is subsidizing food prices, especially pork. This could be a more short term/intermediate term catalyst.
Onto the charts. A good confluence for Corn. We hit a major support/flip zone at around the 3.45 zone.
You can see the downtrend with its lower highs and lower lows. They are well defined. Remember, by definition once a lower high swing is broken and we stop making new lower lows, the downtrend is now nullified. We either range or begin an uptrend.
We can see the lower high swing at 3.60 was broken and also retested. Buyers are coming on here.
On the daily we are now awaiting our first HIGHER LOW swing in a possible new uptrend which we could have here. This would make a head and shoulders pattern and the confirmed higher low swing once we break above the neckline at the 3.70 zone.
Overall this is looking good. We could see a move up to the 4.00 level.
Soybeans Fake out?Like what I am seeing here on Soybeans. We have a fake out indicated by the long wick at a very big support zone which can also be seen on the longer term charts.
This interests me because of the long downtrend with multiple waves we have been in. You can also say we have created a double top too. Waiting for a break of the lower high swing and also a flip zone at 8.51. Will provide more context and confluence for out trade.
Many will be inclined to stay away due to the US-China trade war. However, China NEEDS food. They have had their pig population decimated due to the flu and the government is subsidizing pork prices. They do have a food problem and even though tariffs may be implemented, China requires food. Brazil and Russia may be the agricultural winners here.

Wait...I didn't have any CORN!Corn on the 4 hour chart looking interesting. A potential head and shoulders can occur. We have a left shoulder and we also have a head. Potentially making a right shoulder here.
Other confluences to increase our probabilities is the fact that the reversal is occurring at a support/flip zone at the 3.56 zone. Keep an eye on this. I don't trade agricultural commodities much, but I recently added corn, soybeans and wheat to my trading list.
Let us await for the right shoulder and higher low confirmation with a break above 3.70.

Wheat to rally to 600?Wheat found a bottom and has been trending up, If it could get past the report on monday or better yet rally on it, we could safely call a significant bottom in place. If you're not long from lower, it's probably better to stay on the sidelines until after Monday's report

Corn bottomed?Corn bounced right off the range I mentioned on my last idea, Aggressive traders might go long here but it's probably best to wait for MACD signal and further strength. Seasonally corn is Not bullish at this time of the year, so it's best to be careful with longs
**If you're interested in joining a group of like-minded traders, send me a PM. This is NOT a subscription service, just bunch of average traders sharing insights in a FREE group

Coffee: Boom. Roasted!This is an excerpt from the Parallax Weekly premium report originally published July 15, 2019.
"The net-positioning in coffee has surged, and the percentile metric is not suggesting it’s extremely overdone even though the one-year z-score is well above 2.
The problem now is that coffee prices have declined from $116 to $106 with net-longs still in charge. There is uncertainty surrounding frost that effected the Brazilian crop. Contingent on crop damage estimates, record production expectations into 2020 and price/net-positioning divergences, the bearish case for coffee @ 96 is created."

GROW Double BottomDowntrend over last few weeks may be over as todays bullish engulfing shows signs of reversal. Watch for break of 0.35 to confirm bull break from falling wedge. Close above 0.35 would also be a hammer on the weekly chart. Good buy right now with strong support at 0.30, price target at recent tops of 0.51, potentially higher with any good news releases.
Upcoming catalysts include new contract signings, approval for use of technology on cannabis and more agro-industrial partnerships.
