$IREN Killing It. More Upside?NASDAQ:IREN has poked above the true all time high range (Launch price dump excluded) in a high degree Elliot wave 3
Long term target remains the R5 weekly pivot at $40 but may over extend with a bullish Bitcoin and Macro economic tailwind, coupled with AI growth.
Many thought this was a greedy target at $5 but now that price is $16 it doesn't look so bad. You have to know when to let the runners run, that is were the big bucks are trading!
Any retracement of a decent degree should expect to find support at the weekly pivot $9.4 before continuing upwards and may present an excellent buying opportunity! I will be posting the signal levels on Substack.
As always ,all time high range will be the next support if price continues upwards from here.
Safe trading
AI

SMCI Long Swing Setup – Positioned for AI-Driven Infrastructure Super Micro Computer, Inc. NASDAQ:SMCI is a critical player in the AI infrastructure boom, supplying high-performance servers to NVIDIA, AMD, and major data centers. With accelerating demand for compute power, SMCI is well-positioned for continued upside.
📌 Trade Setup:
• Entry Zone: Current market price or $40 – $43 support zone
• Take Profit Targets:
o 🥇 $70
o 🥈 $100
o 🥉 $120
• Stop Loss: Weekly close below $30

Rockwell Automation | ROK | Long at $268.96Rockwell Automation NYSE:ROK appears to be gaining upward momentum once again. With two price gaps above (highest near $333+) and the historical simple moving average lines showing a positive change, this company could be poised to fill the gaps soon. A strong billion-dollar company with rising revenue, but stay cautious of the slightly high debt, insider selling, and changing economy / tariff implications.
At $268.96, NYSE:ROK is in a personal buy-zone.
Targets:
$300.00
$333.00

INTC getting ready to start it's upward trajectoryINTC has been ranging and coiling since July of 2024. It finally, is starting to look like bullish movement is about to break upwards.
As you can see, INTC has just broken the downward trend line as well as the triangle pattern. A break and hold above $24.40 would indicate the start of a new uptrend in the chart.
Indications that the stock is gaining bullish momentum on the weekly chart:
The Williams %R is approaching and getting ready to break the 50 line.
The MACD is bullish and approaching the zero line.
The stock has bounced off of the volume shelf on the AVP 4 times and is now breaking out of technical patterns.
Money flow on market cipher B has crossed over green.
EMA's are starting to turn upward to flip bullish.
The marked move on this triangle pattern is approximately $40.
From a fundamental standpoint, Intel is trying to fix the business on two tracks at one time:
1)Near-term – ship competitive AI-centric products now (CPUs, GPUs, Gaudi accelerators) to put revenue and margins back on a growth path.
2) Long-term – reinvent itself as a contract chip-maker (Intel Foundry) so it can win outside customers and leverage its huge fab investments.
Think of it as “sell more chips today, sell more manufacturing tomorrow.”
Let's see Intel can build enough momentum to break this range for the bigger move up. The table is set from a technical standpoint.
Not financial advice. Do your own research.

$HUT Macro Chart Preparing for Breakout?NASDAQ:HUT looks poised for a strong breakout with a wave 3 long term target of $58 and a short term resistances of $21 and $33
HUT is moving strong almost up 100% from the recent swing low, overcoming its weekly 200EMA with ease. A test of the 200EMA as support is likely before continuation.
Price is consolidating under major resistance High Volume Node (HVN) and the weekly pivot point. Consolidation under resistance often leads to a breakout.
A series of 1-2s appears to be taking place on the Elliot Wave count finding support at the 'BTC-Miners golden pocket' of 78.6 Fibonacci retracement.
Analysis is invalidated below $10.10
Safe trading

$5 to $32 vertical over 500% $CYN🔥 $5 to $32 vertical over 500% since market open NASDAQ:CYN on news mentioning NASDAQ:NVDA

#RLCUSDT #1D (Binance Futures) Descending wedge on supportiExec RLC just printed a dragonfly doji which may have marked the bottom on daily.
A morning star is drawing now, recovery towards 100EMA resistance seems around the corner.
⚡️⚡️ #RLC/USDT ⚡️⚡️
Exchanges: Binance Futures
Signal Type: Regular (Long)
Leverage: Isolated (4.0X)
Amount: 5.9%
Current Price:
0.9126
Entry Targets:
1) 0.9002
Take-Profit Targets:
1) 1.1854
Stop Targets:
1) 0.7859
Published By: @Zblaba
GETTEX:RLC BINANCE:RLCUSDT.P #DePIN #AI #iExec iex.ec
Risk/Reward= 1:2.5
Expected Profit= +126.7%
Possible Loss= -50.8%
Estimated Gaintime= 1 month

SOARING 20's are you ready for the Blowoff of the century#SPX v Currency in circulation
#Cup&Handle
1929 Echo bubble
AI will increase earnings and GDP
as ASI enters the workplace and Robotics grow us out of Debt
GDP = Number of people * Productivity
Now add an autonomous workforce to this.

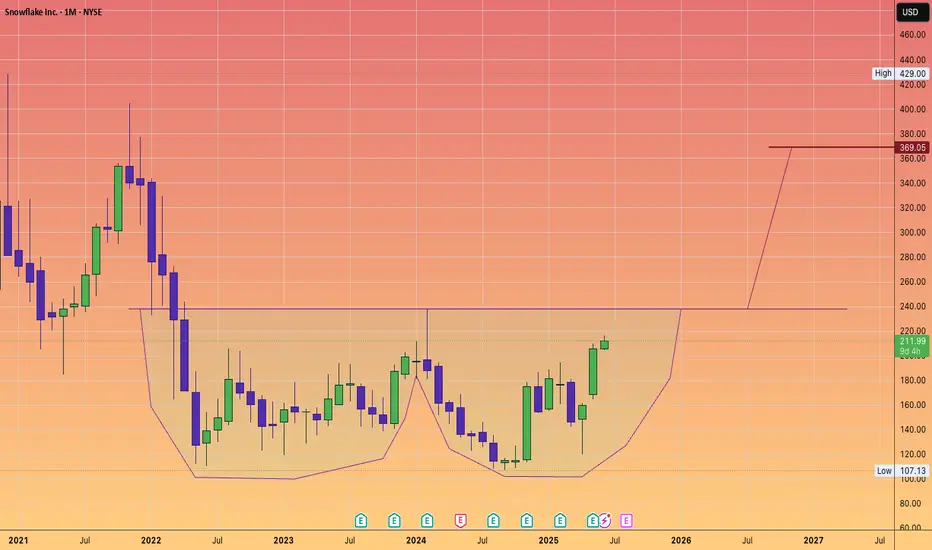
SNOWFLAKE to $369Snowflake Inc. is an American cloud-based data storage company.
Headquartered in Bozeman, Montana, it operates a platform that allows for data analysis and simultaneous access of data sets with minimal latency. It operates on Amazon Web Services, Microsoft Azure, and Google Cloud Platform.
As of November 2024, the company had 10,618 customers, including more than 800 members of the Forbes Global 2000, and processed 4.2 billion daily queries across its platform
#DoubleBottom
#Wformation
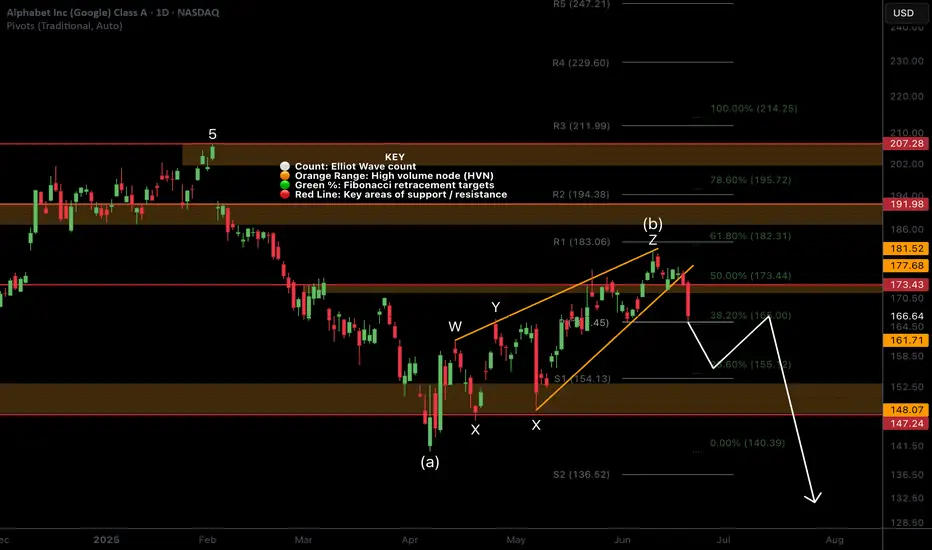
Google MUST hold this critical level!NASDAQ:GOOG local analysis update
📈 𝙇𝙤𝙣𝙜 𝙩𝙚𝙧𝙢 Further decline below the daily 200EMA, High Volume Node (HVN) and pivot point which it closed below on Friday could see google price fall back below $140.
📉 𝙎𝙝𝙤𝙧𝙩 𝙩𝙚𝙧𝙢 the bullish run has ended with Fridays bearish engulfing, first support below the support it is currently sat at is $156.
Irans conflict has investors shaken and not willing to hold assets over the weekend on the fear of worse news. However, if the conflict is resolved investors could have a great buying opportunity.
𝙏𝙚𝙘𝙝𝙣𝙞𝙘𝙖𝙡 𝘼𝙣𝙖𝙡𝙮𝙨𝙞𝙨
Price is challenging a triple shield: major support HVN, daily pivot and the daily 200EMA. Holding this level is critical and locks in a corrective Elliot Wave pattern from the $140 level completing between the 0.5-0.618 Fib retracement.
Daily DEMA Is about to produce a death cross while RSI is neutral with plenty of room to fall.
Safe trading
PATH ready to advance to 14.9-15$ this summer!Order flow indicating strong buy sequence to 14.9-15$ range is imminent. Still expecting additional volatility this summer before price advances to 18$ primary buy-side target later this yr.
Holding call options for Aug and Sept expiration

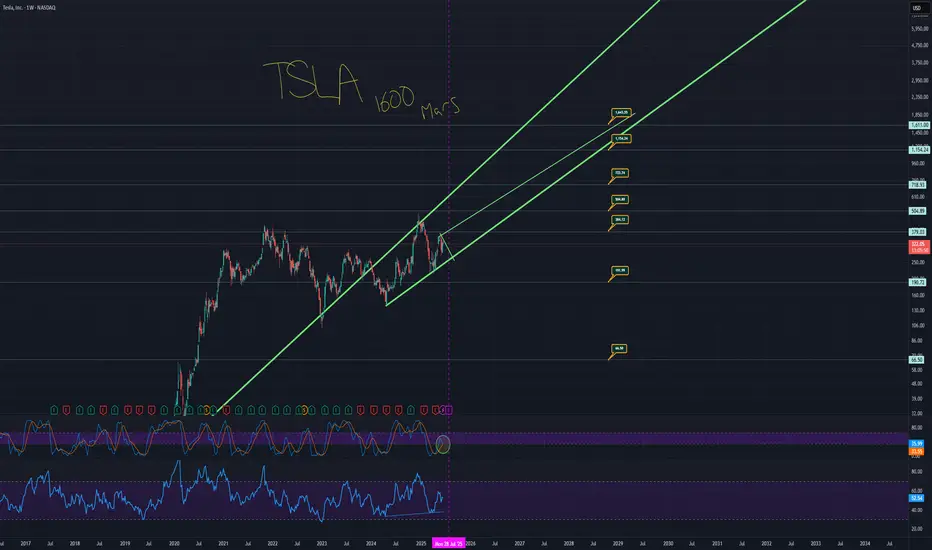
TSLA TO 1600, YOU SAW IT HERE FIRSTHere's the TA that takes Tesla legitimately to 1600.
The monthly chart has a trend that is currently acting as support.
The price has fallen under that trend.
Price action is also over a massive support trend from the weekly chart.
These are the two thickest green trends.
When you zoom back and look at TSLA as a whole, you see the bigger picture.
You have a situation where the low side takes you to around $60 to 70 dollars with a low of around $48. And then you have the high side taking you to around 1600. It sounds like a candidate for a stock reverse split.
Essentially, don't miss out on this potential solar data fast car thingy ready to really zoom.
Here is the chart with the auto fib numbers showing potential targets.
Remember, this likely doesn't occur all in one night, but the projection is really looking like it takes off from earnings. Projection line in yellow.
You have an opportunity where short term trends go to a strong long term trend which climbs to a support trend meaning price can literally take off from multiple of these trends meaning, we can price action go from 420 down to 250 and back up to 1600 in less than a year total.
Micron Technology (MU) – Powering the AI Memory SupercycleCompany Overview:
Micron NASDAQ:MU is a crucial player in the AI infrastructure stack, providing advanced DRAM, NAND, and NOR flash memory solutions that fuel everything from data centers to mobile edge devices.
Key Catalysts:
AI-Driven Memory Demand ⚙️
High-Bandwidth Memory (HBM) adopted in AI accelerators from Nvidia, AMD, Broadcom, and Marvell.
Positions Micron at the core of the AI supply chain, reducing exposure to chip cycle volatility.
Data Center Surge 📈
Data center DRAM revenue tripled YoY in Q2 2025, driven by hyperscaler AI infrastructure upgrades.
Strengthens revenue diversification and margin profile.
Technology Leadership 🔬
Launch of 1-gamma DRAM node and LPDDR5X samples enhances mobile, cloud, and auto capabilities.
Keeps Micron on the cutting edge of memory innovation.
Investment Outlook:
Bullish Case: We remain bullish on MU above $95.00–$97.00.
Upside Target: $155.00–$160.00, supported by AI compute growth, hyperscale momentum, and next-gen product launches.
💡 Micron is not just riding the AI wave—it’s building its memory core.
#Micron #MU #Semiconductors #AI #HBM #DataCenter #DRAM #NAND #Nvidia #AMD #Hyperscalers #TechLeadership

Another leg lower before altseason ?Freysa AI is a project focused on artificial intelligence, specifically leveraging decentralized networks and blockchain technology.

Is Digital LiDAR the Eye of Autonomy's Future?Ouster, Inc. (NYSE: OUST), a key player in the small-cap technology landscape, recently experienced a significant boost in its share price following a crucial endorsement from the United States Department of Defense (DoD). This approval of Ouster's OS1 digital LiDAR sensor for unmanned aerial systems (UAS) validates the company's technology. It highlights the growing importance of advanced 3D vision solutions in both defense and commercial sectors. Ouster positions itself as a foundational enabler of autonomy, with its digital LiDAR distinguishing itself through enhanced affordability, reliability, and resolution compared to traditional analog systems.
The DoD's inclusion of the OS1 sensor within its Blue UAS Framework represents a strategic victory for Ouster. This rigorous vetting process ensures supply chain integrity and operational suitability, making the OS1 the first high-resolution 3D LiDAR sensor to receive such an endorsement. This approval significantly streamlines procurement for various DoD entities, promising expanded adoption beyond Ouster's existing defense engagements. The OS1's superior performance in weight, power efficiency, and rugged conditions further underscores its value in demanding applications.
Looking ahead, Ouster actively develops its next-generation Digital Flash (DF) Series, a solid-state LiDAR solution poised to revolutionize automotive and industrial applications. By eliminating moving parts, the DF series promises enhanced reliability, longevity, and cost-efficient mass production, addressing critical needs for autonomous driving and advanced driver-assistance systems (ADAS). This forward-looking innovation, combined with the recent DoD validation, firmly establishes Ouster as a pivotal innovator in the rapidly evolving landscape of autonomous technologies, driving its ambition to capture a substantial share of the $70 billion total addressable market for 3D vision.

A BULLISH SNAPCHAT ANALYSIS SNAPCHAT has a neat chart setup long term. Here is a bullish look. I use a metric called NJT which analyzes total user hours available.
From a technical standpoint, there are gaps up to $70, and it could soar much higher. Think longer term investment, with short term jump potential.
Here is my summarized view with a little help from Grok (X).
"Overview of Snap Inc.'s Assets and Valuation
Snap Inc., the parent company of Snapchat, is a publicly traded technology company listed on the NYSE under the ticker SNAP. Founded in 2011 by Evan Spiegel, Bobby Murphy, and Reggie Brown, it focuses on multimedia messaging, augmented reality (AR), and related products. Below, I outline Snap Inc.'s key assets, estimate their valuation based on available data, and apply the NJT (Net Joint Time) metric to contextualize its user engagement in the competitive landscape of 2025-2026. The NJT metric, defined as monthly active users (MAUs) × average time spent per user per month, is used to assess user hours, with the global pool estimated at 285.6 billion user hours per month (9.52 billion hours/day × 30 days).
Key Assets of Snap Inc.
Snap Inc. owns several products and services, with Snapchat being the flagship. Here’s a breakdown of its primary assets as of June 2025:
Snapchat (Core Multimedia Messaging App)
Description: Snapchat is a visual messaging app allowing users to send ephemeral photos and videos, with features like Stories, Snap Map, Discover, and AR Lenses. It generates most of Snap’s revenue through advertising, particularly AR ads and Snap Ads.
User Metrics: Approximately 900 million MAUs and 453 million daily active users (DAUs) as of Q4 2024, with users spending an estimated 30 minutes daily (15 hours/month).
NJT Calculation:
MAUs: 900 million
Average time spent: 15 hours/month
NJT = 900 million × 15 = 13.5 billion user hours/month
Valuation Estimate: Snapchat accounts for ~98% of Snap’s revenue ($5.26 billion of $5.36 billion in 2024). Assuming the company’s current market cap of $14.18 billion (June 2025) is primarily driven by Snapchat, we allocate ~98% of the market cap to this asset:
Value: $13.9 billion
Spectacles (AR Smart Glasses)
Description: Wearable sunglasses that capture Snaps and integrate with Snapchat, featuring GPS-powered AR lenses and hand-tracking capabilities. Launched in 2016, Spectacles have not gained widespread popularity but remain part of Snap’s AR vision.
User Metrics: Limited user data; estimated <1 million users with minimal time spent (assumed 1 hour/month for valuation purposes).
NJT Calculation:
MAUs: ~1 million (conservative estimate)
Average time spent: 1 hour/month
NJT = 1 million × 1 = 1 million user hours/month
Valuation Estimate: Spectacles contribute ~2% of revenue ($100 million in 2024). Using the same revenue-to-market-cap ratio as Snapchat, we estimate:
Value: $0.28 billion ($280 million)
Bitmoji (Personalized Avatar Platform)
Description: Acquired in 2016 for ~$64 million, Bitmoji allows users to create personalized avatars integrated into Snapchat and other platforms. It enhances user engagement but is not a direct revenue driver.
User Metrics: Assumed to align with Snapchat’s user base (900 million MAUs) but with lower engagement (estimated 2 hours/month).
NJT Calculation:
MAUs: 900 million
Average time spent: 2 hours/month
NJT = 900 million × 2 = 1.8 billion user hours/month
Valuation Estimate: As a feature enhancing Snapchat’s ecosystem, we estimate its value based on acquisition cost adjusted for inflation and integration (5% annual growth since 2016):
Value: ~$100 million
Snap Camera (Desktop Application)
Description: Launched in 2018, Snap Camera allows users to apply Snapchat filters during video calls on platforms like Zoom. It has niche usage, primarily for streaming and virtual meetings.
User Metrics: Limited data; estimated 10 million MAUs with 1 hour/month usage.
NJT Calculation:
MAUs: 10 million
Average time spent: 1 hour/month
NJT = 10 million × 1 = 10 million user hours/month
Valuation Estimate: Minimal direct revenue; valued as a brand enhancer at ~1% of Snapchat’s value:
Value: $140 million
Zenly (Location-Sharing App, Discontinued)
Description: Acquired in 2017 for an undisclosed amount (estimated $200-$300 million), Zenly was shut down in 2023, but its location-sharing features were integrated into Snap Map.
User Metrics: No independent users post-shutdown; value absorbed into Snapchat.
NJT Calculation: Not applicable (integrated into Snapchat’s NJT).
Valuation Estimate: Residual value in Snap Map enhancements, estimated at acquisition cost:
Value: ~$250 million
Other Assets (Content Partnerships, Snapchat+, R&D)
Description: Includes partnerships with NBCUniversal, Disney, and others for Snapchat Originals, the Snapchat+ subscription service (7 million subscribers in March 2024), and ongoing AR R&D. Snapchat-Az These contribute to revenue and engagement but are not separately quantified.
User Metrics: Snapchat+ has ~7 million users; other assets are part of Snapchat’s ecosystem.
NJT Calculation: Included in Snapchat’s NJT (13.5 billion hours/month).
Valuation Estimate: Snapchat+ and content partnerships generate ~$100 million annually (estimated); R&D is a cost center. Valued at ~2% of market cap:
Value: $280 million
Total NJT and Market Cap Projection
Total NJT:
Snapchat: 13.5 billion hours/month
Bitmoji: 1.8 billion hours/month
Snap Camera: 10 million hours/month
Spectacles: 1 million hours/month
Total: ~15.311 billion hours/month
Market Share: 15.311 ÷ 285.6 ≈ 5.36% of the global pool (285.6 billion hours/month).
Current Market Cap (June 2025): $14.18 billion
Projected Market Cap Using NJT: Assuming the total market cap of 45 companies (~$10 trillion) is distributed proportionally to NJT shares (as in prior conversations), Snap’s 5.36% share yields:
Projected Market Cap: $536 billion
Comparison: Significantly higher than the current $14.18 billion, suggesting Snap is undervalued based on user engagement.
Breakdown of Valuation by Asset
Asset
NJT (Billion Hours/Month)
Estimated Value ($B)
% of Total Value
Snapchat
13.5
13.9
98.0%
Spectacles
0.001
0.28
2.0%
Bitmoji
1.8
0.10
0.7%
Snap Camera
0.01
0.14
1.0%
Zenly (integrated)
-
0.25
1.8%
Other (Snapchat+, R&D)
-
0.28
2.0%
Total
15.311
14.18
100%
Key Insights
Snapchat Dominance: Snapchat accounts for 98% of Snap’s value and 88% of its NJT, driven by its 900 million MAUs and strong engagement among younger users.
Undervaluation: The projected market cap of $536 billion (based on NJT share) is significantly higher than the current $14.18 billion, suggesting Snap’s user engagement is not fully reflected in its stock price, possibly due to ongoing losses ($1.4 billion in 2022).
AR and Innovation: Investments in AR (Spectacles, Lenses) and Snapchat+ position Snap for growth in 2025-2026, particularly as AR advertising and immersive experiences gain traction.
Challenges: Competition from TikTok and Instagram Reels, privacy changes (e.g., Apple’s iOS updates), and macroeconomic swings in ad spending could limit growth.
Conclusion
Snap Inc.’s primary asset, Snapchat, drives its value and user engagement, with a projected market cap of $536 billion based on NJT, far exceeding its current $14.18 billion. This suggests significant undervaluation, driven by its strong user base and AR innovations, despite profitability challenges. Spectacles, Bitmoji, and other assets play smaller roles but enhance Snap’s ecosystem, positioning it as a top contender for 2025-2026.
Key Citations
Snap Inc. - Wikipedia
Who Owns Snapchat? - Famoid
Snapchat Revenue and Usage Statistics (2025) - Business of Apps
Snap (SNAP) - Market Capitalization - CompaniesMarketCap
Snapchat - Wikipedia
SNAP Intrinsic Valuation and Fundamental Analysis - Alpha Spread
Snap Inc. Announces Fourth Quarter and Full Year 2024 Financial Results - Snap Inc."
- GROK

NVIDIA Can Go PARABOLICMartyBoots here , I have been trading for 18 years and sharing my thoughts on NVIDIA here.
People are scared with war and high stock market but NVDA could go parabolic
Watch Video for more info

SWARMS can be a double digit crypto again.Low risk entry level --- if we assume the bull still has legs.

AI Chip Stocks NVDA and AMD Showing 5 Wave RiseNASDAQ:NVDA and NASDAQ:AMD are both showing 5 wave rise in weekly chart after a correction in WXY. I haven't checked but other AI related stocks also might be doing something similar.
Once the 5 waves are over, we can expect some correction but the 5-wave rise post a correction typically signals fresh uptrend so it might be worth keeping an eye on these stocks. Waiting till retracement/correction of this rise is complete.

$TEM - New ATH's Inbound! 50% UpsideNASDAQ:TEM - New ATH's Inbound! 🚀
Bull Flag Breakout = $84.17 🎯
74.20 Cup&Handle Breakout = $110 🎯
WCB forming 📈

TradeCityPro | ICP Approaches Key Resistance with Rising Volume👋 Welcome to TradeCity Pro
In this analysis, I want to review the ICP coin for you. The Internet Computer project operates in the fields of artificial intelligence and DePIN.
⭐ The coin of this project, with the symbol ICP, has a market cap of 3.25 billion dollars and ranks 32nd on CoinMarketCap.
📅 Daily Timeframe
As you can see in the daily timeframe, there is a descending trendline visible on the chart, which has been tested multiple times. The price has broken above it and is now sitting just below the 6.205 resistance level.
🔍 In recent candles, the volume has increased significantly, which raises the likelihood of a breakout above 6.205.
🔔 If the 6.205 level is broken, ICP's bullish trend could begin. In that case, the price could move toward the 7.423 and 9.887 levels.
📊 Entering a position with the breakout of 6.205 is supported by volume confirmation, and we will get RSI momentum confirmation if it enters the overbought zone.
📉 For the bearish scenario to play out, the price must first get rejected from 6.205, and then we’ll look for confirmation of a trend reversal with a break below 4.468.
🛒 You can also use this same 6.205 trigger for a spot buy, but keep in mind that Bitcoin dominance is still in an uptrend, so in my opinion, it’s not yet the right time to buy altcoins.
✔️ The best trigger for buying any altcoin is to wait for confirmation of a trend reversal in Bitcoin dominance. Once that’s confirmed, you can start buying the altcoins you’ve selected.
📝 Final Thoughts
This analysis reflects our opinions and is not financial advice.
Share your thoughts in the comments, and don’t forget to share this analysis with your friends! ❤️

Are The Markets Running Out Of Steam? SPY just cant seemed to hold above the 600 psychological level.
Are big players unloading into this positive market strength?
Are we due for a larger pullback?
There's a lot of mixed price action and we just cant seem to make a true breakout.
Some names are underperforming and other names are outperforming.
We remain tactically bullish while trimming keys positions into strength.
Being nimble in this market us key as were seeing large intra day swings.
Short term there is some risk of lower price so we have hedged in some individual names while still remaining bullish.

CUP AND HANDLE $TSLA TO $515 MINIMUMThe cup and handle is a bullish chart pattern commonly used by traders to spot potential buying opportunities. It features a rounded "cup" formation followed by a slight downward drift forming the "handle." This pattern typically signals a continuation of an upward trend once the handle completes its consolidation phase.
ROBOTAXI BOOM
BUY NOW NASDAQ:TSLL NASDAQ:TSLA
