MASA Ascending Triangle (1D) + Key LevelsBITGET:MASAUSDT is currently forming an ascending triangle on the daily chart, with horizontal resistance around $0.040 and rising support.
This structure typically leans bullish and suggests accumulation under resistance.
Structure & Zones
• Resistance: ~$0.040 (triangle top, within flipped demand → supply zone)
• Support: Rising diagonal since early May
• Demand: ~$0.013
• Main Supply: $0.06-$0.09 (High Volume Node, with $0.075 as a key S/R)
Breakout Target
A breakout with strong volume could trigger a measured move toward ~$0.060, aligning with the lower boundary of the High Volume Node (HVN) and the previous price cluster.
Context
The grey $0.06-$0.09 HVN has acted as a pivotal area — both as support and resistance — and could become the next key level if price breaks out.
Triggers
• A clean daily close above $0.040 with volume would be a strong bullish signal
• A breakdown below the ascending support would invalidate the pattern and likely lead to a retest of ~$0.013
AI

DOGE can be worth many DOLLAR'SGrok, the AI supercomputer interface on Elon Musk’s X platform, predicts that Dogecoin might hit $10 between 2029 and 2040.
While I remain hopeful, I believe that a more realistic target could be around 3-5 dollars by the end of this decade. This could potentially trigger a significant blowoff top, leading to an extended bear market for cryptocurrencies.
When you examine this chart, it’s hard not to appreciate its beauty, comparable to Bitcoin, as it showcases a well-defined uptrend and follows cyclical rises and falls. This has resulted in Dogecoin creating numerous millionaires. The pressing question is whether those investors who currently hold 250,000 coins will become the next wave of millionaires in just a few years?

C3.AI has bottomed and is targeting $39.00C3.ai (AI) has been trading within a Channel Down pattern since the June 16 2023 High and right now is testing its 1D MA50 (blue trend-line) as Support, following a bottom (Lower Lows) rebound on April 08 2025.
This is technically the start of its new Bullish Leg, even though based on May - August 2024, it may be delayed. On the long-term though, our Target will be the 0.786 Fibonacci retracement level at $39.00.
-------------------------------------------------------------------------------
** Please LIKE 👍, FOLLOW ✅, SHARE 🙌 and COMMENT ✍ if you enjoy this idea! Also share your ideas and charts in the comments section below! This is best way to keep it relevant, support us, keep the content here free and allow the idea to reach as many people as possible. **
-------------------------------------------------------------------------------
💸💸💸💸💸💸
👇 👇 👇 👇 👇 👇

#FETUSDT #4h (Bitget Futures) Falling wedge breakout and retestFetch just regained 100EMA support and looks good for bullish continuation from here.
⚡️⚡️ #FET/USDT ⚡️⚡️
Exchanges: Bitget Futures
Signal Type: Regular (Long)
Leverage: Isolated (4.0X)
Amount: 5.0%
Current Price:
0.7863
Entry Zone:
0.7806 - 0.7504
Take-Profit Targets:
1) 0.8561
1) 0.9244
1) 0.9926
Stop Targets:
1) 0.6897
Published By: @Zblaba
NYSE:FET BITGET:FETUSDT.P #4h #Fetch #AI fetch.ai
Risk/Reward= 1:1.2 | 1:2.1 | 1:3.0
Expected Profit= +47.3% | +83.0% | +118.7%
Possible Loss= -39.6%
Estimated Gaintime= 1-2 weeks

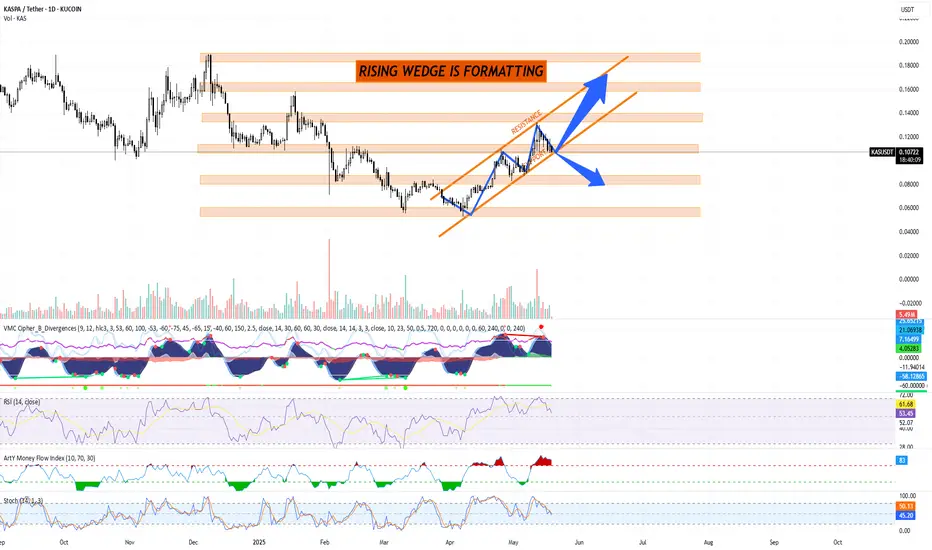
KASPA (KASUSDT) Technical Analysis, 1D Chart KUCOIN + trade planKASPA (KASUSDT) Technical Analysis — 1D Chart by Blaž Fabjan
Date: May 19, 2025
Exchange: KUCOIN
Pair: KAS/USDT
Chart Pattern: Rising Wedge (Bearish Reversal Signal)
A rising wedge is currently forming — characterized by converging trendlines sloping upward.
Support and Resistance levels are clearly outlined in the orange zones.
This pattern often signals a potential breakdown, but an upward breakout is possible with strong momentum.
Key Technical Indicators
1. Volume
Recent volume surge on uptrend suggests buying interest, but declining volume into the wedge tip hints at a possible exhaustion.
2. VMC Cipher B Divergences
Signs of bearish divergence forming; red dots and momentum wave flattening may signal weakening bullish strength.
3. RSI (14)
RSI at 53.27: In neutral territory. Slight bearish divergence observed from recent peaks. Watch for a move below 50 as a confirmation of bearish pressure.
4. Money Flow Index (MFI)
MFI at 83 (overbought zone): Indicates that buying pressure may soon fade, increasing the probability of a correction.
5. Stochastic RSI (14, 3, 3)
Stochastic RSI near 44–49 and crossing downward: Signaling a potential short-term correction.
Key Support & Resistance Zones
🟧 Resistance Levels:
$0.12 – $0.14 (current wedge resistance zone)
$0.16 – $0.18 (next target on bullish breakout)
$0.20+ (major resistance if trend continues)
🟧 Support Levels:
$0.10 (critical support)
$0.08 – $0.09 (wedge breakdown target)
$0.065 – $0.07 (strong demand zone)
Trading Plan for KASPA (KAS/USDT)
Bullish Scenario (Breakout Upwards)
Entry: Above $0.115 with strong volume confirmation
Targets:
TP1: $0.14
TP2: $0.165
TP3: $0.20
Stop-Loss: Below $0.10 (to invalidate wedge structure)
Bearish Scenario (Breakdown)
Entry: Below $0.10 (support break)
Targets:
TP1: $0.085
TP2: $0.072
TP3: $0.065
Stop-Loss: Above $0.11
Neutral/Range Strategy
If KAS trades between $0.10–$0.115 with low volume:
Avoid entry.
Wait for breakout or breakdown confirmation.
Risk Management
Risk/Reward Ratio: Minimum 2:1
Capital Allocation: Max 2–3% of portfolio per trade
Use limit orders to control entry points, especially due to high volatility in crypto markets.
The rising wedge pattern is often a precursor to downside in crypto.
However, macro bullish news, network upgrades, or volume surges may invalidate the bearish setup.
Traders should remain flexible and monitor volume, RSI, and support zones for any signs of reversal.
ALTCOIN BOOM FOR ALGORAND 2025-2026 PROPOSALAlgorand ( EURONEXT:ALGO ) is a layer-1 blockchain designed for speed, scalability, and sustainability. It uses Pure Proof of Stake (PPoS) to achieve fast, low-cost transactions while maintaining decentralization. Algorand’s niche is bridging TradFi and DeFi, with a focus on real-world assets (RWAs), CBDCs, and institutional adoption. Think of it as the “green Ethereum” with a compliance-friendly edge.
Recent News Launched “Algorand 2.0” with quantum-resistant cryptography and dynamic NFT standards. Secured a partnership with the IMF to pilot a cross-border CBDC project. EURONEXT:ALGO rallied 25% in July after months of stagnation, but still lags behind major layer-1 tokens.
Deep Dive Algorand’s quantum-resistant upgrade is a sleeper hit. While others focus on speed, ALGO is future-proofing against quantum hacks—a unique selling point for risk-averse institutions. The IMF partnership is HUGE, positioning Algorand as a potential CBDC backbone, but progress will be slow (TradFi moves at a glacial pace). Competitors like Hedera and Ripple are ahead in enterprise adoption, so ALGO needs to accelerate development.
Latest Tech or Utility Update
Update Details Algorand 2.0 introduced quantum-safe encryption, dynamic NFTs (updatable metadata), and “State Proofs” for trustless cross-chain interoperability.
Implications Quantum resistance is a long-term bet, but it’s a marketing win for institutional clients. Dynamic NFTs could revolutionize gaming and IP licensing. State Proofs allow Algorand to interact with chains like Bitcoin and Ethereum without bridges, reducing exploit risks. However, adoption depends on other chains integrating Algorand’s tech—a chicken-and-egg problem.
Biggest Partner & How Much Was Invested
Partnership Spotlight The International Monetary Fund (IMF) is testing Algorand for a multi-country CBDC network. No direct investment, but a 3-year technical collaboration.
Impact Analysis If the IMF pilot succeeds, Algorand could become the go-to chain for central banks. This would create significant demand for EURONEXT:ALGO as a settlement layer. However, CBDCs are politically charged—regulatory backlash could slow adoption.
Most Recent Added Partner & Details
New Collaboration Partnered with Circle to launch EURC and USDC natively on Algorand, enabling near-instant settlements. No funding disclosed, but revenue-sharing on stablecoin transactions.
Future Prospects EURC/USDC integration makes Algorand more attractive for DeFi and remittances. Short-term, this boosts liquidity; long-term, it could position ALGO as a Euro-on-ramp for institutions.
Tokenomics Update
Token Dynamics Fixed max supply of 10B EURONEXT:ALGO , with 7.3B already in circulation. Governance rewards slashed to 6% APY (from 8%) to reduce inflation. New burn mechanism: 0.1% of transaction fees destroyed monthly.
Deep Analysis The hard cap is bullish, but slow burn rates won’t offset inflation from vesting tokens. Lower governance APY might deter casual stakers, but it tightens supply. Algorand’s tokenomics still lack the deflationary firepower of ETH or BNB.
Overall Sentiment Analysis
Market Behavior Mixed bag: Retail remains cautious (social sentiment neutral), but whales are quietly accumulating. ALGO’s price is still 90% below its ATH, creating a “cheap layer-1” narrative.
Driving Forces CBDC hype and quantum-resistance FOMO. Critics argue Algorand’s marketing lags behind its tech, and ecosystem growth is too slow compared to Solana or Avalanche.
Deeper Insights Sentiment hinges on the IMF partnership delivering tangible progress. If the CBDC pilot stalls, ALGO could re-enter “zombie chain” territory.
Recent Popular Holders & Their Influence
Key Investors VanEck added EURONEXT:ALGO to its digital assets portfolio. Crypto whale "0x5a1D" bought 10M EURONEXT:ALGO in July, now a top 50 holder.
Why Follow Them? VanEck’s move signals institutional interest in Algorand’s CBDC potential. Whale “0x5a1D” has a history of accumulating undervalued layer-1s before rallies (e.g., bought DOT at $4 in 2023).
Summary & Final Verdict
Recap Algorand is a tech-first chain with strong partnerships (IMF, Circle) and cutting-edge upgrades (quantum resistance). However, its ecosystem growth lags, and tokenomics lack urgency.
Final Judgment EURONEXT:ALGO is a high-risk, high-patience play . It could 5x if CBDCs take off or quantum security becomes a priority, but institutional adoption takes time.
Considerations Can Algorand onboard enough devs to escape the “ghost chain” label? Will the IMF partnership lead to real CBDC deployments, or just research papers? How will ALGO’s inflation schedule impact price if adoption remains slow?
If you're bullish on CBDCs and quantum-resistant tech, accumulating under $0.20 could pay off long-term. If you prefer faster-moving projects, look elsewhere.

ALTCOIN BOOM FORCGPT (ChainGPT) 2025-2026 PROPOSALWhy This Asset?
Core Info: ChainGPT is an AI-driven blockchain project focused on democratizing access to AI tools for crypto users. Its offerings include AI-generated smart contracts, risk management analytics, and trading bots. Think of it as "ChatGPT for crypto" but with blockchain-specific utility.
Recent News:
Launched Beta version of AI NFT Generator, allowing users to mint NFTs via text prompts.
Partnered with OKX to integrate ChainGPT’s AI trading bot into the exchange’s interface.
CGPT listed on Bitget and MEXC, boosting liquidity and accessibility.
Deep Dive:
ChainGPT is tapping into two explosive trends:
AI x Crypto Narrative: Hype around AI tokens (FET, AGIX) has spilled into CGPT, which positions itself as a niche player for crypto-specific AI tools.
Retail Accessibility: Tools like no-code smart contracts and AI trading bots target newcomers overwhelmed by crypto’s complexity.
Latest Tech/Utility Update
Update: AI NFT Generator Beta launch + expanded staking pools with 25-30% APY.
Implications:
For Users: Simplifies NFT creation for non-technical users, competing with platforms like MidJourney but blockchain-native.
For Investors: High staking APY could attract short-term holders, but sustainability depends on actual product adoption.
Biggest Partner & Investment
Partner Spotlight: OKX (top-5 crypto exchange) integrated ChainGPT’s AI trading bot.
Deal: $1M investment over 12 months for exclusive early access to ChainGPT’s tools.
Impact: OKX’s 20M+ users gain exposure to CGPT, driving token demand. However, reliance on a single exchange partner poses concentration risk.
Most Recent Added Partner
New Collab: DexCheck (on-chain analytics platform) partnered to leverage ChainGPT’s AI for market insights.
Deal: $250k investment over 6 months.
Future Prospects: DexCheck’s user base (mostly degens and traders) aligns with CGPT’s target audience, but the partnership is small-scale. Needs more enterprise deals to justify valuation.
Tokenomics Update
Changes:
Total supply capped at 1B tokens, with 20% burned in Q2 2024.
Staking APY raised to 25-30% to incentivize holding.
Analysis: Burns reduce sell pressure, but ultra-high staking yields risk hyperinflation if demand doesn’t match token minting. Only 15% of supply is circulating, meaning massive unlocks could crash the price.
Overall Sentiment Analysis
Market Behavior: Mixed. CGPT surged 80% post-OKX news but corrected 20% this week. Retail traders are flipping the token, while whales accumulate.
Driving Forces:
Bullish: AI hype + OKX partnership FOMO.
Bearish: Concerns about product viability vs. competitors like Fetch.ai.
Insight: Sentiment is speculative. CGPT’s price action mirrors memecoins more than AI blue chips, suggesting it’s riding the narrative, not fundamentals.
Recent Popular Holders & Their Influence
Key Investors:
CryptoGodJohn (YouTube influencer) shilled CGPT to 500k followers, triggering a 30% pump.
TraderSZ (notorious altcoin flipper) bought $150k of CGPT last week.
Why Follow Them: Retail follows these figures blindly, but beware: Their pumps are often short-lived.
Summary & Final Verdict
Recap: ChainGPT merges AI and crypto in a retail-friendly package, but its success hinges on delivering unique tools (not just hype). OKX’s backing is a strong signal, but the project feels like a "right place, right time" play.
Verdict: CGPT is a high-risk, high-reward gamble. It could 5x if AI mania returns or when BTC hits 130K, but it’s a use-case tourist compared to established AI tokens. Only allocate speculative capital. 5% of your powder should be good.
Final Thought: If you’re comfortable trading hype cycles, CGPT is a candidate. If you prioritize fundamentals, wait for proof of adoption beyond influencer shills.

Decided to enter Zerebro for the public portfolio.Decided to enter Zerebro for the public portfolio; AI agents are growing well. Potential upside: +140%.
Zerebro (ZEREBRO) is a decentralized AI system on the Solana blockchain, creating and distributing content across social media and crypto communities. Using RAG technology, it generates unique texts, NFTs, and memes, avoiding templates. Operates on X, Instagram, Telegram, integrated with Solana, Polygon, and Bitcoin. Token price: ~$0.05, market cap: ~$50M.

NVDA Weekly Head and Shoulders There's no main price target in mind, however the company from a risk management perspective has been largely not investible for about a year. Multiple 40-60% moves from top to the bottom of the range. Now with diffusion global competition will eventually eat into Nvidia's earnings/market share.
Without a major wave of monetary inflation in the United States it's very like that the short/medium term top has been put in and AI is a narrative that is played out. AI although impressive has yet to deliver what people see has a true life changer. It will eventually happen but Nvidia will have competition when that occurs.

Trend is your friend till end - AVAAIAVAAI/USDT is one of the few cryptocurrencies which show a clear uptrend, and trend is your friend till the end.
If BTC bounces, I expect to re-test mid-channel of the trend,
Posting this as an idea and to learn more about trading, any comments are welcome.

Big CUP & Handle .. 100+ for this AI stock
The chart displays a cup-and-handle pattern, a powerful bullish continuation setup. The "cup" formed from $3 to $11.07, followed by a "handle" consolidation near the $11.07 resistance (key level). The stock is poised for a breakout above this level, with the measured move of the pattern projecting a target of $125. This target is calculated by adding the cup's depth ($8, from $3 to $11) to the breakout point ($11.07), scaled on a logarithmic chart, suggesting a potential move to $125 if the breakout is confirmed with strong volume. The curved trendline (blue) provides robust support, reinforcing the bullish trend, while the breakout above the handle’s descending trendline signals momentum.
Fundamental Catalysts:
SoundHound AI is a leader in the conversational AI market, expected to grow to $49.9B by 2030 (CAGR 30.2%). Strategic acquisitions (Amelia, SYNQ3, Allset) have expanded its reach in restaurant and enterprise AI, adding clients like Chipotle and White Castle. Partnerships with Tencent, Stellantis, and Hyundai integrate its voice AI into global automotive markets, while a $1.2B revenue backlog ensures long-term growth. Q4 2024 revenue soared 101% to $34.5M, with 2025 projected at $157–$177M (97% growth). With 270+ patents, a $246M cash reserve (no debt), and a path to positive EBITDA by late 2025, SoundHound is primed for significant market share gains.

NASDAQ Harmonic pattern indicating strong bounce incoming.AI vs. Dot-Com Bubble
When drawing parallels between #AI and the dot-com bubble of the late 1990s, many express concerns that current valuations may be excessively inflated. However, significant differences are apparent.
To begin with, the current price-to-earnings (PE) ratio of the NASDAQ-100 is approximately 30, whereas during the dot-com bubble, it skyrocketed to 200, with many companies lacking any earnings in sight.
Additionally, the market capitalisation to #GDP ratio reached unprecedented levels in the late 1990s, while today's figures, although still high, are supported by robust earnings and solid cash flows from established business models.
Innovations in AI, cloud computing, and digital transformation have fuelled revenue growth, exemplified by #NVIDIA's data centre sales, which surged 409% year-over-year in Q4 2024, and Microsoft's Azure, which experienced a 28% year-over-year increase in 2024. This surge in productivity is being driven by individuals, businesses, and governments alike.
As a result, major tech firms are making substantial investments in AI research and development, with clear strategies for monetisation.
AI is poised to become a transformative force, akin to the transistor, a groundbreaking invention that scales effectively and permeates various sectors of the economy.
Lastly, the Federal Reserve raised interest #rates to 6.5% to tackle inflation after previously lowering them to address Y2K concerns before the bubble burst in 2000.
In contrast, current expectations suggest that interest rates will stabilise or decrease, which would support valuations.

CrowdStrike Holdings, Inc. – AI-Native Cybersecurity Powerhouse Company Snapshot:
CrowdStrike NASDAQ:CRWD remains a top-tier cybersecurity leader, redefining endpoint and cloud protection through its AI-powered Falcon platform, securing some of the most critical digital infrastructures in the world.
Key Catalysts:
Falcon Platform – AI-First, Cloud-Native 🧠☁️
Unified security architecture: endpoint, identity, cloud, and data
Leverages real-time analytics, automation, and continuous threat hunting
Widely recognized as a gold standard in modern cybersecurity (GigaOm, Gartner)
Elite Partnerships = Ecosystem Synergy 🤝
Named Google Cloud’s 2025 Security Partner of the Year
Deep collaborations with AWS, Microsoft Azure, and NVIDIA
Embedded in cloud-native DevOps workflows = high stickiness and TAM expansion
AI + Cyber = Next-Gen Growth Tailwind 🚀
Integrating generative AI and autonomous detection to proactively prevent threats
Strategic positioning at the intersection of cloud security and AI operations
Key enabler of Zero Trust architectures for global enterprises
Massive Market Opportunity 🌍
Global cyber budgets rising amid escalating threats
CrowdStrike well-positioned for land-and-expand growth via Falcon modules
Expanding presence in identity protection, XDR, and managed services
Financial Edge:
Consistent 30%+ YoY revenue growth
High gross margins (~77%)
Strong free cash flow generation, underpinning long-term profitability
📈 Investment Outlook
✅ Bullish Above: $370.00–$375.00
🚀 Upside Target: $600.00–$620.00
🎯 Thesis: Platform leverage, elite partnerships, and AI innovation make CrowdStrike a core cybersecurity growth leader for the AI era.
#CrowdStrike #Cybersecurity #AI #CRWD #FalconPlatform #CloudSecurity #NextGenTech

XAI Agent GORK. Elon Musk is on board?XAI Agent GORK. Elon Musk is on board?
#Gork — is a meme coin operating on the Solana blockchain, inspired by the XAI Grok chatbot. It gained significant attention due to its humorous and satirical nature, with notable interactions from influential figures like Elon Musk. The coin has experienced rapid market activity, including high trading volumes and substantial price fluctuations, driven by social media hype and speculative trading.
Market-Maker Wintermute:
intel.arkm.com
Official X (Gork):
x.com
Official Contract and Chart:
gmgn.ai
Arkham (Gork):
intel.arkm.com
Added Gork to the portfolio. I’ll hold and monitor it, looking for exit points in case of strong growth.

Alikze »» AIXBT | Formation of the valley pattern - 4H🔍 Technical analysis: Formation of the valley pattern - 4H
📣 BINANCE:AIXBTUSDT currency is moving in an ascending channel on the 4-hour time frame, which is currently in the supply zone and the middle of the ascending channel.
🟢From a classical perspective, a valley has formed that can break the current supply zone in the green box area by removing liquidity under the previous leg and grow to the next supply zone.
💎 Second scenario: The current supply zone break, depending on the number and frequency of hits to the supply level, can break it and continue its growth to the next supply zone, which is also the ceiling of the ascending channel, and then encounter a correction that, after a pullback to the previous supply zone, continues its path to the next target.
»»»«««»»»«««»»»«««
Please support this idea 💡 with a LIKE 👍 and COMMENT 💬 if you find it useful and Click "Follow" on our profile if you'd like these trade ideas delivered straight to your email 📧 in the future.
Thanks for your continued support.🙏
Best Regards,❤️
Alikze.
»»»«««»»»«««»»»«««

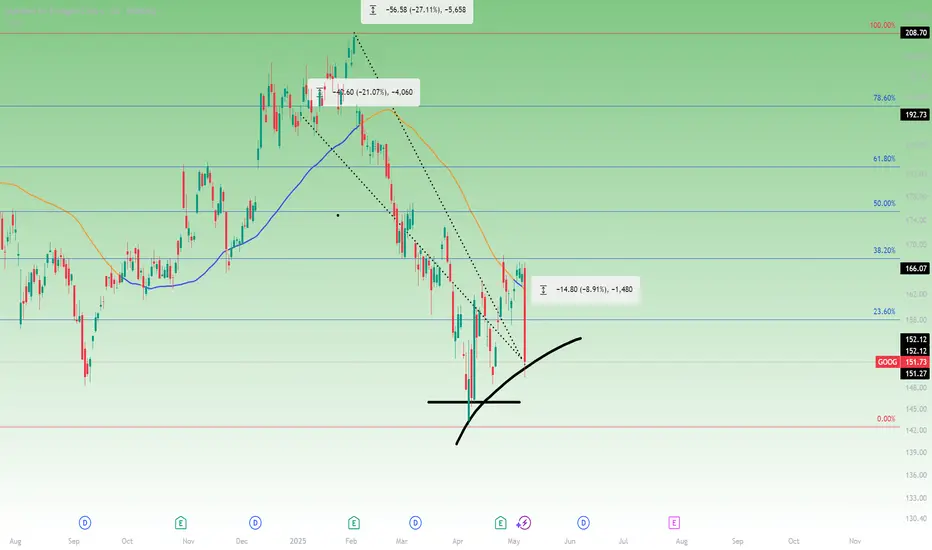
Google in trouble with Apple AI? Watch $146 next?Apple has confirmed it is actively exploring a redesigned web browser across iPhone, iPad, and Mac with a focus on AI-powered search. The potential shift away from Google as the default search provider on iOS devices, poses a direct risk to Alphabet’s search business.
Alphabet shares fell $14.11 (-8.54%) to $151.09 USD on the news, breaking below the 50-day moving average at $162.00 and the 23.6% Fibonacci retracement from the February high and April low, after finding resistance at the 38.2%.
From its February high, Alphabet is now down 27.1%, with a year-to-date loss of 21.1%.
While the stock remains above its 2025 low of $140.53, downside levels to monitor include ~$145.90.
XauUsd bullish outlook✅ Reasons for Entry:
✅ Third Touch on H4 Extreme Trendline confirms clean anchor & rejection
✅ Strong RBS zone at 3235 — previously supported upward impulsive move
✅ Visible demand rejection wicks on H1 and M15 — signs of buyer defense
✅ Bullish market structure still intact on D1 (trend continuation bias)
✅ Extreme Trendline + Structure + Rejection = High-probability setup
Auto Generated by Custom Smart Trading Chart AI

How to Trade Gold with AI-Powered Algos in 2025📊 How to Trade Gold with AI-Powered Algos in 2025
A practical action plan for serious gold traders
🔍 1. Know Why Gold Requires Custom Algo Tactics
Gold is volatile, news-sensitive, and driven by macro events like Fed policy, geopolitics, and inflation. Generic stock or crypto bots fail here — gold needs precise, event-aware automation.
🧠 2. Use AI-Powered Bots Trained for Gold Volatility
Deploy bots that adapt to real-time data like CPI releases, bond yields, and geopolitical headlines. Use machine learning models that detect gold breakouts, consolidations, and safe-haven flows.
Top AI algos for gold traders: Multiple systems based on MT4/MT5
Fully-automated, AI-based gold bot with breakout detection, precision entries, and built-in risk control.
⚙️ 3. Build or Choose the Right Algo Strategy for Gold
Trend-Following: Use 21/50 EMA crosses on H1 and H4
Mean Reversion: Bollinger Band fades in range-bound sessions
Breakout Algos: Trigger trades on CPI or FOMC event volatility
Volume-Based AI: Analyze volume spikes vs. historical patterns
🧪 4. Backtest Gold-Specific Models
Always test your bot using historical gold data, especially during NFP weeks, Fed meetings, and geopolitical escalations. Use data from 2018 to 2024 for high-volatility periods.
Tools: TradingView for Pine Script testing, MetaTrader 5 for EA deployment
🛡️ 5. Control Risk with Gold-Specific Parameters
Max drawdown: Keep under 15 percent
Stop-loss: Always use hard stops (not just trailing)
Position sizing: 0.5 to 1 percent of capital per trade
Use volatility filters: Avoid entries during thin liquidity hours
🔄 6. Automate Monitoring and Adaptation
Run multiple bots for breakout, momentum, and reversal setups
Use dashboards to track gold-specific metrics like VIX, USDX, DXY, and 10Y Treasury yields Integrate AI that adjusts parameters after major data releases
🚀 7. Prepare for 2025 Market Structure
Gold is increasingly driven by
Central bank digital currency rollouts
USD de-dollarization risks
Global stagflation or recession themes
DeFi and tokenized gold products
Your algo must factor in these macro narratives using real-time data feeds
📌 Gold Algo Trading Success Plan 2025
Use AI bots built for gold volatility
Trade high-probability breakouts post-news
Backtest with gold-specific macro filters
Maintain strict risk limits with max 15 percent drawdown
Monitor global news and macro data with bot triggers
Continuously optimize and adapt
Gold is not just a commodity — it’s a signal of global risk. Automate smartly, manage risk tightly, and use AI to stay one move ahead.

$VVV - Wave 2 & 30.618 fib support at $3.20
1.618 projection at $8.84
Wave 3 target has confluence with prior peek on 10th/11th of feb.

$VVV - going parabolicAfter seeing a double bottom, Venice token has moved upward into a parabolic channel. Could see blow off top with potential for extended push to new highs.

TradeCityPro | FET: AI Token Eyes Breakout After Sharp Rebound👋 Welcome to TradeCity Pro!
In this analysis, I’m going to review the FET coin for you. This project is one of the top AI-related projects in the crypto category.
💫 With a market cap of $1.8 billion, it currently ranks 48th on CoinMarketCap.
📅 Weekly Timeframe
In the previous analysis, I mentioned that if the ascending trendline in this timeframe is broken, the price would make a higher high beyond 3.099, and with the activation of the trendline trigger, we could confirm a trend reversal in this timeframe.
✔️ As you can see, that scenario has played out. After breaking the trendline and the 0.382 Fibonacci level, the price dropped sharply down to the 0.786 level.
✨ The price reaction at this level was very quick, and after hitting this zone, it gained bullish momentum again with a bullish engulfing candle and has now reached the 0.797 area.
📈 If the 0.797 level breaks, the price could experience another sharp upward move. The next resistance levels are 1.095, 2.068, and 3.099 — with 1.095 overlapping with the 0.382 Fibonacci level.
📊 The main confirmation of trend reversal will be given by forming a higher high and higher low above the 0.797 level — confirming Dow Theory.
🔽 For a bearish continuation, the confirmation comes with a break of the 0.786 Fibonacci level. The main support levels are 0.185 and 0.058.
📅 Daily Timeframe
In the daily timeframe, we can better see the details of this bullish move. As observed, the price has had a sharp leg up from the 0.379 bottom to 0.791 without any real correction.
🧩 Given the strength of the 0.791 resistance, a correction is more likely here. If the price moves upward without correction, it’s usually not a good sign for trend sustainability. A healthy trend includes corrections.
🎲 However, if 0.791 breaks and RSI enters the Overbought zone, the price could continue rising toward the 1.128 resistance. While this might not be ideal for trend health, the risk-to-reward ratio makes opening a position worthwhile.
🛒 In my opinion, a correction followed by a new bullish wave would be a more ideal setup, increasing the chances of a breakout. Breaking this level could be a strong trigger for both spot buying and futures positions.
📉 For a bearish scenario, we need to wait for the price reaction to 0.791 and then enter after confirmation of trend reversal. Lower-level triggers would be the breaks of 0.567, 0.455, and 0.379.
📝 Final Thoughts
This analysis reflects our opinions and is not financial advice.
Share your thoughts in the comments, and don’t forget to share this analysis with your friends! ❤️

Bad News from NVDA and ASML Put Pressure on AI StocksTwo pieces of bad news hit the chip sector in a single day.
First, the U.S. announced new restrictions on Nvidia, blocking the sale of its H20 chip to China. H20 was the only AI chip Nvidia could legally sell to China under existing regulations. The company stated the new restrictions could cost up to $5.5 billion.
The second blow came from ASML’s earnings report. ASML is the sole producer of EUV machines, which are critical for manufacturing advanced chips, including those used in AI. ASML's revenue miss, combined with the Nvidia news, weighed heavily on technology stocks. However, there is a silver lining: the revenue miss was due to weaker DUV machine sales, which are used for more basic chips. EUV sales actually beat market expectations by 33.54%, indicating that investment in AI infrastructure remains strong.
Nvidia shares are down more than 6% in premarket trading. This downward pressure may continue after the market opens. If the price drops below 100, it could present a buying opportunity for medium- to long-term investors. AI investment continues globally, and countries outside the U.S. are likely to accelerate their efforts to catch up. Despite the recent negative sentiment, there is no major change in the long-term outlook for the sector.

VANRY BREAKOUT>>> 100% pump incoming....As we see the trend, the Vanry made the bottom now is reclaimin the price slowvly but goind up. Very soon to breakout and move on for other resistances, so this is a good buy here..
Not financial adice .)
