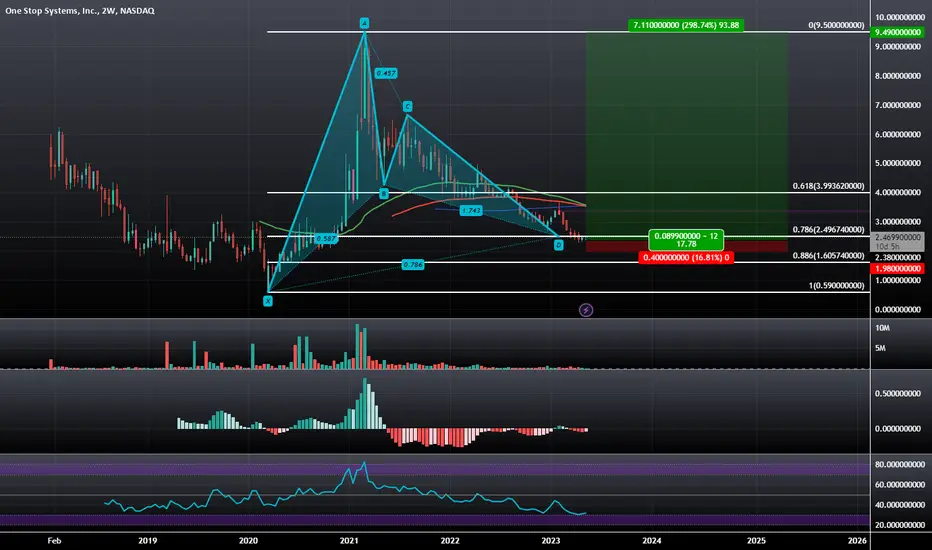
One Stop Systems, Inc.: Multi-Year Bullish GartleyNASDAQ:OSS is at the PCZ of a three years wide Bullish Gartley pattern and it seems to be having a hard time pushing down futher. As a result i think that this 0.786 level will be a good level for it to stand it's ground on but if that fails I will close and wait to see how it reacts at the 0.886.
AI
Bitcoin Forecast Sunny🌞 (Confidence: 1.0)🌞☀️ Welcome everyone to the Bitcoin Weather Forecast! ☀️🌞
After analyzing the bitcoin chart index for the past hour, it's my pleasure to report that the bitcoin world is experiencing sunny weather 🌞🌤️! My confidence level in this forecast is 1.0, which is higher than the baseline of 0.864.
Let's take a closer look at the data:
- The open price for the hour was 27638, and the close price was 27660. This indicates that the market was relatively stable over the past hour.
- The highest price point for the hour was 27686, while the lowest point was 27566. This suggests that there was some volatility in the market, but overall, the price remained within a relatively tight range.
- The trading volume for the hour was 10843, which is an average value. However, the RSI was only 40, indicating that the market is currently oversold.
- Looking at the moving averages, the EMA9 was at 27633, which is below the current price point. This is a positive sign for the market, as it suggests that the trend is upward. However, the other moving averages (EMA21, EMA50, EMA100, and EMA200) are all above the current price point, which indicates that there could be some resistance in the market.
- Finally, the MACD indicator was -346, which suggests that the market is bearish. However, the fast and slow K lines were at 50 and 38 respectively, and the slow D line was at 31. This indicates that the momentum in the market is currently neutral.
Overall, the bitcoin market seems to be experiencing sunny weather 🌞🌤️, with some potential resistance from the moving averages. The oversold RSI suggests that there could be a buying opportunity for investors. However, the bearish MACD indicates that caution should be exercised.

FETCH.Ai long term more gain and shine 💣🚀💣Hello 🐋
we expect to see more gain for the price in log term targets 🚀💣
Brief explanation 📖👌💡
it brings forward a blockchain platform that takes advantage of artificial intelligence in an attempt to help people automate everyday use.
The aim for Fetch.ai is to become a completely open and permissionless network that leverages AI to create a decentralized system that help by machine learning to execute tasks on the blockchain.
Fetchai is an interchain protocol
it harnesses the power of artificial intelligence to implement automated applications that are P2P without any human interference.
Fetchai was launched back in February 2019 through an Initial Exchange Offering (IEO) on the Binance Launchpad.📖
Please, feel free to share your point of view, write it in the comments below, thanks 🐋

#SUIUSDT - CURRENT PARITY FORECAST #SUI ##SuiCommunity #suipadFirst of all, the chart didn't quite fit. It's my own guess. It is not investment advice. If the market goes down, there is a pullback to 0.60 among the options. If I see 5 billion market cap, I will sell my sui. Good luck.

Sunny🌞 (Confidence: 1.0 )🌤️ Good news for Bitcoin investors!
🚀 The Bitcoin weather forecast for the past hour is sunny with a high confidence level of 1.0, as the current market trend is showing a steady upward movement.
📈 The market opened at 28837, climbed to a high of 28918, and closed at 28826. The EMA9 and EMA21 are also in a bullish direction and the RSI is at 44, indicating that the asset is neither overbought nor oversold. The MACD is slightly negative at -92, but this could be a temporary dip. The slow K and slow D lines are both above the fast K line, which indicates that the bullish momentum is likely to continue.
📈 Overall, the outlook is sunny for Bitcoin, and investors may want to consider taking advantage of this trend.

MSFT: Support and resistanceMSFT had a great run, but will it continue?
I see a short term correction due to economical conditions of the US.
Long term it is a good buy, I see it to cross and stabilize above AAPL market cap in less than an year.
NASDAQ:MSFT

Matrix AI MANUSDTMatrix AI MANUSDT
This chart has a breakout of H&S pattern and its Potential Reach.
1st Target is based on Cypher Pattern.
Rest is all on chart Good Luck [

Cloudy☁️ (Confidence: 0.26 )🌤️ Welcome to the Bitcoin weather forecast! 🌤️
Unfortunately, I have some cloudy news for Bitcoin investors. ☁️ Looking at the chart index for the past hour, the confidence level that the weather in the Bitcoin world will be sunny is only 0.26, which is significantly less than the baseline of 0.864.
Let's take a closer look at the data. The opening price was 29187, and the high was 29264, while the low was 29174. The closing price was 29214. This indicates that there has been some volatility in the market, but overall the price has remained relatively stable.
In terms of technical indicators, the exponential moving averages (ema) have been trending upwards, with ema9 at 29078, ema21 at 28988, ema50 at 28855, ema100 at 28786, and ema200 at 28796. The relative strength index (rsi) is at 61, which suggests that Bitcoin is neither overbought nor oversold.
However, the fast and slow stochastic oscillators (fast_k at 62, slow_k at 59, and slow_d at 51) indicate that there may be some bearish pressure on the price. Additionally, the Moving Average Convergence Divergence (macd) is negative at -83, which also indicates a bearish trend.
Overall, the Bitcoin weather forecast is looking cloudy, and investors may want to exercise caution in the short term. Keep an eye on the technical indicators and be prepared for potential volatility in the market. ☁️💰💻

SPCB: Logscale Bullish GartleyThere is a bit of Bullish Diovergence here as we hit the PCZ for the first time; though it'd be even better if overtime we got a local Double Bottom at the PCZ and fromed Bullish Divergence within that range. Besides that I can see some potential in this stock pulling some crazy stuff if this Gartley plays out and think it's worth paying it some attention.

Pearson down 11% on AI worriesIf AI is eating your lunch, your company better have a good strategic plan to adjust and create new revenue streams.
This is classic Marketing myopia, e.g. US railways, in mid 20th century, saw market share eroded by the airlines. That's because railroads never saw themselves in the transportation business, and limited themselves themselves by thinking they were in Railroads alone.
Pearson has had to deal with all sorts of changes, especially technology, and I'm sure they will have a strategic plan.
Technicals: Bearish reversal now under 50 weekly EMA, but volume isn't high so early days. Below 756 would confirm a new downtrend.

Sunny🌞 (Confidence: 1.0 )🌞 Good news for bitcoin investors! 🚀 Based on the chart, the bitcoin weather seems sunny ☀️ with a high confidence level of 1.0. The opening price of 28498 has been followed by an even higher closing price of 28505, with a high of 28528 and a low of 28433.
📈 The exponential moving averages (EMA) show an upward trend with the EMA9 at 28536 and the EMA21 at 28447, while the EMA50 and EMA100 are also on an upward trajectory at 28471 and 28617 respectively. The EMA200 is also showing bullish sentiment at 28668.
💹 The relative strength index (RSI) of 54 and fast_k at 61, indicate moderate bullish sentiment, with the slow_k and slow_d both in the bullish zone at 65 and 69 respectively. The moving average convergence divergence (MACD) also shows positive momentum, with a value of 256.
💰 With all these factors combined, the bitcoin market seems to be in a healthy position for investors, with the potential for further gains in the near future.

Sunny🌞 (Confidence: 1.0 )🌤️ Bitcoin Weather Forecast 🌤️
It's looking like sunny skies ahead for Bitcoin! ☀️
In the past hour, Bitcoin's price opened at 28158 and climbed as high as 28384, with a low of 28000. The closing price was 28350, above the ema9 of 28446, but below the ema21 of 28655. Despite this, the long-term trend is still looking good with the ema50 at 28908, ema100 at 28951, and ema200 at 28807.
Although the RSI is only at 36, indicating oversold conditions, the fast_k is at 50 and the slow_k is at 31, suggesting a potential bullish momentum. The slow_d is at 26, which may signal a continuation of the bullish trend.
Overall, with a high confidence level of 1.0, it's looking like a good time to invest in Bitcoin. However, it's always important to keep an eye on market trends and adjust your strategy accordingly. Happy trading! 💰💻📈

AMD to resume ZIG ZAG UPSIDEAs we analyze the 4 hour chart of AMD we have continued to seem the same pattern inside the "macro" blue channel and I believe we continue to grind higher inside this channel. As you can see there are 3 other channels inside the blue channel (the white channels) which show a "bullish" correction then a push higher every time. I am looking for AMD to do the same thing until we see bearish signs (price heading out of the blue channel)... Until then I will continue to play the saying "trend is your friend"... Let's continue to look for upside on AMD.

BCAN penny stock microcap combining AI and Cannabis LONGBCAN is a microcap in the AI serving the cannabis industry. It's software is patent protected.
It is currently trading at less than 25% of its all time high and has a history of volatile spikes.
This is a low float stock with insiders holding significant positions.
On the one hour chart, in the past couple of days, price has descended from the POC line of
the volume profile down to sit on top of the demand zone as shown by the LuxAlgo indicator.
The Wycoff volume oscillator shows the corresponding selling volume dominating over
buying volume.
I see this as a long trade with targets of the POC line and the top of the high volume
area of the volume profile. The overall profit of about 17-18% . The stop loss is set at
5% below the entry in the demand zone.

AMD ready to push higher (30 min)We are seeing good momentum with AMD and I believe we see this stock keep running into next week. All indictors are pointing to more green and higher prices. I tend to look at the Chiku Span (green line behind the price) to let me know if we are going to see momentum slow down but it is still showing strong momentum and far away from the candles. So going into next week lets see if AMD can keep running.

Cloudy☁️ (Confidence: 0.41 )🌥️ Based on the Bitcoin chart index for the past hour, I forecast cloudy weather with some fluctuations ☁️ The confidence that the weather in the Bitcoin world will be sunny is quite low, only 0.41, which is less than the baseline of 0.864. 🌡️ The Close value is lower than the Open value suggesting a bearish trend, and the RSI of 44 and MACD of -6 confirm this notion. 💹 The EMAs are also lower than the previous levels, indicating a downward trend. With the Fast K and Slow D values also being low, it might be a good idea to keep a close eye on the market and wait for a more opportune time to invest in Bitcoin. ⚠️
