UPSTART ($UPST): AI-DRIVEN LENDING ON THE RISEUPSTART ( NASDAQ:UPST ): AI-DRIVEN LENDING ON THE RISE
1/8 – REVENUE & EARNINGS BLAST
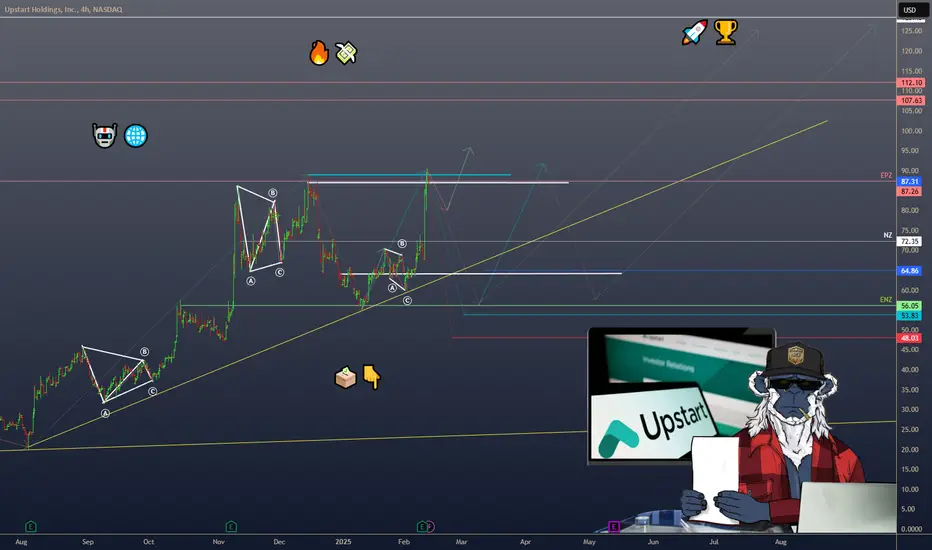
• Q4 2024 revenue: $219M (+56% YoY) 🔥
• Powered by a 68% jump in loan originations 💸
• EPS: $0.26, beating estimates by $0.30 (analysts expected -$0.04) 🚀
• Positive Adj. EBITDA—Upstart’s inching closer to sustained profitability 🏆
2/8 – BIG FINANCIAL EVENTS
• Strong focus on AI model innovation + expanding funding supply 🤖
• Management bullish on earnings call—AI improvements = growth catalyst 🚀
• Renowned for bridging lenders & borrowers via advanced, automated credit assessments 🌐
3/8 – SECTOR COMPARISON
• Some valuation measures say overvalued (e.g., GF Value ~$28 vs. market ~$65) 🧐
• Outpacing fintech peers like SoFi, PayPal, Ally in revenue growth 📈
• Profitability & multiples (P/E, P/S) lag behind due to recent net losses 😬
• Unique AI-lending angle may justify a premium—if it pays off 💡
4/8 – RISK ASSESSMENT
• Partner Dependence: A few big lenders = high exposure ⚠️
• Economic Sensitivity: Loan defaults rise if consumer conditions worsen 🌪️
• Regulatory Hurdles: Shifting financial rules could dent operations 🏛️
• Credit Risk: Holding loans on the balance sheet—watch out in downturns 💥
5/8 – SWOT HIGHLIGHTS
Strengths:
• Advanced AI for credit analysis 🤖
• High automation in approvals ⚡️
• Scalable via partner expansions 🌍
Weaknesses:
• Limited operating history ⏳
• Recent financial losses 📉
• Reliance on key partners 🤝
Opportunities:
• New loan products (auto, HELOC, etc.) 🚗🏠
• Expanding digital lending market 🌐
• Gaining market share as AI evolves 🔬
Threats:
• Fierce fintech competition 🏁
• Possible regulatory changes ⚖️
• Macro headwinds affecting credit demand 🌩️
6/8 – UN/UNDERVALUATION DEBATE
• Some see big future potential → undervalued by growth prospects 💹
• Others worry about multiples & an over-reliance on economic upswings 😬
• Recovery depends on broader economic rebound & strong risk management 🏦
7/8 Is Upstart a gem or a risk?
1️⃣ Bullish—AI lending will transform fintech 🏅
2️⃣ Cautiously Optimistic—Need more stability 🤔
3️⃣ Bearish—Valuation & macro risks are too high 🚫
Vote below! 🗳️👇
8/8 – STRATEGY WATCH
• Keep tabs on new loan products & partnerships 🛠️
• Monitor economic indicators (defaults, credit demand) impacting revenue 💼
• Regulatory shifts can either boost or bury AI-lending advantage ⚠️
AI
What I'm doing with APPSo I had call options into the earnings 🥳 , here's my plan... $584 Should act as resistance or potential future support. That's why I'm going to close them there. That protects those options for a potential pullback to $417. If instead Applovin breaks above resistance I'll look for a pullback to consolidate back into the $584 support and get long once again.
Good luck!

STOCKS | AI | Amazon, Meta & MSFTPeople who are saying that AI is just a bubble are missing the big picture. Huge tech companies are pouring serious money into it, which shows they believe AI is here to stay.
We're talking massive investments – like over $320 billion in AI infrastructure by 2025, according to the Financial Times. Amazon is planning over $100 billion in capital expenditures in 2025, mainly focused on AI infrastructure. This could be huge not only for NASDAQ:AMZN as a whole but also for the AI industry.
Alphabet is also throwing in around $75 billion this year to boost its AI capabilities. These kinds of investments from the top players make it clear: they know you have to spend big to win in the AI game and clearly there is a race going on, especially after the release of DeepSeekAI. American companies don't want to be left behind, and it's likely that they will pour money into integrating AI to improve their business operation - with the ultimate aim to improve profit - which is great for stock prices. How they make money from AI might change over time, but the overall direction is obvious – AI is changing everything and driving innovation.
According to Statista, the global AI market is predicted to reach around $826 billion by 2030. That kind of growth tells you AI is going to be a major force in just about every industry. And therefore I believe that all the companies making major investment in AI will also see exponential growth over the next 5 years - meaning it may be a longer term game play.
_______________
NASDAQ:MSFT NASDAQ:META

$SMCI (SUPER MICRO COMPUTER): AI-DRIVEN GROWTH AMID GOVERNANCESMCI (SUPER MICRO COMPUTER): AI-DRIVEN GROWTH AMID GOVERNANCE WOES
1/8
Super Micro Computer ( NASDAQ:SMCI ) just revealed prelim Q2 FY2025 sales of $5.6–5.7B (+54% YoY), riding AI’s wave. But delayed filings & margin pressure spark caution. Let’s dig in! 💻⚡️
2/8 – REVENUE & EARNINGS SNAPSHOT
• Q2 sales: $5.7B (vs. $5.9B est.), EPS: ~$0.59 (est. $0.64)
• Full-year outlook trimmed to $23.5–25B (was $26–30B)
• Non-GAAP gross margin: ~11.9%; operating margin: ~7.9%—still under pressure 🏭
3/8 – KEY FINANCIAL EVENTS
• $700M in 2.25% convertible senior notes → fueling AI server growth
• Filing delays (10-K, 10-Qs) → must meet Feb 25, 2025 to avoid Nasdaq delisting
• New auditor BDO checks the books—no fraud found, but concerns linger about governance 🧐
4/8 – GOVERNANCE & INVESTIGATIONS
• Ongoing SEC & DOJ probes after Hindenburg’s short-seller report
• CEO says they’ll meet filing deadline, but trust is still shaky
• Market watchers: “No fraud found” is good, but the uncertainty stings 🤔
5/8 – SECTOR CONTEXT
• Competes with Dell ( NYSE:DELL ), HPE ( NYSE:HPE )—both see AI demand, but SMCI more focused
• SMCI trades at ~11x 2025 earnings (vs. Dell at 15x, HPE at 12x)
• Could be undervalued—but only if governance issues don’t overshadow the AI growth story 🚀
6/8 – RISKS
• Margin Pressure: R&D + product mix + potential GPU shipment delays (Nvidia Blackwell)
• Debt Load: Total debt now ~$1.9B, plus $700M in convertible notes
• Regulatory Overhang: Missing that Feb 25 deadline = serious delisting risk ⚠️
7/8 Is SMCI worth the gamble?
1️⃣ Bullish—AI potential outweighs the risks
2️⃣ Neutral—Need clarity on filings & margins
3️⃣ Bearish—Governance red flags trump growth
Vote below! 🗳️👇
8/8 – STRATEGIC OUTLOOK
• 70%+ revenue from AI platforms → big edge if servers remain hot
• Partnerships w/ Nvidia & push into liquid-cooled data centers
• Delaying or messing up compliance could sabotage all that potential 🌐

NVIDIA Price Rebalance to 132$You most likely already know that most retail traders lose money.
With the fear of new cost efficient AI news most people shorted NVIDIA. Whatever the name of the AI and whichever the country it is and however efficient it is, it will still run on hardware and as of now NVIDIA is the biggest hardware maker. This is the chance to buy since price did not go down in a healthy price action.
We expect a recovery to equilibrium of the inefficient drop of price at 132$
Please comment any questions you have.
Happy and safe trading!

iotex is best depin projectIoTeX (IOTX) has recently garnered significant attention in the cryptocurrency market, particularly following a substantial $50 million investment from a consortium of venture capital firms. This infusion of capital is poised to accelerate the growth and adoption of Decentralized Physical Infrastructure Networks (DePIN), positioning IoTeX for a promising future. citeturn0search14
**Strategic Investments and Partnerships**
The recent $50 million funding round, led by prominent investors such as Borderless Capital and Amber Group, underscores the confidence in IoTeX's vision and technological capabilities. These strategic partnerships are expected to enhance IoTeX's infrastructure and expand its ecosystem, fostering increased adoption and utility of the IOTX token. citeturn0search2
**Market Performance and Future Projections**
As of now, IOTX is trading at approximately $0.0201, with a 24-hour trading volume of around $9.49 million. The token has experienced a slight decline of 1.68% in the past day.
Looking ahead, various analyses offer optimistic projections for IOTX. For instance, CoinCodex forecasts that IoTeX could reach a high of $0.2922 by 2025, representing a potential increase of over 1,350% from its current price. citeturn0search1 Similarly, DigitalCoinPrice anticipates that IOTX may reach $0.068 by 2025 and $0.16 by 2030, indicating sustained growth over the long term.
The substantial venture capital investment, coupled with strategic partnerships and favorable market projections, suggests a promising trajectory for IoTeX. As the platform continues to develop and expand its DePIN initiatives, the value of IOTX is well-positioned for significant appreciation in the coming years.
*Note: This analysis is based on information available as of February 10, 2025. Investors are advised to conduct their own research and consider market dynamics before making investment decisions.*

Shopify (SHOP) AnalysisCompany Overview:
Shopify NYSE:SHOP is a leading e-commerce platform that continues to grow by expanding into AI-driven solutions and fulfillment services, aiming to optimize merchant growth. Shopify is positioning itself as a major player in the e-commerce ecosystem, particularly with Shopify Plus, which is gaining momentum among large retailers.
Key Catalysts:
AI-Powered Tools for Merchants 🤖
Shopify is integrating AI-driven solutions to enhance marketing, inventory management, and checkout optimization, which improves merchant retention and adoption.
Enterprise Growth 📈
Shopify Plus is experiencing strong adoption among larger retailers, helping diversify revenue and reduce the company's reliance on small businesses. This supports more stable growth.
Long-Term E-commerce Growth 🌐
With e-commerce projected to grow at a 9.5% CAGR through 2030, Shopify holds a 10% market share in the U.S., positioning it for long-term growth in an expanding digital marketplace.
Financial Strength 💰
Free cash flow margin rose to 19%, underscoring Shopify’s robust financial health and ability to reinvest in future growth initiatives.
Investment Outlook:
Bullish Case: We are bullish on SHOP above the $102.00-$105.00 range, driven by AI expansion, growing enterprise adoption, and strong cash flow.
Upside Potential: Our price target is $170.00-$172.00, reflecting the company’s dominance in e-commerce and its ongoing innovations.
📢 Shopify—Shaping the Future of E-Commerce and AI. #Ecommerce #AIExpansion #SHOP

NVIDIA (NVDA) Bounces Off Weekly EMA – Is a Rally Coming?📈 NVIDIA (NVDA) closed the week with a strong bullish candle, rebounding off the 50-week EMA. Historically, this has been a key level for the stock, often signaling strong continuation moves to the upside.
Key Observations:
- 1W 50 EMA Support: In previous cycles, NVDA has repeatedly touched this moving average and rebounded, leading to sustained uptrends. The highlighted regions on the chart reinforce this pattern.
- Strong Buying Volume: The volume bars suggest renewed interest from buyers at this level.
- Macro Uptrend Intact: Despite recent corrections, NVDA remains in a long-term bullish trend.
Fundamentals:
- NVIDIA is expected to release their next earnings report on February 26th, which is in 19 days from now.
- NVIDIA is set to release their $3000 NVIDIA GB10 compact AI super computer in May.
- As cheaper-to-run AI models like DeepSeek are released and get into the hands of businesses, this will lead to increased demand for AI chips (read about Jevons' Paradox on Wikipedia ).
Potential Price Path:
🚀 If history repeats, this bounce could lead NVDA to reclaim previous highs and even explore new all-time highs in the coming months.
⚠️ Risk Factor: If NVDA fails to hold above the 50-week EMA, downside risk increases, with a potential retest of lower support levels.
📊 Conclusion: This historical pattern suggests a high-probability trade setup. Traders and investors should keep an eye on volume confirmation and macroeconomic conditions before making their next move.
💬 What’s your take on NVDA’s next move? Share your thoughts below! 👇
Let me know if you want any refinements or additional insights. 🚀
Don't forget,
Patience is Paramount.

Breaking: Doximity Stock Jumps 37% On Upbeat Annual OutlookDoximity Inc. (NASDAQ: DOCS), the leading digital platform for U.S. medical professionals, has made headlines with its stock skyrocketing 37% following a stellar earnings report and an upbeat annual outlook. The company’s third-quarter fiscal 2025 results not only surpassed analyst expectations but also showcased robust growth in key areas, including AI tools and user engagement.
Strong Earnings and Upbeat Guidance
Doximity’s latest earnings report has solidified its position as a growth powerhouse in the healthcare technology sector. Here are the key highlights:
1. Record Revenue and Earnings Growth
- Revenue: $168.6 million, up 25% year-over-year, beating consensus estimates of $152.82 million.
- Earnings Per Share (EPS): Adjusted EPS of $0.45, a significant jump from $0.29 a year ago and well above the $0.34 consensus.
- Net Income: $75.2 million, up 57% year-over-year, reflecting strong profitability.
2. AI Tools and User Engagement Driving Growth
Doximity’s AI-powered tools saw a 60% quarter-over-quarter increase in usage, while its newsfeed surpassed one million unique providers. This demonstrates the platform’s ability to innovate and retain user engagement, which is critical for long-term growth.
3. Raised Guidance for Fiscal 2025
The company raised its revenue guidance to $564.6 million—$565.6 million, up from the previous range of $535 million—$540 million. Adjusted EBITDA guidance was also increased to $306.6 million—$307.6 million, signaling confidence in continued profitability and operational efficiency.
4. Analyst Optimism
Analysts have responded positively to Doximity’s performance:
- Needham: Raised price target from $65 to $82, maintaining a Buy rating.
- Wells Fargo: Increased price target from $43 to $55, maintaining an Equal-Weight rating.
- Raymond James: Raised price target from $65 to $83, reiterating an Outperform rating.
These upward revisions reflect growing confidence in Doximity’s ability to sustain its momentum.
Technical Analysis:
From a technical perspective, NYSE:DOCS is exhibiting a classic gap-up pattern, with shares up 35.68% at the time of writing. Here’s what the charts are telling us:
1. Gap-Up Pattern
The gap-up indicates a surge in buying interest following the earnings announcement. While this is a bullish signal, gaps are often filled in the long run, meaning the stock could retrace some of its gains before continuing its upward trajectory.
2. The Relative Strength Index (RSI) is currently at 86, well above the overbought threshold of 70. This suggests that the stock may be due for a short-term pullback or consolidation as traders take profits.
3. Despite overbought conditions, the stock’s momentum remains strong. Key support levels to watch include the pre-gap price zone around $61. A pullback to this area could present a buying opportunity for investors looking to enter at a lower price.
Why Doximity Stands Out
Doximity’s success is rooted in its ability to address critical needs in the healthcare industry. Its digital platform streamlines communication and workflow for medical professionals, while its AI tools enhance efficiency and decision-making. With over 610,000 unique providers using its clinical workflow tools, Doximity has established itself as an indispensable resource for healthcare professionals.
A Strong Buy with Caution
Doximity’s impressive earnings report and raised guidance have rightfully propelled its stock to new heights. From a fundamental perspective, the company’s growth trajectory, driven by AI innovation and user engagement, is compelling. Technically, while the stock is overbought in the short term, the long-term outlook remains bullish.

Amazon (NASDAQ:$AMZN) Slides 4% Amidst Cloud Growth SlowdownAmazon (NASDAQ: AMZN) shares slid nearly 4% in pre-market trading on Friday, as investors reacted to a slowdown in the company's cloud growth and a subdued sales forecast for the current quarter. The dip comes despite strong performance in Amazon's retail segment and a broader technical breakout that suggests the stock may be poised for a significant upward move in the coming months. Let’s dive into the technical and fundamental factors driving Amazon’s current market dynamics and why this dip could be a buying opportunity for long-term investors.
Cloud Growth Slowdown Weighs on Sentiment
Amazon Web Services (AWS), the company’s cloud computing division and a key profit driver, reported a 19% year-over-year revenue increase to $28.79 billion for the quarter. While this growth is impressive, it fell slightly short of analyst expectations of $28.87 billion, according to LSEG data. This miss has raised concerns about the competitive pressures AWS faces from rivals like Microsoft Azure and Google Cloud, as well as emerging low-cost competitors such as China’s DeepSeek.
Technical Outlook
From a technical perspective, Amazon’s stock chart tells an intriguing story. As of Friday’s pre-market trading, AMZN was down 2.78%, but the stock recently broke out of a falling trend channel, signaling a potential reversal of its previous downtrend. While the stock has yet to capitalize on this breakout, the current dip could be interpreted as a "shakeout" before a significant upward move.
Key technical indicators support this bullish thesis:
- Relative Strength Index (RSI): The RSI remains strong at 60, indicating that the stock is neither overbought nor oversold and has room to climb.
- Moving Averages: AMZN is trading well above its 50-day, 100-day, and 200-day moving averages, a sign of strong underlying momentum and bullish sentiment.
This technical setup suggests that the pre-market dip may be a temporary pullback rather than the start of a sustained downtrend. For traders and investors, this could present an attractive entry point.
Strong Revenue and Earnings Growth
Amazon’s financial performance in 2024 has been impressive, with revenue reaching $637.96 billion, a 10.99% increase compared to the previous year’s $574.79 billion. Earnings surged by 94.73% to $59.25 billion, reflecting the company’s ability to scale profitability even as it invests heavily in growth areas like AI and cloud infrastructure.
The company’s 12-month forward price-to-earnings (P/E) ratio of 37.3 is higher than peers like Alphabet (22.7) and Microsoft (30.1), but this premium is justified given Amazon’s diversified business model, dominant market position, and long-term growth potential.
Analyst Sentiment: Strong Buy Rating
Wall Street remains overwhelmingly bullish on Amazon. According to 43 analysts, the average rating for AMZN stock is a "Strong Buy," with a 12-month price target of $254.3, representing a 6.48% upside from the latest price. At least seven brokerages raised their price targets following the earnings report, bringing the median target to $260.
Analysts are optimistic about Amazon’s ability to navigate near-term challenges and capitalize on long-term growth opportunities in AI, cloud computing, and e-commerce. The company’s heavy investments in AI infrastructure, while weighing on margins in the short term, are expected to pay off handsomely in the coming years.

AI vs. Software: Is Software Ready to Reclaim Tech Leadership?Introduction:
The rapid advancements in artificial intelligence (AI)—especially with China’s DeepSeek—are reshaping the tech investment landscape. However, with all the focus on AI, could traditional software stocks be staging a comeback?
To answer this, we’re analyzing the Software CBOE:IGV vs. Technology AMEX:XLK ratio, a key indicator of relative strength within the tech sector.
Analysis:
Investment Flow Shift: Over the past few years, capital has largely rotated away from traditional software and into AI-driven sectors.
Bottoming Formation: The IGV-to-XLK ratio appears to have bottomed in June 2024, followed by a steady uptrend.
Breakout Watch: After a strong move in November, the ratio formed a higher low, a constructive sign of strength. Now, it is attempting to break out from a broadening bottom pattern—a significant technical development.
Potential Leadership Change: If this breakout holds and continues higher, software stocks could regain leadership within the tech sector, signaling a shift in investor sentiment.
What to Watch:
Bullish Confirmation: A sustained breakout above resistance would suggest software is regaining dominance within tech.
Bearish Rejection: If the breakout fails, AI-driven themes may continue to overshadow traditional software.
Conclusion:
The software sector appears to be making a strong case for resurgence within tech, especially if this breakout holds. A decisive move higher could mark a major sector rotation back into software stocks, challenging AI’s recent dominance. Will software reclaim its throne, or will AI continue to steal the spotlight? Let’s discuss in the comments!
Tags: #Software #Technology #IGV #XLK #AI #SectorRotation #TechLeadership #MarketTrends

Serve Robotics (SERV) Analysis Company Overview:
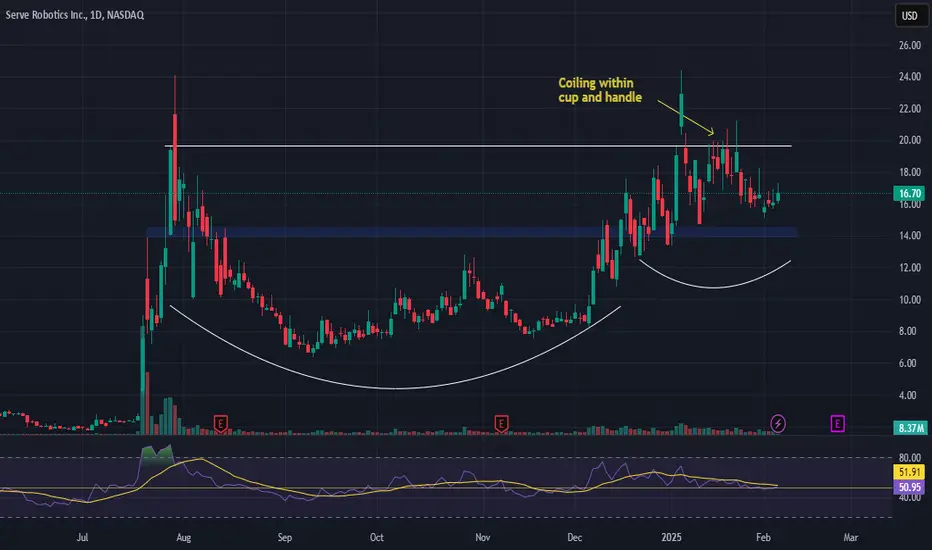
Serve Robotics NASDAQ:SERV is a pioneer in autonomous last-mile delivery, leveraging AI-driven electric robots to reduce costs and emissions. With strong partnerships and financial backing, SERV is positioned to disrupt traditional delivery models.
Key Catalysts:
$450 Billion Market Potential by 2030 🌎
Serve’s $1-per-trip model could revolutionize delivery economics.
Strategic Partnerships – Uber & 7-Eleven 📦
Uber’s $11.5M investment and integration with Uber Eats enhance scale.
7-Eleven partnership strengthens Serve’s retail delivery presence.
Strong Financial Backing – Secured Through 2026 💰
$166M raised since December 2024, ensuring funding stability.
NVIDIA and Delivery Hero investments validate AI-driven robotics.
Investment Outlook:
Bullish Case: We are bullish on SERV above $14.00-$14.50, supported by disruptive potential, strategic partnerships, and financial strength.
Upside Potential: Our price target is $31.00-$32.00, reflecting market expansion, AI adoption, and industry transformation.
📢 Serve Robotics—Redefining Last-Mile Delivery. #AI #Robotics #AutonomousDelivery #SERV
NVIDIA (NVDA) - Failed Bear Flag, Bullish Reversal in Play📉 Failed Bear Flag Pattern
NVDA initially formed a bear flag, with a strong downward flagpole followed by consolidation in an upward-sloping channel. However, instead of breaking down as expected, the price reversed at the lower boundary, signaling bulls absorbing selling pressure.
📈 Breakout Potential
The recent impulse move out of the flag formation aligns with a Wave 1 breakout, confirming a potential bullish trend. If the Wave 2 retracement holds above previous lows, NVDA could see a strong Wave 3 rally towards $130-$140.
🔍 Key Resistance & Confirmation Levels
Immediate resistance around $122-$124 (previous highs & bear flag upper boundary). A break above $124 with volume could trigger further bullish momentum. Downside risk remains if NVDA re-enters the bear flag below $115.
🚀 Bullish Bias Unless Invalidated
Given the failed bear flag breakdown and Elliott Wave structure, the bias shifts bullish towards higher highs. Watch for strong follow-through on Wave 3 to confirm this setup.
📊 Trade Plan:
Entry: On pullbacks above $118-$120
Target: $130-$145
Stop: Below $115
💡 Let me know your thoughts! Do you agree with this bullish outlook?
Don't forget,
Patience is Paramount.

apt analysis: price correction and buying opportunity...hello friends
Considering the good growth we had, now that we have entered the correction, it is a good opportunity to buy a ladder with capital management...
We have specified goals for you.
*Trade safely with us*

sui analysis: Safe shopping...hello friends
Considering the good upward trend we had, now that the entry price has been corrected, it is a good time to buy in steps and with capital management.
We have specified for you the steps of buying which are the support areas.
We have specified for you the goals, which are the resistance.
*Trade safely with us*

JD.com (JD) AnalysisCompany Overview:
JD.com NASDAQ:JD is one of China’s leading e-commerce and logistics giants, rapidly expanding into cloud computing and AI-driven solutions. With a strong focus on efficiency, retail innovation, and policy-driven tailwinds, JD.com is well-positioned for long-term growth.
Key Catalysts:
Chinese Government's “Trade-In” Policy Boost 📈
The extended consumer electronics trade-in policy is expected to accelerate sales, driving demand across JD’s platform.
Full Acquisition of Dada Nexus 🚚
JD’s 100% ownership of Dada Nexus strengthens its last-mile delivery efficiency, improving logistics and customer satisfaction.
Omnichannel Expansion: JD MALL & JD E-Space 🏬
JD is expanding its offline footprint with JD MALL and JD E-Space, enhancing its omnichannel retail strategy for deeper customer engagement.
AI & Cloud Computing Growth ☁️
JD’s investment in cloud and AI positions it as a tech-driven e-commerce leader, driving new revenue streams.
Investment Outlook:
Bullish Case: We are bullish on JD above $34.00-$35.00, supported by policy tailwinds, logistics integration, and AI-driven retail innovation.
Upside Potential: Our price target is $60.00-$62.00, reflecting enhanced logistics, e-commerce expansion, and growing cloud adoption.
📢 JD.com—Innovating E-Commerce with AI & Logistics. #JD #ECommerce #AI #CloudComputing

PYTHIA, the rat with an AI module in the head. EASY 10X !!Guys,
As you may seen my profile, i do have posted sometimes some sort of early games with tokens having low market cap, but seriously great ones!
This time i wanted to show you the POLONIEX:PYTHIAUSDT which is a token, with the goal to promot the neuroscientists work in Russia.
They do implemented an usb in the rat's head to make it able to put different AI modules into the head, which stimulates the brain activity accordingly the instructions. Pythia have shown in live to people before, and there are videos which shows how this is working. Basically you can ask any question to the ai, if that question is true or false, the rat goes and pushes the button which was provided by the AI. Literally, amazing sci-fi style technology!
The main push will be provided by Mario Nawfal, who is the most famous streamer on X with about 2 million followers. Their posts frequently seen and reposted by Elon Musk as well, and many other people. They gonna have the interview on the 10th of february, which is 8 days from now. I think this token have a HUGE potential right now to grow 10x-20x in their price.
Make your decision, and don't forget that these plays are risky.
Not an advice, just a note for my futureself! :)
Share thoughts!

AAPL 1.22.2025 IdeaMy assessment is a fair price on the stock of $230 per share. AAPL now sitting at $222.5, I believe there is a high probability for a 5% up move within a few months.
Entry would be favorable if AAPL =< $220. I would enter direct shares here.
AAPL is of those companies that will be affected by tariffs. However, AAPL has benefitted from expanding its services economy. In other words, AAPL is not reliant on iPhone sales to drive their FCF. This opportunity is one for those looking for a discount on a MAG 7. Just be patient! But be flexible and anticipate further disruptions.

Apple Surges 3% in Premarket Amid AI Optimism & Strong ForecastApple Inc. (NASDAQ: NASDAQ:AAPL ) has seen a notable 3.46% surge in premarket trading, defying concerns over declining China sales. The upward momentum follows an optimistic sales forecast, hinting at a resurgence in iPhone demand fueled by Apple's strategic adoption of artificial intelligence (AI) features.
Earnings Outlook
Apple’s latest earnings report revealed a nuanced performance, with robust overall revenue counterbalanced by a slight dip in iPhone sales. Despite a shortfall in China, where revenue declined 11% to $18.5 billion—falling short of the projected $21.57 billion—Apple’s services unit exhibited strong growth, climbing 14% year-over-year to $26.34 billion. This exceeded Wall Street expectations of $26.09 billion, reinforcing Apple’s ability to diversify revenue streams beyond hardware sales.
CEO Tim Cook emphasized that Apple Intelligence, the company’s AI-powered suite of features, is playing a crucial role in boosting iPhone sales where available. However, Apple’s cautious approach to AI investments, unlike its peers such as Microsoft (MSFT) and Meta (META), has insulated its stock from recent market turbulence. The restrained AI strategy aligns with Apple's focus on integrating AI within its hardware ecosystem, enhancing device functionality without excessive capital expenditure on data centers.
The company posted earnings of $2.42 per share on revenue of $124.3 billion, surpassing analyst expectations of $2.36 EPS on $124.12 billion revenue. While iPhone sales, accounting for nearly half of Apple's revenue, declined to $69.14 billion from $69.70 billion year-over-year, the broader growth trajectory suggests a potential iPhone rebound in FY26.
Technical Outlook
From a technical standpoint, NASDAQ:AAPL is demonstrating strong bullish patterns. The stock is currently up 3.41%, benefiting from the renewed confidence in its growth trajectory. Prior to this recent rally, Apple shares had experienced a 15% decline since late December 2024. However, the current price action suggests a recovery, with NASDAQ:AAPL reclaiming 10% of its lost value, forming a falling wedge pattern—a historically bullish signal.
The premarket surge sets up the possibility of a gap-up pattern at market open, a strong bullish indicator that could further accelerate buying pressure. In the event of a pullback, immediate support lies at the 61.8% Fibonacci retracement level, a key level that often dictates price reversals in technical analysis.
The China Factor and AI’s Role in Future Growth
While Apple’s sales slump in China remains a wildcard, analysts expect a recovery once Apple Intelligence is introduced in the region. The lack of AI features has been cited as a major reason for weaker-than-expected sales in the Chinese market. TD Cowen analysts predict that demand could rebound once Apple secures a local partner to facilitate AI integration, boosting sales in a highly competitive market.
Moreover, Apple's performance relative to its tech peers remains strong. In 2024, Apple stock surged 30.07%, outperforming Microsoft’s 12.09% increase but trailing Meta’s impressive 65.42% rise. Apple’s 12-month forward price-to-earnings (P/E) ratio stands at 31.12, compared to Microsoft’s 29.2 and Meta’s 26, indicating sustained investor confidence in Apple’s long-term growth potential.
AAPL Positioned for Further Gains
Apple’s ability to weather market challenges, coupled with its strategic AI rollout, positions it favorably for continued growth. The bullish technical setup, strong fundamentals, and AI-driven sales optimism indicate that AAPL could maintain its upward trajectory. Investors should monitor key support and resistance levels, as well as further developments regarding Apple Intelligence’s expansion into new markets.
With analysts raising price targets and market sentiment improving, Apple’s stock could be on track for a sustained rally in 2024 and beyond.

Sportradar Group (SRAD) AnalysisCompany Overview:
Sportradar Group NASDAQ:SRAD is a global leader in sports data and technology, providing cutting-edge solutions to sports organizations, media companies, and betting operators. Its proprietary data-driven insights are revolutionizing fan engagement, player scouting, and betting markets worldwide.
Key Catalysts:
Major League Baseball (MLB) Partnership Expansion ⚾
A new multiyear deal with MLB expands Sportradar’s services into player scouting, strengthening its role in sports analytics and talent evaluation.
Enhanced NBA Partnership 🏀
Sportradar’s deepened collaboration with the NBA introduces next-gen fan engagement tools, driving higher user interaction and new revenue streams.
Advanced AI-powered insights and interactive features elevate live sports experiences.
Strong Institutional Investor Confidence 📈
Institutional investors are increasing exposure to SRAD, reflecting confidence in its long-term growth prospects and market leadership.
Investment Outlook:
Bullish Case: We are bullish on SRAD above $17.00-$18.00, supported by strategic partnerships, technological leadership, and strong investor demand.
Upside Potential: Our price target is $28.00-$29.00, driven by expanding sports analytics capabilities, increasing adoption of AI-driven solutions, and robust sector growth.
⚡ SRAD—Revolutionizing Sports Data & Fan Engagement. #SportsTech #AI #FanEngagement

$VVV - Venice (AI gem)Technical: Log scale, 15m.
Break of descending triangle, 5 wave count, RSI bullish divergence.
Fundas: 25m circ, 100m total. Mcap: 250m, strong volume... listings with Coinbase and Binance futures already live. Staking and working product.
Eric Voorhees Founder/CEO
x.com
Ref link for their APP.
venice.ai
Price target of breakout - $44.35

Maybe it's time to revisit this chart along with $NVDAIf you bought NASDAQ:NVDA and you're nervous:
First establish why you bought it first place?
What was your trade plan at the time of the buy?
Where was the planned Take Profit?
Where was the planned Stop Loss?
Are you still strictly following that plan right now?
Did you buy it for short term hold or long term?
If you bought it for long term and it's still within your trade plan then why worry or even think about it?
If you bought it for short term then execute your trade plan, it's just a trade.
If you broke all your rules and it's way below your planned Stop Loss and now you're looking around trying to find people who are hyping it up trying to make yourself feel better - don't do that, those people hyping it up are in loss with you as well.
Check the image I added, detach yourself emotionally and review the chart to estabish where we might be position and what might come next then set up a strict plan to follow from here on.

Ray review analysis: can we wait for the second wave of rise?hello friends
Due to the good price growth of this currency, it has been placed in a range, and with the breaking of that range, a double bottom pattern has been created on the ceiling of the range, which can be expected to move up to the specified limits.
We can enter into the transaction with capital and risk management.
*Trade safely with us*
