Nvidia could still be seriously overvaluedIf the release of DeepSeek's AI models really is as disruptive as some suspect, Nvidia bulls could be seriously questioning if they want to hold onto the stock for the long haul. And that means some bulls could be looking to offload into a bounce while bears seek to fade into them. I highlight some key levels for bears to keep an eye on.
Matt Simpson, Market Analyst City Index and Forex.com
AI

New ai Model QWEN 2.5 could be catalyst for BABA - Target 200Baba just released Qwen 2.5, an ai model that is rated to be as good or better as DeepSeek and Chat gpt. This might serve as an additionally revenue stream to an already cheap stock. More importantly, it can serve as a catalyst to ignite investor interest and stock demand.
Currently around 10 pe (seeking alpha data), multiple expansion and eps growth could boost BABA into the 200s or higher given a long term outlook. While the US seeks many ai stocks at high multiple of revenue and earnings, chinese stocks are way cheaper and in theory have less price risk. However, they still have geo political and currency risks.
Baba has a large cash pile. This not only makes it slightly less risky, it also serves as potential ammunition for further innovation, acquisitions, or worst case, cash returned to investors.

2000 $CSCO vs 2025 $NVDA, is the similar crash possible?🚨 Could Nvidia be the next Cisco? 🚨
In 2000, Cisco dominated networking with its own chips. But competitors used cheaper, nearly as effective chips, and the stock dropped from $82 to $8 in just 2 years. Is the same fate possible for Nvidia?
Cisco invested heavily in its IOS CLI and aggressively defended it.
Nvidia did the same with CUDA, taking action against anyone trying to make alternatives.
But now, competition is heating up.
DeepSeek and other companies could lead those who over-invested in Nvidia chips on borrowed money to offload them, flooding the second-hand market with GPUs.
Meanwhile, the Magnificent 7 might slow down orders since they already have tons of Nvidia chips stockpiled.
Just like Cisco switches were 80% off in 2001, could we see a similar scenario with Nvidia?
And let’s talk about the $2000 RTX 5090 — would you buy one today?
Nvidia has committed huge resources to TSMC for chip production. They could be facing an overstock issue, and slashing prices could hurt profit margins. 😬
We will soon know the direction it will go, next few quarters will show us all.

swap 1ETH to AVER now Hidden Gem Alert: Promising Micro Cap Project 🚀
Stumbled upon an amazing micro cap project with strong fundamentals and massive growth potential. Perfect for those who spot opportunities before they hit the mainstream. 🚀🌕
Thank me later! 😉

It Appears as though the Bullish Wedge is our most probable playTrading Fam,
Time for my weekly update on the Bitcoin. A lot has occurred in the last week or so since I updated you all last, not least of which includes Deepseek AI FUD causing panic in the GPU and Power stock plays which has spilled over into our crypto space. But does this panic have merit or is this simply another retail bait, shaking out paper hands while whales continue to buy? The charts are showing me the latter is most probably true and news seems to support my thesis here as Michael Saylor and MicroStrategy acquired another 10,107 Bitcoin on the 26th of Jan.
Previously, you will remember that I had spotted a potential H&S on the charts and had posted a caution in this regard as it had potential to play out.
Shortly thereafter, I also spotted this bullish pendant at which point my bias became conflicted. Was Bitcoin going to pop or was it going to drop? We had to wait and observe further price action before it became clear.
It now looks like our bulls maintained the greatest strength as we bounced off or our neckline, and broke up above our bullish wedge, hitting resistance at 106K. We then formed another bullish pennant smaller in size, dropped from that quickly to perfectly retest the topside of our larger bullish pennant, and then came back inside the wedge for further consolidation.
If I am reading this chart correctly, our greatest probability now lies with the bulls breaking to the upside of the smaller wedge and retesting that 106K resistance level again. In time, I believe we'll break 106k to the upside and continue towards our target of 140k.
Why 140k?
When we broke above our bullish descending channel in Oct. of last year, we continued up until we hit a new high at 109k. This was our local top. We can now measure the distance from that break up (around 68k) to our new high at 109k. This same distance can be utiliized to give us a new target from our bullish wedge breakout. This fractal gives us a reasonable target of around 140k.
Hope this makes sense.
✌️Stew

NVIDIA (NVDA): DeepSeek’s AI Shakeup Sends Nvidia PlummetingNvidia is down an astonishing 15% in just a few hours. The primary driver? Fundamentally, the announcement of Chinese startup DeepSeek has sent shockwaves through the market. This previously unknown company reportedly holds a significant number of Nvidia chips and claims to have developed an AI superior to ChatGPT with just a $6 million investment. This disrupts the entire tech landscape, as companies like Google and others are pouring billions into AI research and development. The news casts doubt on the competitive edge of industry giants, and Nvidia is caught in the crossfire, given its strong ties to AI development and chip demand.
From a technical perspective, Nvidia recently respected the upper boundary of its volume profile but failed to break above it—a likely factor contributing to this sell-off, though the DeepSeek announcement remains the major catalyst. The price has now dropped back to the Point of Control (POC) at $120, leaving a significant gap behind.
While a complete gap fill would be surprising in the short term, it’s not out of the question. However, we’re not looking to catch a falling knife here. Given the uncertainty around potential developments with DeepSeek, caution is important.
Our current plan is as follows: We are keeping the stop-loss for our first position at $114.50 to limit risk. A second entry is being considered in the range between $111 and $106.70, as this aligns well with both the wave ((ii)) structure and the volume profile.
This plan is not yet finalised, as we’re closely monitoring how the situation unfolds. For now, patience is key, given the volatility and the ongoing uncertainty.

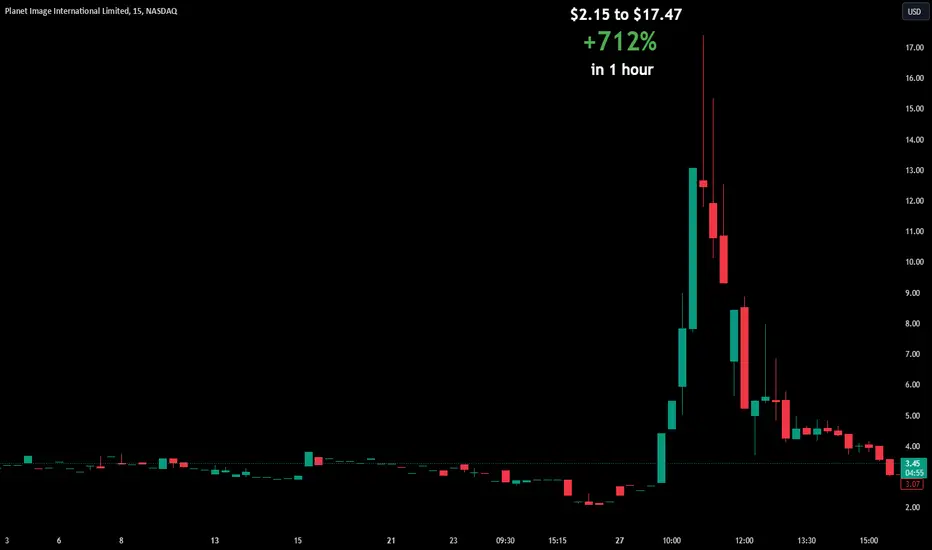
+712% in 1 hour $2.15 to $17.47 $YIBOWild moves in the markets today, this stock making the largest one which ended where it started.
That tells you profits must be locked, especially when huge percentages are reached 🎯
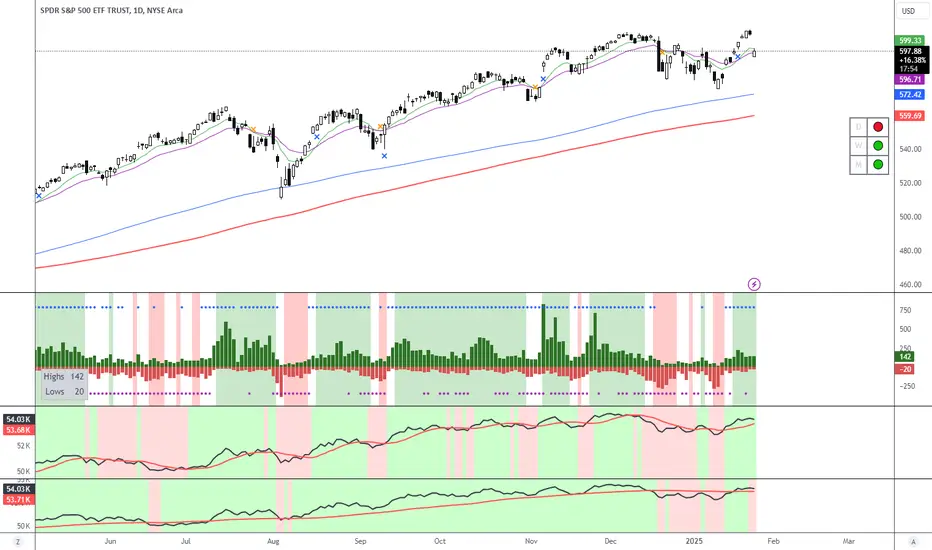
Nothing bad happendThe US markets fell sharply today. The S&P500 lost almost 2%. Many investors, especially on social media, are wondering whether the “Trump Rally” is now over. I think this is extremely unlikely. As is so often the case, markets tend to exaggerate, both upwards and downwards.
The price slide was triggered by news from China. Th AMEX:SPY ere, the start-up “DeepSeek” has announced that it has AI models that work just as well as their US counterparts at a much lower price and with less data.
This will certainly not have a lasting impact, but it should make us aware that the AI party will be over at some point.
Trading opportunity for ACTUSDTBased on technical factors there is a Sell position in :
📊 ACTUSDT
🔴 Sell Now
🪫Stop loss 0.238000
🔋Target 0.114000
📏 R/R 2
💸RISK : 1%
We hope it is profitable for you ❤️
Please support our activity with your likes👍 and comments📝

Hobo is Deepseek exposure: could run hard!The market has woken up to bad news from China with Deepseek. Not going into detail but its generally bad for semiconductors, especially NVDA - which is quite high priced (understatement).
Been looking for opportunities on the other side of this trade and found HOLO. They will be using DeepSeek R1 as the model for their holographic AI engine. Thing is: Deepseek is the hype (just like AI and Quantum was before) and HOLO is probably one of the few stocks that offers exposure AND its only sitting at a 33 million market cap. Jokes, much higher! First target: $7, if rally can sustain for multiple weeks: $18.
I literally just bought, i honestly dont care if it pumped 50% pre-market - its a sign of strength. Let's see, obviously a risky play but also makes a lot of sense. Chart looks good after a retest of previous resistance.

27/01/25 Weekly outlookLast weeks high: $109,555.48
Last weeks low: $99,643.66
Midpoint: $104,599.57
A new Bitcoin ATH as President Trumps second term officially begins! Just shy of $110K with a much tighter range of $10k from range low to high leaves Bitcoin in a very interesting place going into what has been called the first "pro-crypto" administration.
Now the weekly close is an interesting one as there is a clear sell-off that has continued at time of writing bringing the price down below the weekly low. This has been a common theme in recent weeks as either a bearish SFP of the weekly high early in the week resulting in a sell-off for the remaining days. Or the opposite were a sweep of the weekly low early on results in a recover rally for the rest of the week. As of right now the later is in play but what is causing this sell-off this time?
The AI issue:
The recent headlines have been that the US wants to win the AI war and be the dominant force in what is possibly the most important product of the future. OpenAI, Grok, Meta etc all have AI products and services and the US government hope that by backing these companies the US can be the victors of this race. However, the game has changed with the release of "DeepSeek R1" a chinese AI competitor with some remarkable attributes that has the US stock market very worried as reflected in the pre-market.
DeepSeek R1 was reportedly built for $6m, now this is a Chinese company and therefor any numbers should be taken with a pinch of salt but OpenAI has raised $17.9B for ChatGPT and many now see DeepSeek as a superior product in many ways:
- Less GPU intensive due to a more efficient and streamlined model, this is mainly why NVIDIA pre-market is down 11% at time of writing, investors are seeing that perhaps US companies have overblown the demand for GPU's as the product they are making is not optimised in comparison.
- Considerably cheaper due to this streamlined approach, personally this is a symptom of how America has been operating as a nation since the pandemic, a severe lack of efficiency made up for by throwing insane amounts of capital at the problem with no thought as to where the money comes from (printed via QE & tax payer funding). DeepSeek just proved why Trumps planned approach of getting value for money and increasing efficiency is a winning formula, anything else is unsustainable.
- Open source code, we would expect the company called OpenAI that was founded on the basis of transparency and the mission to do good as a non-profit would be the product that has publicly available code, but no that would be DeepSeek... This further compounds just how out of touch the US based AI companies have got, the quest for revenue has taken over as the mission goal, which in the case of AI is very dangerous.
To conclude the AI problem, the Chinese AI product is cheaper, more efficient and more transparent that current US based products and that is why indirectly BTC took a tumble.
On the data news this week FOMC is on Wednesday, the forecast is for interest rates to remain unchanged however the volatility of FOMC often leads to interesting price action, this could be another reason for the sell-off as de-risking takes place.
For this week I am looking at using the chaos to find goo d long entries, I still think that Feb-March looks good until I have reason to think otherwise. Weekly low is a key S/R level that will determine by bias in the short term until then.
TL;DR
- DeepSeek R1 worrying investors of US AI companies as the Chinese AI product is far cheaper, more efficient and more transparent. US stocks down on pre-market.
- FOMC midweek, first of Trump admin, volatility expected.
- Weekly low key S/R level for BTC

BFTD on $GAME AI AGENTGAME enables AI agents to function independently, analysing inputs and crafting responses while gaining insights from previous interactions. It boosts decision-making capabilities by utilising long-term memory, which encompasses experiences, reflections, and evolving personality traits. Through ongoing assessment of the results from actions and dialogues, GAME allows agents to enhance their understanding and elevate their planning and performance as time progresses.
Following an incredible surge in the crypto market, which propelled its market cap to an impressive $370 million, a golden opportunity has emerged to capitalise on the dip. This groundbreaking protocol is gearing up to reach a staggering $1 billion. Now is the moment to buy the dip and buckle up for an exhilarating ascent.

TradeCityPro | AIOZ: Harnessing AI in Crypto's Competitive Arena👋 Welcome to TradeCityPro!
In this analysis, I want to review the AIOZ coin for you. This project is one of the AI projects and competes with other numerous AI crypto projects.
📅 Daily Time Frame
In the daily timeframe, we are observing a ranging trend that is slightly accompanied by bullish momentum, and there is a possibility of breaking the range ceiling and becoming bullish.
🔍 Currently, the price has started a bullish trend from the low of 0.36363, reaching up to 1.20904, and is now in a correction and rest phase. The correctional range box is between 0.73691 to 1.20904.
📊 The support at 0.73691, which overlaps with the 0.382 Fibonacci correction, has created an important PRZ (Potential Reversal Zone). Currently, for the third time, the support at 0.73691 is being tested, and every time the price reaches this area, a volume of buying enters the market, and this time, as we are seeing today, a significant amount of buying volume has entered.
✨ The RSI oscillator currently does not have a specific trigger, and we need to wait until the price breaks one of the important areas. If the support at 0.73691 is broken, the RSI trigger would be breaking below 30, and if 1.20904 is breached, the trigger for this oscillator would be breaking above 70 and entering the Overbuy zone.
📉 If the support at 0.73691 is broken, the next supports are the 0.5 and 0.618 Fibonacci areas, with the 0.618 zone overlapping at 0.55669, which makes this area more significant. If this area is breached, it can be said that the bullish momentum is completely lost, and the price could move towards 0.36363.
🔼 The main support is at 0.36363, which is very important, and if this level is broken, it confirms a trend change. On the other hand, if 1.20904 is broken, it confirms the trend turning bullish, and we could witness the next bullish leg.
📝 Final Thoughts
This analysis reflects our opinions and is not financial advice.
Share your thoughts in the comments, and don’t forget to share this analysis with your friends! ❤️

Ethereum review analysis: buying points and price targets...hello friends
The analysis of Ethereum that we had given you, now we have specified for you step-by-step purchase limits, and the goals have also been specified, and you can enter with capital management...
*Trade safely with us*

RVSN | AI Tech for the Railroad Industry | LONGRail Vision Ltd. engages in the design, development, and manufacture of a technology that focuses on cognitive vision and safety system for the railway industry. It operates through the following segments: Locomotives for Shunting Yards, Locomotives for Passenger and Freight Trains, and Light Rail Vehicle. The Locomotives for Shunting Yards segment focuses on the sale of RV200 system to shunting yard operators. The Locomotives for Passenger and Freight Trains segment promotes sales to passenger and freight train operators. The Light Rail Vehicle segment are in the process of developing an LRV system that will be designed for the light rail market segment. The company was founded by Elen Katz, Shahar Hania, Noam Teich, and Yuval Isbi in 2015 and is headquartered in Ra'anana, Israel.

CONVO AI AGENT CAN return to its BULL trend.The Prefrontal Cortex Convo agent represents a cutting-edge AI designed for engaging and dynamic dialogues. It combines perception, long-term memory, and decision-making capabilities to provide tailored, context-sensitive replies. In contrast to conventional agents, it thoughtfully determines its responses, facilitating in-depth discussions, remembering details from previous interactions, and making independent choices.
At present, it supports over 200 agents and has successfully handled more than 1,000,000 requests within just the first two months.

AI Electricity demand powering up #NRG to $253NRG Energy, Inc. (NYSE:NRG) is a prominent energy and home services provider operating across the United States and Canada. The company is strategically positioning itself as a significant player in the AI sector, driven by its production and distribution of electricity, which is crucial for meeting the energy demands of both businesses and consumers in the AI realm. Remarkably, North America has experienced a spike in electricity demand for the first time in almost forty years. Larry Coben, the CEO of NRG, highlighted that the trends in electrification, along with the expected rise of generative AI data centers, indicate a substantial increase in power requirements. He noted that these trends are paving the way for the company to reach its goal of achieving 15% to 20% growth in free cash flow.

RENDER LONGRender is a Narrative AI that is suitable for us to enter Long, by looking at Elliot Wave 1-2-3-4-5-A-B-C, and Price Action where the chart breaks out from the Resistance Trendline and then Retrace.

RingCentral | RNG | Long at $35.17RingCentral NYSE:RNG analysis:
The Good:
Revenues grew every from 2017 (~$500 million) to Q3 of 2024 ($2.3 billion) and recently adjusted to a "beat" for 2024 as a whole.
Gross profit in Q3 of 2024 was $1.6 billion and has increased every year since 2019
Price-to-sales: 1.3x (industry average 5.7x)
Rising free cash flow
EBITDA positive at $190 million in Q3 of 2024
From a technical analysis perspective, my historical simple moving average has converged with the price which often leads to a future share price increase. However, it could trade sideways for a while before breaking through.
The Bad:
Competition, especially Microsoft Teams and other similar products in the market reducing or eliminating growth (although, this hasn't happened just yet).
Recent insider selling
Debt: $1.58 billion
At $35.17, NYSE:RNG is in a personal buy zone. If there is a dip in the price, I anticipate the price gap in the low $30's to be filled or in a dire situation, a drop to the mid-$20's.
Targets:
$40.00
$45.00
$50.00
$200.00 (if momentum kicks for a long-term outlook)

HolderStat | AI agents are your new profit 🤖 AI agents are artificial intelligence-driven programs that operate autonomously on the blockchain to analyze data and perform tasks.
Top AI agents:
1️⃣ VIRTUAL - a platform for developing and managing AI agents 🛠️
2️⃣ AI16Z - an AI-managed venture capital fund to which token holders can pitch projects for investment 💰
3️⃣ AIXBT - an agent that analyzes trends in crypto. Token holders can access the analytics platform, but beyond that, the AI agent runs the platform in X 📊
_____________________
👉 Want more posts? Like and subscribe to stay up to date!
Always DYOR! 🔬

SUI BUYhello guys
Considering the price correction, now is a good opportunity to buy in steps
Trade safely with us, we have specified the purchase range for you, as well as the targets.
*Trade safely with us*


Nvidia. Analysis and Price Forecast: A Strategic OutlookIntroduction:
Nvidia Inc. (NASDAQ: NVDA) continues to be at the forefront of the AI and semiconductor revolution, showcasing robust innovation and a compelling business model. This analysis leverages advanced tools such as TheWaved™ and utilizes VSA Analysis, Technical Indicators, Price Action, and Fundamental Analysis to craft a comprehensive forecast.
Recent Price Movements and Key Patterns:
1. Candle Pattern Analysis:
From the provided patterns sequence data:
January 13, 2025, 14:00:
Pattern: "Increased Buy Volumes"
Movement: +6.69% from open to close, suggesting strong buyer activity and market confidence.
January 10, 2025, 16:00:
Pattern: "Buy Volumes Take Over"
Movement: -5.7%, indicating potential sell-offs after profit-taking.
These patterns highlight the recent tug-of-war between buyers and sellers, creating opportunities for strategic entries and exits.
2. Key Levels and Trend Analysis:
From technicals:
Current Price: $135.19
Resistance Levels:
Short-Term: $139.48 (MA200 on the hourly chart)
Mid-Term: $141.15 (MA100)
Support Levels:
Immediate: $127.30
Key Support Zone: $123.69-$127.30
Nvidia's price is trading below critical moving averages (e.g., MA50 and MA200), suggesting a potential rebound or consolidation phase before further directional movement.
Multi-Dimensional Analysis:
1. Volume Spread Analysis (VSA):
Analysis: Strong buy patterns are evident, with significant volume upticks near critical support zones. This implies institutional interest in accumulation phases.
Prediction: Anticipate continuation of buying pressure if price stabilizes above $135. Resistance at $140 may pose challenges in the short term.
2. Fundamental Insights:
Nvidia’s Q4 earnings report showed record revenue driven by AI GPU demand.
Major customers in cloud computing and automotive industries continue to bolster growth.
However, rising interest rates and potential geopolitical risks (e.g., China’s tech policies) might pressure valuations.
3. Price Action Analysis:
Recent bullish engulfing candles near $127 indicate buyer confidence.
Price may revisit $130 before testing $140. Breaking $140 could pave the way to retest $150 (January’s absolute high).
Projections:
Short-Term (1 Week):
Target: $138.50
Stop-Loss: $132.00
Rationale: A breakout above MA50 ($136.93) will signal short-term bullish momentum.
Mid-Term (1 Month):
Target: $145.00
Stop-Loss: $130.00
Rationale: Stabilization above $140 supported by institutional buying and potential macroeconomic support.
Long-Term (3-6 Months):
Target: $160.00
Stop-Loss: $125.00
Rationale: Continued demand for Nvidia’s GPUs in AI and automotive applications combined with broader tech sector recovery.
Strategic Recommendations:
Support Levels:
-
1. 127.3
2. 123.69
3. 113.9
4. 90.4855
5. 87.88
Resistance Levels:
-
1. 127.3
2. 123.69
3. 113.9
4. 90.4855
5. 87.88
Powerful Support Levels:
-
Powerful Resistance Levels:
-
1. 89.599
2. 89.599
3. 63.974
4. 63.974
5. 48.462
Above $160: Consider reducing positions to hedge against potential market corrections.
3. Stop-Loss & Risk Management:
Strict stop-loss at $130 for short-term trades.
Trail stops to lock profits as price moves favorably.
Tools and Insights:
Analysis powered by TheWaved™, leveraging decades of professional experience and cutting-edge analytics. Key insights have been shared to align with both retail and institutional perspectives.
Call to Action:
For personalized queries or deeper insights into Nvidia’s price action, feel free to reach out via direct message. Explore our tools and indicators through the link in our profile.
Concept of Rays
Explanation of the "Rays from the Beginning of Movement" Concept
Core Idea
My proprietary analysis method is based on using rays constructed on Fibonacci mathematical and geometric principles. These rays create a system of dynamic levels that help predict precise asset movements and identify key zones where price interactions occur. Price interaction with these rays signals probable scenarios: either a reversal or a continuation of movement, but only after interaction and the appearance of dynamic factors and patterns.
Why Predicting Specific Levels is Not Possible
Financial markets are nonlinear systems, where price movement is determined by numerous variables, including market volumes, liquidity, macroeconomic factors, and participant psychology. Instead of attempting to predict specific levels, I propose analyzing probabilities of price reaction at pre-calculated key zones. Price interaction with rays provides additional insights into the direction and strength of movement.
Disclaimer: This analysis reflects the author’s perspective based on available data and does not constitute financial advice. Trading involves risks; ensure proper due diligence.
Follow TheWaved for more actionable insights!
