AI Generated Bitcoin Prediction: No ATH This Week! 📉 AI Generated Bitcoin Prediction: No ATH This Week! 🚫📈
Euphorisme is what traps people... watch out.
📌 Overview
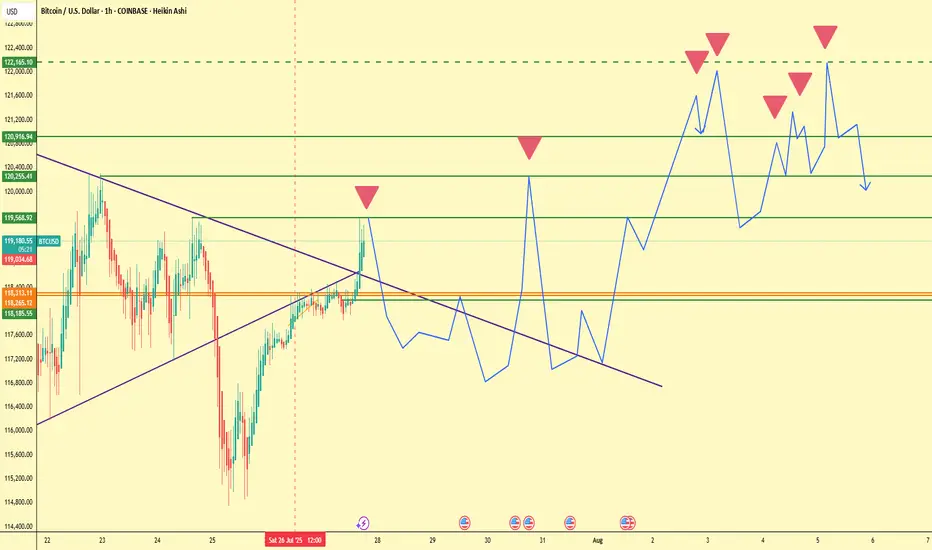
In this 1H Heikin Ashi chart for BTC/USD, a clear AI-generated prediction outlines a volatile week ahead, but with no signs of a new all-time high (ATH). While price action recently broke above key resistance levels around $119,300–$119,570, the projected trajectory is more cautious than bullish.
The blue line overlay sketches a speculative wave structure — an AI-based forecast — suggesting multiple failed attempts to break above $122,165, a level that coincides with previous rejection zones.
🔍 Key Technical Levels
Level Significance
$122,165 Major rejection level
$120,916.94 Resistance + liquidity zone
$119,568.92 Immediate rejection area
$118,313.11 EMA & SMA cluster support
$118,185.55 Short-term support
$117,893.78–$118,037.81 Bull trap range
⚠️ Why You Should Be Cautious
The AI-predicted price action shows a pattern of rising highs followed by sharp reversals.
Multiple red inverted triangles suggest lower high formations, a sign of weakening bullish momentum.
Current levels around $119,300 are still within a macro supply zone, with price likely to consolidate or retrace.
🧠 Psychological Trap: Euphoric Longing
Markets often punish emotional entries — and euphoric breakouts like we saw at $119,500 tend to trigger FOMO longs. This is where smart money exits, not enters.
“If it feels like you're late to the move, you probably are.”
🔄 Mid-Term Scenario
If the AI prediction holds:
Expect volatility with fake breakouts.
Watch for distribution near $122K.
A potential drop toward $118K–$117.8K may offer a better re-entry.
📆 Macro Context
The week is filled with economic events (marked below the chart), and the AI model seems to expect choppy reactions, not a clear breakout. These red calendar icons often correlate with increased volume and traps.
🧩 Strategy Suggestion
Avoid chasing pumps into resistance zones.
Wait for confirmation or deviation from the projected path.
Consider setting alerts near $122K and $118K to monitor key reactions.
🧠 Final Thought:
ATH is a process, not an event. If the AI is right, we’re not there yet.
“Let the herd long the top, and let you short the trap.” – Smart Money
💬 Share your thoughts below. Do you agree with the AI's prediction?
🔔 Follow for more predictive insights & logic-backed analysis.
#Bitcoin #BTCUSD #CryptoTrading #NoATH #SmartMoney #TradingPsychology #EuphoricTrap #HeikinAshi #BTCAnalysis
Aianalysis
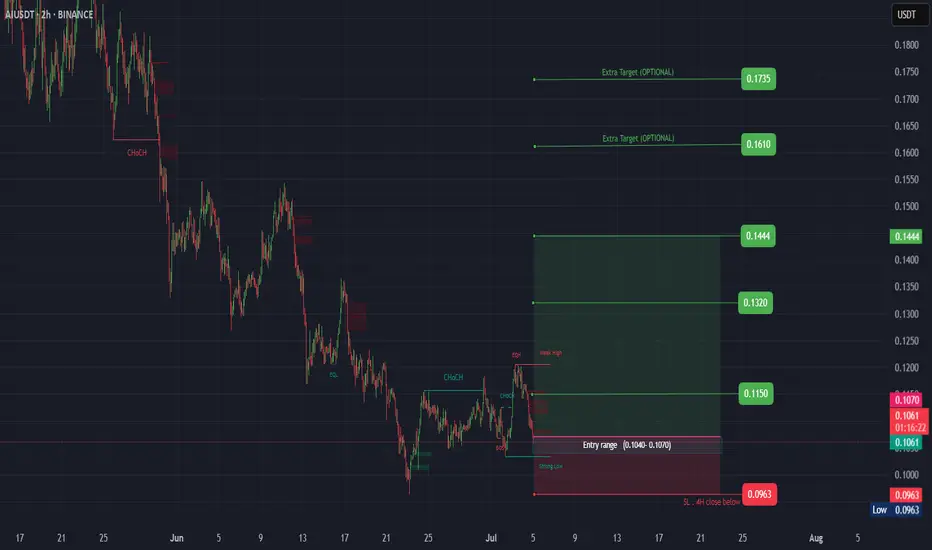
AI ( SPOT )BINANCE:AIUSDT
#AI/ USDT
Entry( 0.1040- 0.1070)
SL 4H close below 0.0963
T1 0.1150
T2 0.1320
T3 0.1444
_______________________________________________________
Golden Advices.
********************
* collect the coin slowly in the entry range.
* Please calculate your losses before the entry.
* Do not enter any trade you find it not suitable for you.
* No FOMO - No Rush , it is a long journey.
GBPCAD - Weekly Forecast - Technical Analysis & Trading Ideas!Midterm forecast (Daily Time-frame):
While the price is below the resistance 1.82310, beginning of downtrend is expected.
Technical analysis:
A peak is formed in daily chart at 1.82320 on 12/19/2024, so more losses to support(s) 1.79228, 1.78439, 1.76819 and minimum to Major Support (1.74790) is expected.
Take Profits:
1.79228
1.78439
1.76819
1.75765
1.74790
1.72705
1.70900
1.69267
1.67670
1.65599
1.63703
1.60894
Short-term forecast (H4 Time-frame):
A Head and Shoulder Reversal Pattern has formed and the neckline has also been broken.
Price is touching the neckline again.
It is very likely that the downward wave will start from this area.
__________________________________________________________________
❤️ If you find this helpful and want more FREE forecasts in TradingView,
. . . . . Please show your support back,
. . . . . . . . Hit the 👍 BOOST button,
. . . . . . . . . . . Drop some feedback below in the comment!
🙏 Your Support is appreciated!
Let us know how you see this.
Have a successful week,
ForecastCity Support Team

UK100 (FTSE) Weekly forecast, Technical Analysis & Trading IdeasMidterm forecast:(Daily TF)
The ascending flag taking shape suggests we will soon see another leg higher.
While the price is above the support 7911.37, resumption of uptrend is expected.
We make sure when the resistance at 8485.05 breaks.
If the support at 7911.37 is broken, the short-term forecast -resumption of uptrend- will be invalid.
A peak is formed in daily chart at 8385.30 on 12/09/2024, so more losses to support(s) 8083.43, 8007.24 and minimum to Major Support (7911.37) is expected.
Trading suggestion:
There is possibility of temporary retracement to suggested Trend Hunter Buy Zone (8007.24 to 7911.37). We wait during the retracement, until the price tests the zone, whether approaching, touching or entering the zone.
We would set buy orders based on Daily-Trading-Opportunities and expect to reach short-term targets.
Beginning of entry zone (8007.24)
Ending of entry zone (7911.37)
Take Profits:
8083.43
8183.03
8242.89
8380.25
8485.05
8664.21
8765.00
9000.00
__________________________________________________________________
❤️ If you find this helpful and want more FREE forecasts in TradingView,
. . . . . . . . Hit the 'BOOST' button 👍
. . . . . . . . . . . Drop some feedback in the comments below! (e.g., What did you find most useful? How can we improve?)
🙏 Your support is appreciated!
Now, it's your turn!
Be sure to leave a comment; let us know how you see this opportunity and forecast.
Have a successful week,
ForecastCity Support Team
