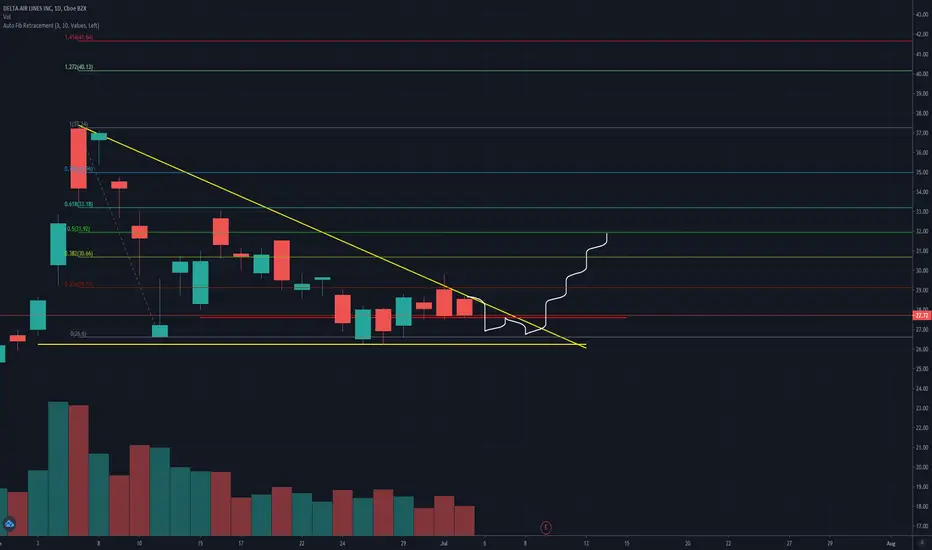
Delta Airlines , Short Position Two Zones To Sell , The stock is gonna collapse soon or latter , its just a matter of time.
Good Luck
Airlines

$AC.TO bounce off 4 Month ResistanceSince Covid dip, AC has been following this support line.
About to hit for third time.
Entry beterrn 16.03 and 16.24
Long long

American Airlines AAL waiting for lower lowStill think we haven't gotten to a wave C correction for this impulse. will reassess if it breaks above ~13.

AAL> hit major support
> made higher high
> anticipation of a higher low that will lead to expansion phase?
> wait for trigger

LUV before earningsSouthwest has continued to fly everday during this pandemic. On some flights carry less than 10 people at one time. Although the service has been limited the flights are starting to fill up slowly and surely and with the 737 max test flights starting again, that would bring a large portion of their fleet into service.

Delta EarningsThis next week we have earnings week and so we can start to see more economic data coming in from the 2nd quarter. Overall we can expect for price to remain within the range of standard deviations as there will be equal push and pull from both sides. Many investors have already priced in their anticipations about the sector.

DAL 30for whatever reason DAL is expected to beat their earnings predictions. This shows a bullish sign but not too bullish. most likely just the robinhood army taking the stock over for a bit. the robinhood army has dropped off a little bit but i am sure some how some way this thing is getting pumped back up before earnings. Would just run the rally on Friday or Thursday this week and hopefully if they beat earnings prediction on monday do the same. I am sorry this isnt as detailed as I usually am but The airlines are not my favorite atm.
this is not trading advice this is what I see.
The plane is preparing to take off!This deal is risky because of air industry, but i see very extra volume on the history bottom + RSI over sold.
I buy it on 10% from deposit.
Good Luck Have Fun!
Deal:
Buy: 10,5
Stop: 6.10
Take Profit: 21.9
Risk|Profit: 1|3


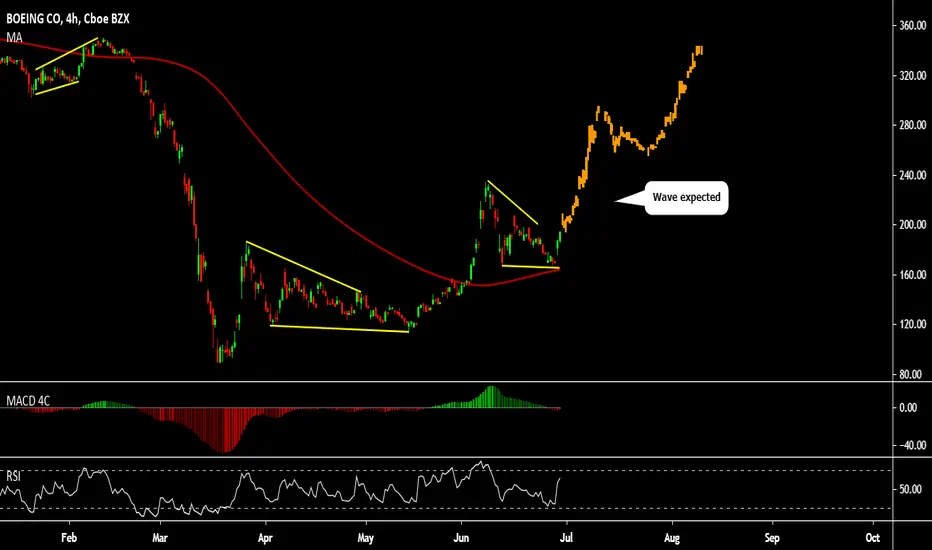
Boeing too big to fail?Its interesting looking at Boeing and only reason doing TA is cause fractional shares exist, but someone asked me if its possible for it to go back to 230. Now this stock might not be the biggest gainer, but atm its on its own path towards airlines stocks with American and Spirit in fight who is gonna win, yet it is possible for both to survive and if American airlines falls I would go United and Spirit. Yet we aren't hear to talk about Airlines in general, but boeing does make the planes.
News
-Boeing Ceo painted a grim future short term for Boeing and also suggested an Airlines isn't doing so great and could fall (maybe American or Spirit?), yet Boeing went up the next day with positivity coming out after negative nancy
-Boeing got permission to start building the next gen planes
-Earnings coming up (yet is the negativity price in?)
TA
-From what you see is a fib retracement from 230 to about 165, which it did double bottom and it broke out of a downtrend recently, yet has been going sideways in the red zone.
-If it does drop could see a decline around 5%-13% with worst case it going back to 145 with that being a 19% drop at current price. The 19% drop is a 38% drop from its high, which isn't alot for a crypto veteran, yet I think this company is too big to fail, so i suspect a 13% drop on worst case on earnings.
-The bullish upside is a 9% gain going back to around that 200 dollar level
-Looking at the MACD it looks bearish for tomorrow, yet again it is tighting with the vpvr around the price range we are at
-RSI is neutral, but trends to oversold. Again looking for a morning drop looking around that 176-174 range if it can hold it as shown with the vpvr going from 174-169
Final thoughts
I think this company to big to fail and will be interesting on how earnings will be with Boeing going back to production and getting a feeling that the government will back them up. Will i buy this stock? No cause I'm not looking for a 9% return on a trade and still think my NCLH postion is fine as CCL is struggling and RCL going alright (NCLH price target was raised from 12.50 to 19 today and it sits under that target as RCL got moved up, but its current price sits above it), yet I would maybe get in a small long postion on boeing with the upside looking good if the morning session pops.


$BA Earnings Option Play | WatchlistTechincal Analysis of $BA plus this week's option play.
British Airways finally receives its first Boeing 787-10 months later than planned.
What we are looking for:
Retest of the previous channel resistance (blue downtrend)
Breakout from $198 (Bullish Signal)
Last but not least, to send BA to the moon ($234), we need to breakout from the fat orange downtrend.
This play is intending for covid to not impact airlines. If covid makes a crazy breakout, we might see trouble for airlines.
The Play:
- BA ripped 14.4% today, which means contracts are worth 200%ish more than they were yesterday. In other words, we will aim to grab BA at the low of what looks to be next week or the week after.
Play 1:
- BA $232.5 call 7/24
This play is sitting up 114% on the day compared to the $230 strike below which is up 198% today. Once BA has a down day these premiums will get cut, giving us a buying opportunity.
DotcomJack | Easy Loot
Do Not Trade This!

BA BUY (BOEING CO)Hi there. Price is forming a continuation pattern to the upside. Watch strong price action at the current levels for buy.
Long term AIG Trade 30/06/20After a very successful day of trading for US airlines (the majors all between 6-10% gain), I expect LSE:IAG will follow this week and longer for a number of reasons.
Firstly, during the airline bubble on the 4th and 5th of June, AIG followed, but lagged behind, starting the fast increase in stock price on the 8th, following the normal trend of the UK market lagging behind/following the US. I suspect the same will happen starting from open partly for the same reason.
Boris Johnson announced towards the end of last week that UK travelers did not have to self quarantine upon returning from certain European tourist testinations. On top of this, coronavirus cases in Europe have continued to decrease making travel more desirable (bare in mind US airline stocks are increasing despite the sudden increase in coronavirus cases in the US).

June gains are gone...more downside?All the gain we saw in the powerful rise in early June is now gone. AC has been volatile in post-COVID trading & hasn't recovered much compared to markets. While shutdowns worldwide & low tourism have generally trashed the industry, AC is still operating their aircraft domestically and increasingly abroad, mitigating some of the heavy AOG costs that all carriers are suffering from right now.
Air Canada isn't going anywhere but it might take a while for airlines in general to recover - we may see more downside (red arrow) if markets in general suffer from wave 2/re-shutdown fears, or potentially a smaller rally sooner rather than later. Price movements are still big enough for swing trading & AC has shown some small rally patterns (green) with V-shaped dips (blue).
Watch for a break of the local RSI support, MACD divergence in either direction, or an increase in volume to point towards the next move.
In any case I expect a local low within the first week or so of July and an eventual long-term recovery that is definitely worth buying into even now.
For educational purposes only, not investment advice

AAL BUY (AMERICAN AIRLINES GROUP INC)Hi there. Price is forming a continuation pattern to the upside. Wait for the price to complete the pattern and watch strong price action for buy.

$AAL - Drop and GoThis week I have been following American Airlines closely. My past self would’ve been absolutely horrified with what’s being going on in the airline industry, but now that my mindset has switched towards a technical approach, I couldn’t be any happier. The airline industry has both, the volatility and volume, desired to enter a trade. Here are some of my observations and conclusions:
1 - AAL heading towards its support level, which is set at 10.24 based on short term projections of 100 bars. This means the stock is ready to fall at least an extra 20% from its current price of 13.01.
2 - Resistance level is at 28 based on the same projections from above. Great room for growth within the next 6 weeks, however my exit target is set at 15$ because I am working on reducing my holding periods.
3 - For the last 3 months, AAL (and to be honest every other airline stock) has had massive price movements of over 40% which I like because even if you don’t get to ride the full wave, a 10% return per trade is also great.
What will I do?
Entry Target - 10.30
Stop loss - 9.00
Exit Target - 15.00
Given my portfolio size, I will be purchasing 200 shares. If my trade goes well, I am expecting a $940 from a 2,060 dollar investment. Even though 940 dollars is not much, my goal is to become really good at getting a consistent return percentage per trade.
If my trade goes badly, I am expecting to lose $260.
What events am I am waiting for?
-For the current price to close below the lower bollinger band 20 day period using the 1 hour candle stick chart .
-For the 9 day moving average to cross above the 15 day moving average using the 30 min candle stick chart.
Any thoughts? Is someone else trading this stock? If so, what is your plan and what’s your strategy and exit target? I appreciate any comments from experienced day traders than can help me learn some new things.

$BA PT $145Things are looking choppy for $BA I can see us landing around $145 before we see the next reversal. GLTA and stay safe!

AAL Reversal AAL is currently in a downward trend, but I am thinking that there could be a reversal of the stock very soon. It seems like the recent down move could be to fill the two gaps from earlier in the month, so once that is done, the stock can move back up. There is a support level at 14.6 that has been retested several times: first on March 9th and during April, and now again in June. This combined with the recent news that Covid restrictions are being eased in a lot of states is positive news that could fuel a reversal in the stock price. The RSI indicator approaching 30 is another sign that AAL could see a bounce in the coming days.
I would love to hear feedback on my idea to improve future analysis and I am open to discussion about my idea or hear any constructive criticism.


SAVE: Strong Fundamentals, Bullish Technicals 1W (Jun. 19)X Force Global Analysis:
In this analysis, we take a look at Spirit Airlines, a company leading the ultra low-cost carrier business in the US. We explore the company's fundamentals, as well as its technicals to assess its bullish probabilities.
Fundamental Analysis
- Spirit Airlines (SAVE) has shown an extremely steady growth over the past years.
- Their revenue and net profit showed a steady increase throughout time
- However, as with most other airline companies, Spirit Airlines was also heavily hit by the Corona Virus (COVID-19)
- As a result, they have underperformed in terms of quarterly eps, in Q1 2020
- Nonetheless, as the stock market continues to bounce strongly, and the effects of the virus begin to mitigate, we see signs of a continued bullish rally
- With businesses slowly returning back to normal, given that Spirit Airlines' financials remain intact with the current upwards trend, we could anticipate higher returns this year, compared to last year.
Technical Analysis
- Technically, the stock is extremely oversold
- It has broken through the historical support at $33.13, testing new lows
- However, as it dropped so severely, it has dropped in a choppy manner, creating multiple gaps on multiple time frames
- The easiest to spot and refer to are the gaps on the weekly: there are gaps at $10.74, $40.42, and $51.95
- Prices have been trading under the Ichimoku cloud, indicating a bearish trend, for over a year now
- We have two significant resistance lines: the short and long term descending trend line resistances marked in a dotted red line
- The Relative Strength Index (RSI) is forming lower highs, as prices are suppressed by an external factor - the Corona Virus (Covid-19)
- However, the Moving Average Convergence DIvergence (MACD) has formed a golden cross, with immense bullish histograms, demonstrating momentum and strength in the bounce
What We Believe
Spirit Airlines is a rather unpopular stock, with surprisingly strong fundamentals and financials. Technicals demonstrate 3 main areas of resistance: at $33 levels where the short term descending trend line and historical resistance converge. as well as the upper span of the Ichimoku cloud. The second major resistance lies around $40-42, where the previous local high at the 0.618 FIbonacci retracement remains with the price gap. Lastly, there is strong resistance around $51-55 where the 0.786 Fibonacci retracement, and price gap lie, with the long term descending trend line resistance converging. Eyeing these three major areas of resistance will help investors enter positions based on confirmations provided by the trend reacting to these levels. Should we break the final resistance, it's highly probable that SAVE moves to retest all time high levels, and possibly even create new highs.
Trade Safe.

The Top 5 European Airlines - Drawdowns 18/02/20 to 18/06/20From the market top Feb 19th pre-Covid 19 to June 18th 2020.

