Southwest Airlines working on a year long breakout pattern$LUV weekly
An old chart from 2019.
Seriously? A year long c&h breakout pattern?
This will get juicy and likely timed with bullish $BA news.
New ATH's likely.
Gorgeous.
Airlines

JetBlue IdeaThe current fair value of the stock based on Buffets equation is just over $40 meaning there is a lot of room for the stock price to grow. Earnings was stong and price tested the new resistance of $20 and looks to be testing to make new highs currently. Looking for potential pullback or rejection of next level to enter in on a lower price.

Get out of crude exposure nowI believe that the NCOV virus (with an R0 of 2 and kill rate of 2-3%, incubation time of 1 week) threatens to spread worldwide AND SHUT DOWN WORLD AIR TRAFFIC and many countries may close off their borders. A single passenger jet flight consumes 36000 gallons of jet fuel, people will stop going to crowded areas and travel less, and trucks will stop running their normal routes. Even a few hundred flight routes being suspended would murder energy demand worldwide. Nothing short of a false flag event by the MIC can save the crude price, cut your losses or take profits now.

American Airlines: Buy opportunity on the 1W MA50 break out.AAL has completed 2 years since the January 2018 top. The downtrend since then has been non-stop and 1W even formed a Channel Down with the MA50 (blue line) acting as a Resistance and Lower High.
With 1W however turning neutral (RSI = 49.107, STOCH = 47.539, ADX = 14.260, Highs/Lows = 0.0000) after finding Support at 24.70 (has been holding since June 2016) and even making a Double Bottom there, and the RSI on a bullish divergence, we are expecting a strong bullish break out once the MA50 breaks.
We will buy on the break out and aim at the 1W MA200 (orange line).
** If you like our free content follow our profile (www.tradingview.com) to get more daily ideas. **
Comments and likes are greatly appreciated.

Finnair's support zone holding - BullishHello everyone! Time for free analysis! :)
Finnair has been downtrending for months now and by now we are able to trade the uptrend. In December Finnair was priced at 5.5€ and since then it has been uptrending. Support trendline has been strong and it has not been broken. When touched, it will go back up.
Today Finnair has been declining for 3.5%. Good opportunity to long.
Earlier in the chart I have analyzed Finnair's profit levels. (Unfortunately not in the picture).
The most common price channel on Finnair has been 6.87 to 7.515.
Here is what I suggest:
-Long Finnair.
First profit takeout: 0.236 fibo (6.410)
Second profit takeout: 6.820€
Third profit takeout: 7.15€
At best there is 18% upside.
Dark blue lines = low-point trendlines
Light blue = top-point trendlines
Feel free to leave comment! What do you think about Finnair's future?

Alaska Airlines 10 to 1 Risk to Reward TradeLow risk, high reward trade into Alaska Airlines. 2% risk for 20% reward using pitchfork analysis, moving averages, and time analysis.

Alaska Airlines looks ready to pop this weekAlaska is rated the second-best Airline, according to the Wall Street Journal. It is extremely undervalued, with a PEG ratio of about 0.5. News has been extremely positive for Alaska lately. In terms of technicals, Alaska looks to be right above a volume support and ready to bounce. Another way to play Alaska earnings is to diversify risk by buying the JETS ETF.
Even if it misses its earnings target this week-- and it has a history of beating rather than missing estimates-- it might get a bump from raising its dividend. Alaska was one of five companies named in a Barrons article today titled "Comcast, Valero, and 3 Other Companies Expected to Increase Their Dividends Next Week."
Options buyers have neglected Alaska, with most of the open options being puts, but that just means that the bullish fundamentals aren't priced in yet. I will go long on Alaska Monday morning.

AAL: terrible airline, good setup pre-earningsAmerican Airlines was recently rated one of the worst major airlines by the Wall Street Journal, and the news for the company overall hasn't been great. However, the technical setup looks fairly nice, with American near a support level and showing a long period of bullish divergence on the weekly RSI and MACD. It's got a 1.5% dividend yield and a really good valuation at 5.67 forward P/E.
AAL has earnings next week, and has generally tended to slightly beat analyst estimates over the last 8 quarters. An earnings beat for AAL could be the catalyst to send the stock into a new uptrend, especially if fuel prices continue to fall as the EIA predicts. Instead of playing AAL earnings, maybe consider diversifying your risk by buying the JETS ETF. Some other airlines, including Alaska Airlines, have similarly juicy setups and also report earnings this week.

Delta Airlines +12% - 90 Day StrategyBetween November 2012 and May 2014 Delta Airlines had a colossal run that took it from $9 to a staggering $42 dollars in a little bit under a 2-year period. Ever since, $Delta has continued to perform positively; well within the confines of a new channel that feels a lot like an extended ascending triangle maturing into its upcoming apex. This channel can be identified by the dotted lines in the chart. For 6 years now, $Delta’s behavior has been highly predictable much in thanks to market capitulation, quarterly earnings and a booming economy.
At this moment, I can identify a few factors that are making me confident to enter $Delta at its current price level with an initial target of $65.49 (or +11.17% of where it is now). Based on my trend analysis, I believe this price will be reached between the end of March and mid-April 2020.
Besides the trend analysis and tracing I’ve included in the chart, I’ve also corroborated my findings or projection with a confirmation breakout in the MACD on the weekly chart, as can be seen below as well as room for growth in the RSI before it reaches overbought territories.
Once my initial target has been met, a retracement to either the mid-channel support (yellow-dotted line) or the bottom of triangle can be expected. Re-entering at both of these levels is a good, smart way of averaging out your purchase costs before the next impulse begins.
Target: $65.49

U.S Dollar Based THYAO : LongWhen we look at the stock of Turkish Airlines (THYAO) on an US American Dollar based, we see that we are just above the support.
The stock has not been able to participate in the rally on the Turkish stock exchange for several weeks.
Today's U.S Dollar / Turkish Lira rate of sharp decline and the acceleration of the decline in Brent Crude Oil, I think we will make a nice opening and can head towards the target.
The analysis contains a valuable risk / reward ratio and may be less risky in the following parameters:
Risk/Reward Ratio : 1/ 2.5
Position Size : < %20 of Stock Portfolio and %1-%2 for Futures
Stop-Loss : 2.19
Target : 2.54
Regards.

JETS finally taking offAirline stocks have had a lot of bullish options interest for the last month or so, thanks to their attractive valuations (less than 10 P/E!) and strong earnings growth. However, the stocks have been unable to break out due to high fuel prices. With Iran conflict cooling and oil prices falling, the JETS ETF is finally gaining some momentum this week. Individual airline stocks such as JBLU and SAVE got upgrades yesterday, which should be good for the ETF's near-term performance.
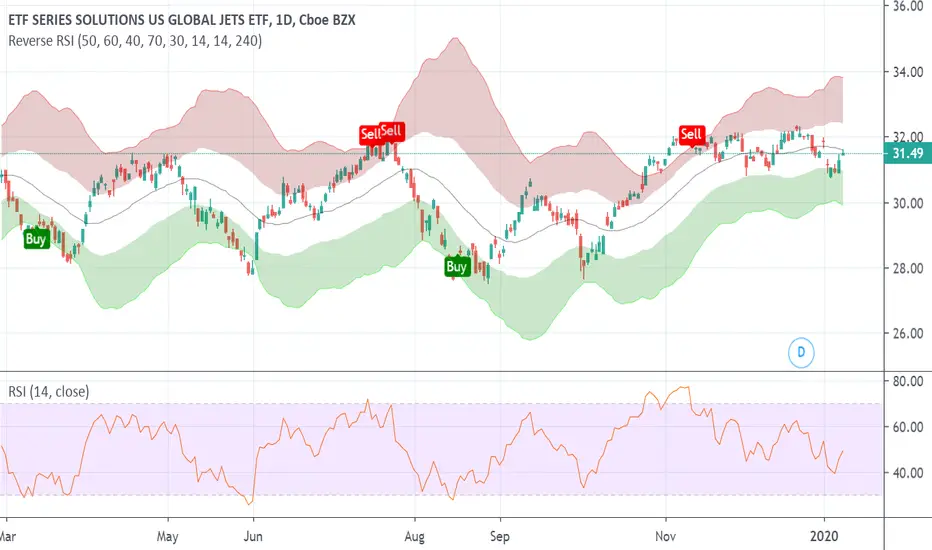
Bullish call activity in Spirit AirlinesSpirit Airlines (SAVE) is bouncing from 50 RSI today and getting unusually bullish call option activity. With a P/E under 8 and the earnings outlook starting to turn upward, the discount airline looks like a great value at the current price. If the earnings picture continues to improve, we ought to see $55 per share in 2020.

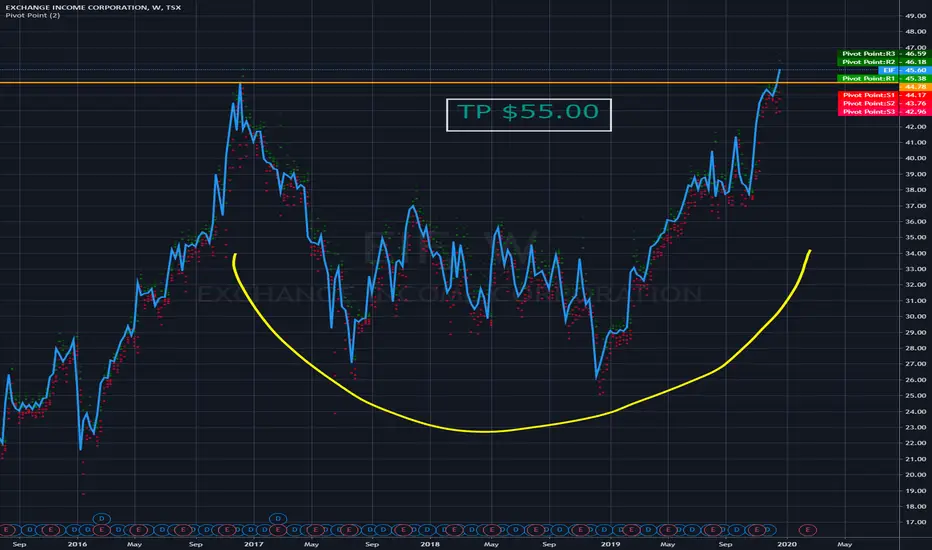
Exchange Income Fund: One of my Top Monthly Income StocksEIF is a rare stock where you get decent capital appreciation alongside passive income. Not only are these two factors attractive in itself, but they have also increased their dividend virtually every year for ages with no decreases.
Their diversified portfolio and continued record revenues makes this stock an amazing buy and buy off dips. There can be some pullbacks on dividend stocks so you never want to throw "in" all your cash at once.
Exchange Income Fund (EIF) and A&W Royalty (AW.UN) are two of my top monthly dividend stocks that have sound technicals and will continue to provide investors with strong value over the long-term. In my opinion these two aforementioned picks represent some of the top monthly dividend stocks both in the TSX and NYSE/NASDAQ; strong charts and a remarkable dividend hike history is exactly what investors should be looking at for passive income.
If you look around the market, monthly dividend stocks are very rare. Its even more rare to find monthly dividend-paying stocks that actually have "nice charts": these two are my favourites.
- zSplit
JetBlue BreakdownThe daily chart of JetBlue created a cup & handle type pattern but the price has broken down today out of the symmetrical triangle pattern it had created in recent days. The price has come close to touching my initial price target before finding some buyers again.
Note that the initial price target is near the 200-day EMA line as well, an important level for this stock to hold. There is not a lot of volume supporting the price before reaching the $17.30 price range should the price break its 200-day EMA.

Bullish options activity in Jet BlueOptions traders are betting heavily on Jet Blue today, with tens of thousands of call options located at the $20 strike. Perhaps options traders are betting on some holiday travel hype to boost the share price. Or perhaps they're banking on hype around JetBlue's investment in flying cars to move the stock. A drop in fuel prices after this week's oil inventory reports could provide a different sort of catalyst. Or maybe options traders are just betting on JetBlue's attractive valuation and analyst ratings, with a 9/10 summary score and an 82/100 valuation score. It seems there are a lot of good reasons to invest in Jet Blue. I've gone ahead and followed the trade, so we'll see where this goes.

Spirit Low?Spirit shows to be testing a similar low that it supported back in the start of 2018. Should we push up above the .236 fib level than id look to see a retest to confirm the bullish trend

AAL - Call Credit SpreadAfter AAL made a double bottom, it rallied to make a higher high and touched the 200 MA. Should've gotten into the rally. Missed it completely.
Anyways, AAL tried twice to breach 200 MA and failed twice.
Now it looks to be heading down to at least 27 or even further.
I'm already in a 31/32 Call Credit Spread @ $0.37 since Oct 30 which is now up 32% i.e. $0.25.
I'm going to take profit when AAL falls touches 27 or 50% of max profit is achieved on the spread i.e. spread is worth $0.18.

easyJet - Ready to take off again?Buy EasyJet (EZJ.L)
easyJet plc is a United Kingdom-based low-cost airline carrier. The Company operates as a low-cost European point-to-point short-haul airline. The Company operates through its route network segment. The Company operates on over 820 routes across more than 30 countries with its fleet of over 250 Airbus aircrafts.
Market Cap: £4.77Billion
Having completed a large inverse head and shoulders bottom in the middle of September the shares have been on a great run. The recent spike to highs of 1330p was met with some profit-taking. The correction lower has been quite shallow, and the price now appears to have broken higher from a pennant pattern. This is considered a continuation pattern and therefore the expectation is for further upside in the short to medium term.
Stop: 1171p
Target 1: 1383p
Target 2: 1505p
Target 3: 1600p
Interested in UK Stocks?
Join our free Telegram channel for up to date analysis on the best main market opportunities in the UK right now - t.me

Delta Airlines - Keep an eye outWe broke a long-term trend since the begining of the year.
Breaking $51.5 support line, could probably take us close to YTD low.
Monitoring closely.

IAG - About to flyBuy IAG (IAG.L)
International Consolidated Airlines Group, S.A. is an airline company that holds the interests in airline and ancillary operations. Its segments include British Airways, Iberia, Vueling, Aer Lingus and Other Group companies. It combines the airlines in the United Kingdom, Spain and Ireland. It has approximately 550 aircrafts to over 280 destinations. The Company operates various aircraft fleet services, including Airbus A318, Airbus A319, Airbus A340-600, Boeing 787-800, Embraer E190 and Boeing 777-200, among others. The Company, through its subsidiaries, is engaged in providing airline marketing, airline operations, insurance, aircraft maintenance, storage and custody services, air freight operations and cargo transport services.
Market Cap: £9.25Billion
International Consolidated Airlines share price has been hit hard over recent months. Following the sharp move lower we are now beginning to see the shares consolidate and potentially forming a bottom pattern. A break above the resistance at 4878p would confirm the bottom pattern and offer upside potential towards 560p. In extension of that, there is an unfilled gap at 643p, which may act as a magnet for the price over the medium term. The risk/reward is favourable from here.
Stop: 432p
Target 1: 560p
Target 2: 605p
Target 3: 640p
Interested in UK Stocks?
Join our free Telegram channel for up to date analysis on the best main market opportunities in the UK right now - t.me

Short Southwest Airlines to the Bottom of WedgeT1: 50
Could lead to a massive breakdown into the 40's

AAL buying for the LONG (2+ years)Buying at ~28.29. Take profits if we hit ~49.03
my fair value for this company is $31.00

AAL bounce to 28?looks like it wants to go to 28, above vwap with a similar setup than before when it gapped up previously. looks oversold
