Is Southwest Airlines a Hidden Gem?This is my first TradingView video, hope you guys enjoy! Be sure to leave a like, follow, and comment!
Southwest Airlines is a potential gem in this market as trade wars with China escalate. As Boeing ramps up production of their Max jets, Southwest also ramps up their flights as they are a primary user of the Boeing Max jets. Southwest did beat their earnings, however fell a little short on revenue, but if this is any indication towards Q3 earnings, I would feel bullish as these Boeing jets become more available. Southwest is also increasing their Hawaiian travel routes so this is great fundamental news for the airline!
The Megalodon indicator uses a machine learning algorithm, combined with data from over 500 buy setups, and over 2000 indicators to produce extremely accurate buy signals on any and all asset classes! You will also receive real time buy and sell signals for the stock market, cryptocurrency, as well as forex markets! We also completed our cryptocurrency automated trade bot. It trades for you, using our backtested indicator with phenomenal results! Click the link in my bio and try out the megalodon indicators today!
Airlines


$SAVE down 22% after earnings, long entry $43-46+Very short term trade, time 1-2 weeks. Closed my $50 Puts at $44, had a great earnings play betting to the downside. I'm going to use those profits to take a bit of a gamble and attempt to play the reversal.
Objective:
We're near multiple areas of support at $43, $42, $41, and the 1.168 Fib extension. I'm going long calls that have an August 16th expiration $45 strike. If this gets to $41 I'll buy the $42.5 strikes. 22% is overextended to the downside, and this company isn't going out of business anytime soon. I'm confident one of those will make a profit. Targeting $46-47.
Subjective:
I actually recently was looking at plane tickets (unrelated to this play) and Spirit Airlines has a new membership subscription program where you get perks with a $50 a year membership. Anything subscription based has been profitable across industries, airlines have all been screwing customers across the board (things that used to be free, you have to pay for/more now, because "F you what are you going to do about it"), and this company really loves to cut corners after dealing with their ticket buying system.


Airlines price targets - non-MAX operators BULL** Credit Suisse says non-MAX operators such as Delta Air Lines, Spirit Airlines, JetBlue Airways and Alaska Air Group to benefit most from reduced supply levels in the form of higher load factors and fares
** LUV and AAL combined have the highest exposure to MAX fleet in U.S.
-------------------------------------------------------------------------------------------------------------------
Price targets / analysts:
CS downgrades American Airlines Group Inc to "underperform" form "neutral", cuts PT to $30 from $32, citing extended grounding's of MAX jets and ongoing mechanics labor dispute
Cuts PT for Southwest Airlines Co to $51 from $53, while also lowering 2019 EPS estimate to $4.07 from $4.45 due to the airline's inability to capitalize on market demand
Upgrades JBLU to "neutral" from "underperform", raises PT to $19 from $16 due to strong seasonal leisure demand and continued execution of cost and revenue initiatives
Raises PT for United Airlines Holdings Inc to $113 from $111 despite its smaller MAX exposure compared to LUV and AAL

JETS ETF near resistanceThe JETS airline ETF has been soaring lately on upward guidance revisions from Jet Blue, Alaska Airlines, and Delta Airlines. It is above its MACD signal line on both its daily and weekly charts.H
owever, the ETF is approaching historical resistance at 31.50, and rising crude prices mean that the airlines may take a hit from fuel costs and may not achieve their revised guidance targets on earnings reports. Overall, this sector is strong but carries some risk of a reversal in the near term.

Global Financial Engineering Swing Trading Strategy for AFGlobal Financial Engineering Swing Trading Strategy for Air France(AF) as at July 2, 2019
The Primary Trend (PT) given by the Monthly TIME BAR ( MTB ) is currently Bearish
The Secondary Trend ( ST ), given by the Weekly TIME BAR ( WTB ) is currently Bearish
The Medium Term Trend ( MTT ), given by the Daily TIME BAR (DTB) is currently Bullish
The Short Term Trend ( STT ), given by the Four Hour TIME BAR (FHTB) is currently Bullish
In light of the above trend analysis and other factors we will start a bullish trade using Global Trading Strategy #3 on the Global Automated Trading System #3 which trade in the direction of the Global Daily TIME BARS (GDTB) which is currently Bullish. We will also adjust our normal position size and increase the Global Stop Loss Allowance to two(3) times the Daily Average True Range(DATR)
Global Entry Signal: Buy @$8.46
Global Stop Loss: $7.60
Global Target Profit: $17.00
Global Trade Management Strategy: We will applied the Global Trailing Stop System for Global Position Trading Strategy #3
--------------------------
The analysis in this material is provided for information only and is not and should not be construed as an offer to sell or the solicitation of an offer to buy any security.
To the extent that this material discusses general market activity, industry or sector trends or other broad-based economic or political conditions, it should not be construed as research or investment advice.
To the extent that it includes references to specific securities, commodities , currencies, or other instruments, those references do not constitute a recommendation by Global Financial Engineering,Inc. to buy, sell or hold such investments.
This material does not and is not intended to take into account the particular financial conditions, investment objectives or requirements of individual customers.
Before acting on this material, you should consider whether it is suitable for your particular circumstances and, as necessary, seek professional advice.

Descending Triangle for American Airlines? (AAL)Price action seems week and not convincing that it would break out. Appears like a descending triangle formation. #aal #americanairlines #short

ICAGY short-term short play -- currently near channel topICAGY is a great value stock, and I've been watching for a turnaround for a long time. It's got excellent analyst ratings, a good dividend, and a great P/E.
Unfortunately, it's been in a downward trend for months and is likely to continue downward until a significant catalyst such as a beat on the August 2 earnings report.
It got a bump a couple days ago when it announced a big order of new Boeing jets, but this only pushed it to the top of its channel. With a lower high and bearish divergence on the MACD, I expect a turn downward toward channel bottom on Monday. The alternative is upward channel breakout, which is unlikely but would be nice.
Sidenote: ICAGY always does really well in November, leading up to its dividend payout, then drops hard on the ex-dividend date. That'll be a good month to go long on this stock, if not before.

NASDAQ:AAL American Airlines - I like where it is sitting here NASDAQ:AAL sitting comfortable inside the falling wedge. I am expecting/hoping for an upside break. Conservatively, I am targeting $40 if AAL breaks out of the wedge. Otherwise a correction to $29 invalidates this outlook.

Short at $400short the dead cat bounce. the $450 short from $300 christmas low was also easy money.
look for this to print a collapse chart similar to facebook after its $220 parabolic bubble blowoff

AAL: American Airlines might have bottomedNASDAQ:AAL might have bottomed. And if it falls further, it means trouble for the airline and everyone as well. The chart looks good by the way. Indicators are turning up and if you are looking to hold for long term, catching the falling knives at these levels might be a good bet. I am targeting $40 if the falling wedge breaks upwards. Otherwise a fall below $27 invalidates this outlook.

American Air (AAL) Sell $33.67 > $30.62 (Profit:Risk = 2:1)NASDAQ:AAL
American Airlines Group, Inc.
Information:
Growing Channel was broken. Now we have formed a bear channel. At the opening with a small pullback considering sales.
SPY/SPX/S&P 500 in the coming days may show weakness and fall on the mini correction (Gold is now in a growing local phase).
According to the volume profile, we will have to preserve the main savings for the subsequent fall down.
Today we expect reports.
About stop loss:
Stop loss for the top $35.27. Can be reduced, but given the day of the report. I reduce volume of the position stop loss a little more is obtained.
------
Sell Limit = $33.67
Take Profit = $30.62
Stop Loss = $35.27
------
Profit:Risk = 2 : 1
Profit:Risk = +9.06% : -4.75%

LUV on WatchHard to miss this massive head and shoulders pattern forming. Has bounced between two chop zones, but looks weak.
May target: 48-49

Alaska Air Group, Inc. - Looks Juicy to take a Long Position.Looking over the one week chart we can see that a bottom might be in and indicators suggest that we're in for an uptrend. Furthermore, we seem to have a prime catalyst with earnings coming up - any stroke of good news and guidance could send this thing higher. Expect a peak if other airlines do well in the coming weeks also.
RSI: Shows oversold on the weekly
Momentum: Showing that its currently trending to the upside.
MACD: Shows that we might be looking at a cross in the coming weeks making for positive upside in the future.
Will keep this updated.

DAL: Fly the Earnings Friendly SkiesDAL is in the midst of a uptrend that will be setting higher highs. They beat on earnings as a player in the airline carrier industry while Boeing and Spirit Aerospace and Airbus and other aerospace manufacturing stocks are taking a beating from a combination of the 737 Max crashes and resolution process as well as President Trumps talk of taxes on the European Union from their backing of Airbus with subsidies.
Delta's already been riding high on high expectations from those holding, to expect a little profit taking from the short term holders scared of a recession, but I expect their uptrend to continue. There was a slight dip yesterday due to background beta activity of the entire market dipping a few percentages, but it's just going to act like pulling down on the plunger of a pinball machine.
For technicals, everything is strong. They're above the 200 day average but not so high that I expect a fast reversal. ADX and DM+ are showing a strong upstrend forming over the last week or two with a likelihood to continue onward. RSI is a little high already in the 70s, but I expect it to either hit or come close to 90 before any stagnation on this current earnings reaction. They're walking up the upper Bollinger band right now and it should widen up quite a bit before narrowing again when the holders decide if they're in for the short or long haul. Also, the 20 day average has begun to cross the 200 day, and the 50 day average is quickly closing up behind it as well.

American AIR (AAL)(NASDAQ) Sel $33.45 >>> Target $31.45NASDAQ:AAL
American Airlines Group Inc. (AAL)
---
Sell - $33.45
Take Profit - $31.45
Stop Loss - $34.45
------
Take Profit = +5.98%
Stop Loss = -2.99%

Delta riding below previous supportDelta did a slight drop below the 57.49 support. It has created a new horizontal support at 56.96.
I'll do a more in depth update later.

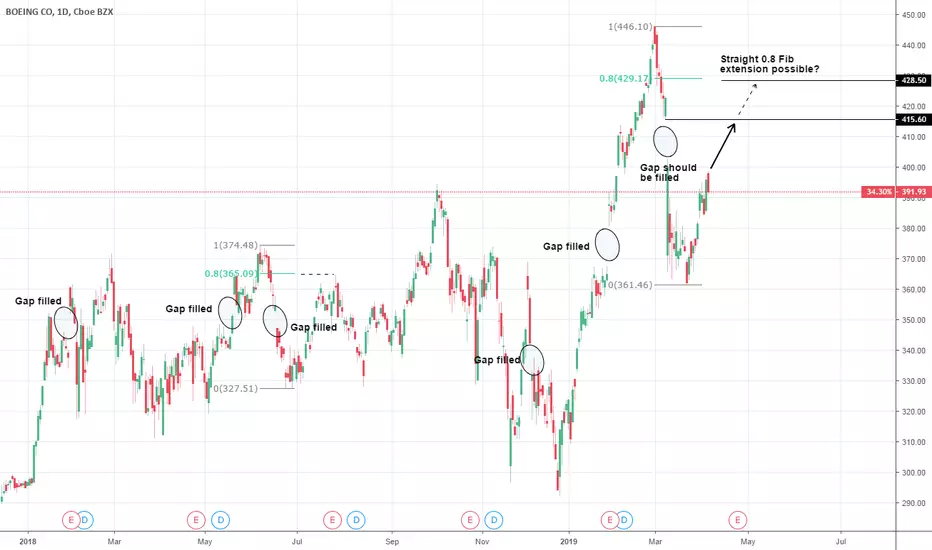
Boeing: Will it fill the Gap next week? What's next?It's been a month since Boeing's share started taking hard hits following the crashes of their 737 MAX aircrafts that gained a lot of unfavorable media exposure. The biggest hit was the March 11 1D candle that left a big $13 Gap.
The recent (since 2018) price action on BA shows that every 1D Gap (either bullish or bearish) was filled. So in technical terms one can view the recent 361.50 bottom due to the 737 MAX crashes, as a technical filling of the January 29 - 30 Gap.
It is reasonable to expect that the 737 MAX Gap will be also filled so our target is now 415.60. The question that remains is what is next for BA? Based on a similar price action during May - July 2018, we may see a 0.8 Fibonacci retracement at 428.50 as a temporary top. Then depending on the price action, the situation needs to be reviewed as with this kind of volatility on the monthly chart (ATR = 53.0614) despite the obvious long term uptrend (RSI = 62.909, MACD = 47.210, Highs/Lows = 8.9928), anything is possible. The goal for investors is to take advantage of those Gaps and primarily buy the dips.
** If you like our free content follow our profile (www.tradingview.com) to get more daily ideas. **
Comments and likes are greatly appreciated.
Delta looking bearishAs predicted in my last Delta post, we had major gains today. But alas, it is looking slightly bearish as of this post. If we close below the bottom of the fan/resistance line we will be looking for a possible dump.

Look for gains in Delta (DAL)When you look at Delta (NYSE: DAL), you see a clear resistance but a triangle pattern. When adding a pitch fan you clearly see obvious tests of both the resistance zones. With the gains and natural consolidation you see clear bull flags everywhere. Gains are expected to rise at the beginning of trading at 6:30 AM PST. If I were to guess they will occur around 7:15 AM PST. Major changes (in relation to breaking resistance zones/trends) will end FOR SURE at 8:30 AM PST.


United Continental Holdings Inc (UAL) - Head and Shoulders SHORTAirline stocks have been poor performers, despite the short term pullback in crude oil recently experienced.
UAL's peers seem to be in an downtrend and with the formation of the head and shoulders formation, any break of the neckline would indicate a short.
Additionally on the chart above we have the MACD turning negative , RSI falling and a daily squeeze pushing to the downside.
Previously similar price action has played out with price breaking from $86.00 and finding support at $78.00
