Air Canada Stock PricesThis chart follows the decline of Air Canada stock through 2015 and into 2016.
Airlines


VA short play on weeklyvolatility in oil and the recent sell off in oil is causing airlines stocks to be volatile as well.
VA is an undervalued stocks by many metrics, however technical analysis showed the lack of demand from this stock.
Combining the rising wedge, bearish divergence, and market volatility, I am expecting a decline over the next few weeks.
However, if it breaks it's a different story. Does anybody want me to calculate a price target?

Alaska Air Group - Anatomy of a BubbleAlaska Air Group displays clear characteristics of a bubble, more precisely of a bubble preparing to burst. On the wings of a 6 year old bull market and more recently fueled by cheap oil prices this stock was propelled from 2.53$ in 2008 to 82.78$. The stock rose more then 30x from the low or as Peter Lynch would say, for those that bought it at those prices it became a "30 bagger". With the whole stock market weakening recently and especially the transports coupled with what I think is a bottoming process in crude oil I feel that Alaska Air is slowly losing the air beneath is wings.
The technical picture adds weight to this assessment with a daily and weekly RSI divergence (displayed on the chart on the right) plus I think ALK's chart is eerily similar to gold's chart in September 2011. Therefore it is likely that the future development of the chart is going to be similar.
I suggest shorting the stock with a weekly stop above 83$. The target is the 40-45 area with partial profit taking around the 60$ area. You may also try and buy a couple of out-of-the-money put options and see if you can catch a potential sharp move down and profit from the tail risk. Be careful though, earnings are on 10/22 so keep your position small and set your stop wide enough so you can weather the volatility.
Whoever chooses to go with the trade good luck.
For a full list of instruments traded in the lifetime of the portfolio and for performance go to the Performance section: www.highprotrading.com

AALThis is American Airlines, not my favorite sector but a good breakout, the only issue so far is volume is not huge. Potential run higher and looking at the options the Jan 45c are 3.65 with a break even of 48.65 by Jan 16.

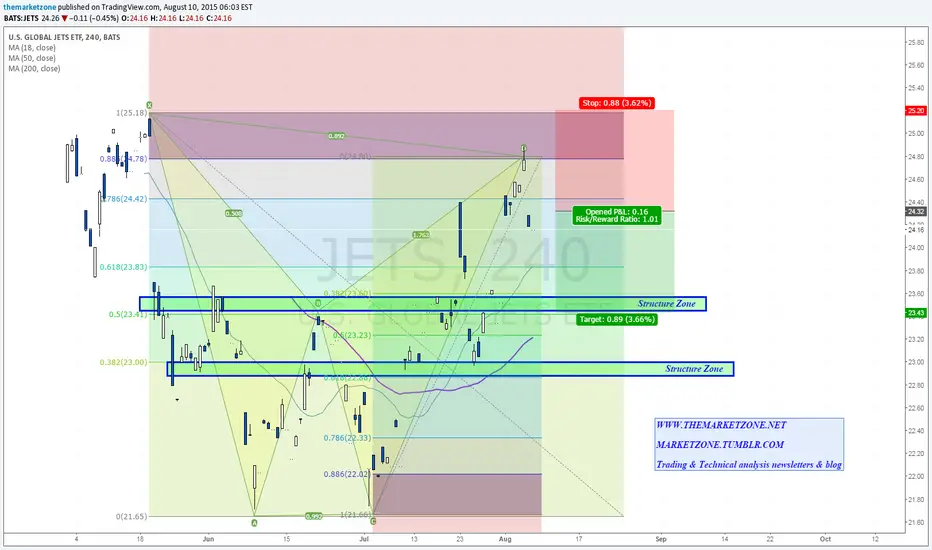
Is it going to run out of Fuel? Bearish Bat completionWith the drop in oil prices, $JETS, the new ETF that holds airline companies like Delta ($DAL), American Airlines ($AAL) and southwest airlines company ($LUV) had a very nice rally during the month of July.
The $ETF rallied all the way up to the 88.6 Fib level to complete a bearish Bat pattern and declined from there.
The pattern's targets are 23.5$ and 23$ which also come with daily support zones.
The current price level offer about 1:1 R/R ration for the short position with stop loss above X and 23.5$ as initial target zone.
This might work with the bullish scenario I posted earlier for oil
Buy VA at breakoutBuy at the breakout with volume and this stock eventually has room to run, but watch earnings

JBLU LONG lots of support Stochastic s turning up JBLUE is holding this Trend-line support watch the levels 19.50-20 buy zones. The airlines are all hitting the buy levels. I cant stress enough, traders must learn to BUY the FEAR and SELL the GREED. Always have a plan and always have a stop. understand your parameters and you will do well.
KEEP IT SIMPLE TRADE LEVELS

$SAVE in a bullish wedge?Great uppward support line since last May, except for when it was oversold in October due to ebola scare. Downward resistence line since December forming a wedge pattern. I believe Spirit Airlines will test 80.00 one more time before eventually breaking through the wedge to all-time highs around 85.00.

Flying Mexican CigarsIf you've ever taken an inter-city coach ride in Mexico as I have, you'll know that the country is crying out for an alternative way to travel. VLRS (aka Volaris, ultra cheap airline) is making an excellent recovery from its lows and I feel that in time it's heading back to the post IPO highs of $15 and more. I made a losing trade on this one last year but I can't allow that to cloud my judgement. My stop is $9.10.

AAL - A Chart Requested With MannersI will start by saying that I believe manners are important. It is a shame that so many people have forgotten they exist.
I want to thank the requester of this chart, a complete stranger, for using his manners :)
Let's move on the the request for a chart of AAL.
Back in late 2013, AAL (the stock) was just getting started. The stock created a double bottom in the first month. After that it was off to the races. All the green circles on this first uptrend line are places you could have began a position or added to your position. Notice the two red circles at the top of the uptrend line? Those are there because I would say that is where the downtrend begins.
The first red circle is the first time AAL "closed below" this "adjusted" uptrend line. It only took AAL two days to get back above the uptrend line. This action kind of negates the fact that it closed below. But those of us who watch stocks know this may have been a precursor for things to come. The second red circle is when the downtrend actually begins.
AAL stayed in this downtrend for about three months. There were several places you could have gone short if you short stocks.
In October of 2014, AAL gapped up over the downtrend line. From there it ran all the way to the old highs of about $44.50. It danced along the resistance line for several trading days before gapping up again. This time the gap up led to a choppy mess. But there is no way you could have seen that coming.
After the second gap up, if I was making good money in AAL, I would have adjusted the uptrend line to where you see it on the chart. The original trend line would have been steeper. It would have touched the bottom of the candles just before the gap up over the resistance line at $44.50 ish. This adjusting of trend lines isn't for everyone. I will do it if I think a stock may continue higher AND I am already making a fair percent return on my original investment.
At the top of the uptrend line you will notice a red circle. This is the first time there is a close below this uptrend line. Even though AAL wound up going higher from there after a pullback, I probably would not have been involved. I am pretty consistent about getting out of the way when one of my trend lines is breached.
At the all time high (January 2015) you will notice another red circle. This is really where the downtrend begins. I only know this because time has passed and there are more candles to evaluate. In February you will notice another red circle. AAL tried to rally back to the all time highs and failed. This failure allows me to draw the downtrend line. I extended it to the extreme right side of the chart because I would say price is following this downtrend line for now. I like to say the downtrend line is in control at this point.
Notice the word "wedge" on the chart? AAL will break out of that wedge at some point. Either above the downtrend line or below the support line at $46 ish. When the price breaks the wedge & closes outside the wedge, you can follow it if you choose. The chances are good that the stock price will continue in that direction.
I hope this chart helps. Thanks again for requesting it.
I Want To Draw A Chart For You!
Put your requests for a chart in the comment section of this idea. I will post them as I have time.

DAL- The Most Fundamentally Sound Airline DAL is hands down my favorite airline stock. I can't justify executing a long position here as the risk is to great for me right here. I'm a buyer at 42, I'm a thief at 38. But with oil plummeting, it wouldn't surprise me to see DAL hit 55 before pulling back any significant amount. DAL sits atop of my watchlist

Bullish On Airlines? Kiplingers had an article on airline stocks that opened with "There's an old wall street joke about how to end up with $1 million worth of airline stocks...Start with $10 million."
"In 2000, nine airlines controlled about 80% of the U.S. markets. Today, just four companies control about the same percentages."
Looking at the major players American Airlines presented the best opportunity for a cheap buy on the pullback. Looking at the technicals, what we have here is a potential Gartley and Bat pattern completion which also lines up with a 61.8 Fibonacci retracement from this stocks all time lows.
Long-term I'm still cautious about ever being too bullish on airline stocks because of the numerous factors that can affect them but as a trader, if you're looking to get long this looks to be a prime area.
Akil

UAL is curling down This airline company found strong resistance zone at $48-$49. Bounced off it very agressively with gap down zone from $44 to $45 which is powerful sign that sellers keep control on price.
From fundamental point of view there is tension in Iraq - one of the biggest supplier of Oil in the worls. Break in supplies leads to higher prices and then higher costs for transport companies.
It pulled back to moving averages zone and now is curling down. You can put feeler here and on break down and close below $41.60 low.
Potential Target could be reversal point from April 28 at $38.

Still loven' LUVFinally made it over trend resistance and into what I hope is a new bull session.
The technicals aren't perfect, but history doesn't care. Still up in all time highs with more room to grow, if patterns stick I'll have more option money in June.
I think it's possible we could drop back into the previous zone, the volume is not yet there and I'm interested in what Friday may hold before going full throttle.
I'd also recommend generally ignoring the latest news on Southwests' Advertising faux pas p.pw , definitely doesn't look great, I don't think it'll really effect share price.
Id addition, The Street analysts are generally bullish;
"The stock currently has a dividend yield of 0.93%. The company has a P/E ratio of 21.7. Currently, there are 9 analysts who rate Southwest Airlines a buy, 2 analysts rate it a sell, and 2 rate it a hold." p.pw
Set your stops and hope for a Redbull (punny!).
- - - - -
All opinions expressed by Emuffn3 on this website are solely Emuffn3’s opinions and do not reflect the opinions of TradingView, or their affiliates. You should not treat any opinion expressed by Emuffn3 as a specific inducement to make a particular investment or follow a particular strategy, but only as an expression of his opinion. Emuffn3’s opinions are based upon information he considers reliable, but neither TradingView nor its affiliates and/or subsidiaries warrant its completeness or accuracy, and it should not be relied upon as such. Emuffn3 is not under any obligation to update or correct any information provided on this website. Emuffn3’s statements and opinions are subject to change without notice.
Past performance is not indicative of future results. Neither Emuffn3 nor TradingView guarantees any specific outcome or profit. You should be aware of the real risk of loss in following any strategy or investment discussed. Strategies or investments discussed may fluctuate in price or value. Investors may get back less than invested. Investments or strategies mentioned on this website not be suitable for you. This material does not take into account your particular investment objectives, financial situation or needs and is not intended as recommendations appropriate for you. You must make an independent decision regarding investments or strategies mentioned. Before acting on information on this website, you should consider whether it is suitable for your particular circumstances and strongly consider seeking advice from your own financial or investment adviser.
Cheers!~
& Happy Trading!

Trader thinks DAL can trade through its 52 Week HighDelta Air Lines, Inc. provides scheduled air transportation for passengers and cargo worldwide. Today a trader bought over 2,000 5.9.2014 37 Calls for $.74. This gives the buyer of the Calls, the right but not obligation to buy 200,000 shares of stock at $37 between now and next week and they paid a Cash Outlay of $150,000. With recent sell-offs in UAL and AAL, I thought that this was a goos risk vs reward trader, so I bought these Calls as well. Lets breakdown my trader.
The Trade: I bought the DAL 5.9.2014 37 Calls for $.74 debit
Risk: $74 per 1 lot
Reward: Unlimited
Targets: $.85, $1.00, $1.20 and $1.40
Greeks of this Trade:
Delta: Long
Gamma: Long
Theta: Short
Vega: Long
