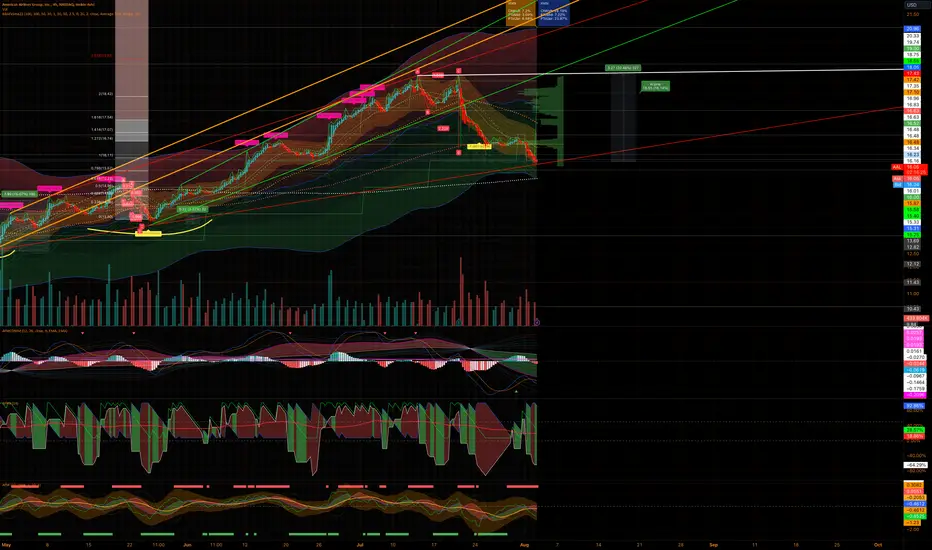
LONG AIRLINES ACDVF, AC, JETS, AAL, DALTSX:AC Technical and Fundamental Reasons for going Long AC Air Canada, and AAL and JETS and DAL:
We are in a tightening 3 Month range in all airline names (And even in broader markets)
Given how we have come straight down from the highs, a multi week bounce with legs is likely and positioning in here would be a strong Risk / Reward entry.
While DXY the dollar is set for monthly consolidation along with oil (Despite the knee jerk reaction to Israel which will likely fade. Markets are holding up well and have priced in peak rates with yields all coming down sharply after capitulating last week.
While DXY OIL and Yields drop.
Airlines are huge laggards (and after good selling and bad news being well priced in) it is time for major bounces. It is a highly volatile sector so a big drop the way it did warrants a big pop.
With capitulation following analyst downgrades, and company outlook drops to adjust estimates for rising fuel costs and labor costs. The discounts of this bad news is very well priced in and has capitulated with huge volume climaxes Monday after the Israel situation over the weekend.
As with 9/11 and Russia invasion, the knee jerk reaction last about a week, before the entire dip is re bought up. Assuming no escalation in Iran to push oil even higher, airlines will care most about earnings and forward guidance to see demand outlook for Q4 and 2024 company guidance.
With DAL reporting Thursday and more coming in next few weeks, I'd expect that the reported results for Q3 are very strong, and more importantly that Q4 and 2024 outlooks won't be as bad as markets are pricing. Resulting in a swift 10-15% bounce on many airline names.
Again: The bad news is very well priced in, and markets will begin to find good value for entrance pre earnings and post earnings as we are very oversold and surprised to the upside with earnings that weren't even close to as bad as markets are expecting as well as strong forward guidance.
NASDAQ:AAL
TSX:AC
AMEX:JETS
NYSE:DAL
Airlines

Potential for a bounceIts sitting right on weekly support line. It could bounce here for a month or two. I would be it will retest low 30s.

AAL - airlines are beat upAirlines have been decimated especially when you factor in the price of oil climbing over the last few weeks.
Margins being squeezed each day!
Long term support is being tagged in a very oversold 8 week selloff.
This could be a good R/R set up on the long side for a quick technical bounce.

LUV Weekly Chart Showing Heavy DemandSouthwest Airlines has been going through some turbulence with recent flight rearrangement issues, but for the most part has smoothened out all issues regarding flights. Air Travel Demand is still thriving and growing exponentially, respectively.
Southwest is a leader among a few others in Airline Stocks as they have High-Quality Management & Great Financial Strategy (e.g. Fuel hedging)
The stock has performed quite poorly since its post-COVID peak of $65 and has retreated nearly 50% while remaining a sound financial base. Southwest has been hovering around this major demand zone at the $30 area. As highlighted in green, this demand zone has repeatedly pushed LUV back up higher, and on this weekly chart, we can see a triple bottom starting to push back higher from this $31 level.
This weekly chart prevails a strong Risk/Reward towards Southwest as a swing-trade or LT investment.
Southwest has remained a fundamentally strong & sound company as they are the first American Airline Co. to reinstate their dividend. EPS projections are very optimistic for the next several years as demand increases & costs decrease. It would also be likely to see a rotation into the travel / Airlines sector as it has been quite low and non-volatile thru the past half year. Recent PT cuts lead me to believe Funds could be loading up
Conclusion: LONG NYSE:LUV through commons
Option Play: Credit-Spread : Jan 19, '24 Puts $30-$27.5p

20% time to fly againAAL has consolidated very well at these levels, recovering some of the lost value. This correction creates an upward movement with a potential of over 20%, con una cuña expansiva y el precio terminando la estructura.
American Airlines is flying soonAccording to the Elliot Wave Count, there is a possibility that in the next few days, American Airlines will start to increase its price.
This price increase will be around 25% to 30% and the price target is between 19 and 22 dollars.

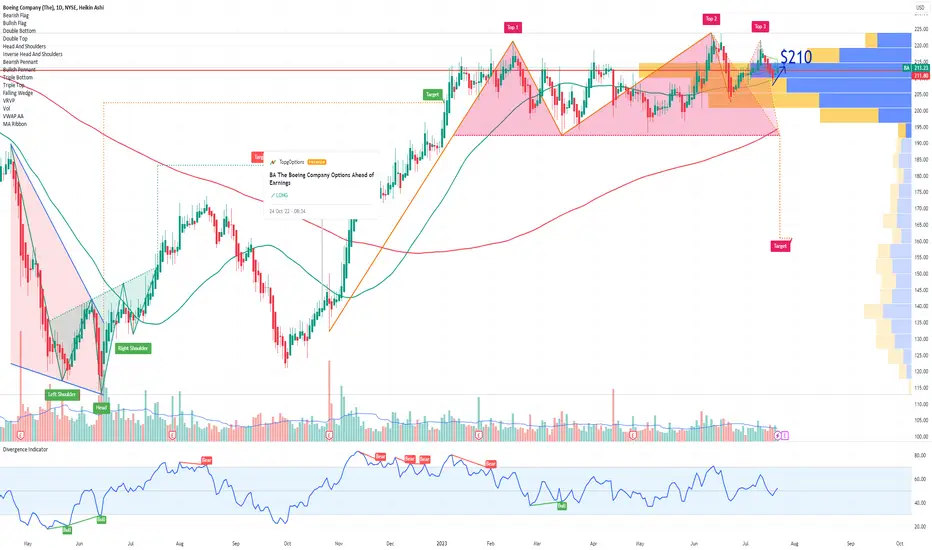
BA The Boeing Company Options Ahead of EarningsIf you haven`t bought BA here:
Then analyzing the options chain and the chart patterns of BA The Boeing Company prior to the earnings report this week,
I would consider purchasing the 210usd strike price in the money Calls with
an expiration date of 2023-8-18,
for a premium of approximately $8.45.
If these options prove to be profitable prior to the earnings release, I would sell at least half of them.
Looking forward to read your opinion about it.
Is America Airlines about to take off?
With a 20% higher than expected earnings today and also raising future expectations...is American Airlines NASDAQ:AAL about to "take off" ? ✈️✈️✈️
EARNINGS RELEASED: Exp 1.59 / Rep 1.92 (20.6% higher than expected)
- Breaking diagonal resistance line
- Price peaking above the 200 week SMA
- Nice to see 200 week SMA slope up now (TBC)
- Ideally OBV to make a new higher high (TBC)
Pre-market coming in lower. Pull back to $17 before continuation would not surprise me. I would enter having established support on the 200 week SMA. I would be waiting here. An eventual rise to over head resistance possible.

UAL United Airlines Pre Earnings LONGUAL has been in a persistent trend up for a couple of months after great earnings were reported
in early May with another due on July 19th. The airports have been quite busy with vacation
travel and UAL has been part of that action. On the 1H chart, price has been supported by
the mean VWAP and has oscillated to the one standard deviation line above that. I see a target
as 56.80 where the the second deviation lines above the mean aVWAP while placing a stop loss
just under the blue line of one STD above VWAP. The price is below the POC line of the volume
profile which should act as a magnet pulling the price higher. The MACD indicator shows 4
the lines in parallel and above the zero horizontal line with a positive histogram. The relative
volatility indicator shows sufficient volatility to support momentum trading.
I will take a long trade going into earnings. I will do this with ten call options contracts
with a strike at $57 expiring on July 21st. On the last trading day, this contract had
a low of $ 0.95 and a high of $1.32 for a range of 35% in a single day. I expect similar
price action as the earnings date approaches. I expect to pay about $1320 for ten contracts
and the profit expectation is 100% over the next 10 trading days.

JETS - Long term play for IRA accounts
Breaking out of the trendline on a decent volume.
Needs more push to clear the overhead supply and test 24. I think a pullback there and breakout would set this long term.
Note: these are 3 Day charts, so my confidence and comfort level is higher. Regardless stop has to be respected.
Disclaimer: Started a position today. Will add as long as 11 EMA is held.

DAL - Caught fire.
Been meaning to post this chart for a while. Another example of why trying to catch the bottom is fools gold. Most of the action happens after the confirmation, after buyers show up. I have been bullish on the airlines since march and got in early around 32...when it went up to 36 and continued to go lower, I cut the position, but kept this on close watch. as it tested the 200DMA, I opened a started and kept adding as it continued to show strength.
I got the full position on 06/05 on the backtest of the support. Since then, it has been on tear. Overall sector has been on fire since, but Delta and UAL are likely to do well over next few years.
Likely to slow down from here to 50, and maybe pullback. No reason to guess, just continue to ride it until it stops to work.

Hitting LowsATSG is sitting right now at the $15 price point which we have not seen it trade around since back in March of 2020. With price back at this low range, analyst are still holding their price valuations of around $22-$27 making this a favorable target for long term portfolio growth. The last two earning reports were more on the negative side although the company has shown before its ability to be able to generate revenue historically. Having hit highs of just under $35 at the start of the year we can start to see where the peaks and valleys of this range will be.

Resistance at 220Since we made it up into the range between $200-$220 we started to see price experience significant resistance to being able to break beyond this level. Right at the start of the year after a long rally near the back half of last year we have seen completely sideways markets. With the last few month starting its trend downwards we can potentially see some retracement of the rally that we saw at the end of last year. Since breaking below the most recent trend level, looking to see if price continues on the current bearish momentum.

The benefits of JETSWith all of the various airlines having such similar patterns of movement JETS lets you be able to not get the same risk of the higher volatility that comes with holding each airline individually. With that being said there is less spikes in price action here which can also provide a more stable trading environment. When I look at the ETF JETS I have a general more bullish bias over long term as I believe travel trends will only increase in the next coming months with summer starting up now, we can expect to see those revenues reported by end of Q3.

Unclear Expectations AAL - A positive earnings report from last quarter was soon clouded by government pressure to now provide support for stranded passengers could put airlines once again in the crosshairs of regulations and high cost of doing business. Looking for a more sideways to bearish outlook for the next few weeks as there shows to be weakening confidence over time in combination with no pressures for changes in their business. Not to say that the changes may pass as there are many things in place already such as travelers insurance that people can buy to protect themselves should there be any troubles in your journey.

ERJ Short - Exceeded TargetERJ recently announced their earning reports which showed to be much more negative than expected. Even as price started reaching up towards the 2.618 fib level we start to see selling volume pick up. Initially I was just aiming to look at the 10% retraction but we saw that just before earning report. We are seeing continued negative push starting the week to the next floor. The next major level to look at will be right around 12.75 price target based on the negative news and current market conditions for ERJ.

BA Gap Fill SetupBA 65m: Acute analysis potential gap fill to upside contingent on auction acceptance. Positive ER from UAL, expanded partnership with Invictus Games this morning, and ER next week catalysts for participants// 215.55 is a KL to be watched as it is where auction failure has occurred five times YTD// KLs 206.80, 208.77, 208.94, 210.13, 211.50, 212.56, 215.55// Beta 1.43, ATR 5.72, IV: 34.09%// Price at time of publish: 210.65

American Airlines Group: The Best Stock to Buy Right Now?The pandemic hit the airline industry hard, with many companies filing for bankruptcy or struggling to stay afloat. However, one company that has managed to weather the storm is American Airlines. Despite facing unprecedented challenges, American Airlines (NASDAQ: AAL) has survived and emerged stronger than ever before. So if you’re looking for a smart investment opportunity in these uncertain times, read on to discover why investing in American Airlines could pay off big time!
A new and strong weekly demand imbalance trading at $12.85 per share took control last week, in April 2023. The strength of the impulse is important. This is a long-term investment opportunity for American Airlines (NASDAQ: AAL) stock.

JET2 PLC ORD GBP 4H LSE AVIATION SECTORJET2 PERFORMING WELL OVERALL SINCE THE COVID CRASH, STRUGGLED TO BREAK PAST THE 3 YEAR RESISTANCE OF APPROX 1403 ON A NUMBER OF OCCASSIONS, RISING WEDGES TEND TO BREAK TO THE DOWNSIDE 68% OF THE TIME,
FUNDAMENTALS ARE BRILLIANT ON THIS ONE. NEW TRAINING CENTRE AND AIRCRAFTS PURCHASES.
Jet2 Plc Market Data
TIDM JET2
Ticker Code JET2.L
ISIN GB00B1722W11
Currency GBX
Issue Country GB
Sector Ticker NMX2770
Year End 31-Mar-2022
Shares in Issue 215m
Market Cap. £2,802m
Market Size 2,000
PE Ratio -8.878
Earnings -147.00
Dividend 3.00
Yield 0.230%
# of Trades 700
Vol Sold 219,018
Vol Bought 96,967
52 Week High 1,394.50
52 Week High Date 08-Mar-2023
52 Week Low 637.40
52 Week Low Date 13-Oct-2022
JET2 Fundamentals
Standard IFRS IFRS IFRS IFRS IFRS
Millions Millions Millions Millions Millions
Income Statement 30 Mar '22 31 Mar '21 30 Mar '21 31 Mar '20 30 Mar '20
Revenue 1,231.70 395.40 395.40 3,584.70 3,584.70
Operating Profit / Loss (323.90) (336.10) (336.10) 184.60 184.60
Net Interest (66.00) (34.60) (34.60) (37.60) (37.60)
Pre Tax Profit (388.80) (369.90) (369.90) 147.70 147.70
Post Tax Profit (315.40) (299.50) (299.50) 111.60 111.60
Profit for the Period (315.40) (271.20) (271.20) 116.00 116.00
Equity Holders of Parent Company (315.40) (271.20) (271.20) 116.00 116.00
Minority Interests n/a n/a n/a n/a n/a
Continuing EPS
Earnings per Share (Basic) (147.00p) (151.20p) (166.90p) 77.90p 77.90p
Earnings per Share (Diluted) (147.00p) (166.90p) (166.90p) 74.80p 74.80p
Earnings per Share (Adjusted) (147.00p) (166.90p) (166.90p) 75.00p 75.00p
Continuing and Discontinued EPS
Earnings per Share (Basic) (147.00p) (151.20p) (166.90p) 77.90p 77.90p
Earnings per Share (Diluted) (147.00p) (151.20p) (166.90p) 77.80p 77.80p
Earnings per Share (Adjusted) (147.00p) (151.20p) (166.90p) 77.90p 77.90p
Dividend per Share n/a n/a n/a 3.00p 3.00p
Millions Millions Millions Millions Millions
Balance Sheet 30 Mar '22 31 Mar '21 30 Mar '21 31 Mar '20 30 Mar '20

United Airlines (UAL): Buy the DipUnited Airlines (UAL) stock recently dipped over 20% as a result of poor guidance for Q1. The company over estimated for Q1. However, United is positive for Q2 based on bookings. So, if they were to lower guidance for Q2 and the rest of the year, I would say the sell off might be justified. However, that is not the case. UAL's EPS projections remain $10 to $12 for the full year. So, this is a buying opportunity in my opinion.
The technical perspective shows the stock near an oversold condition on the daily chart RSI. The price could dip further to the next support level in the $30s, but it might find a bottom around the current level in the low $40s. Check out my link below for a full article.

$UAL Riding the Turbulence$UAL stock dropped due to Q1 cost and downtime headwinds, but airlines expect strong demand and Q2 profitability.
I'm opening 1/3 call position, adding 2 more times if weakness continues:
Strike: $45.
Exp: 6/16/23 or later
Cost: $3.60 per contract
The cost per contract could be lower based on market movements tomorrow. I plan to swing my first 1/3 $UAL call position through #FOMC and will update on this position going forward to the point of sale.

turkish airlines - get ready for your millenium present. In any case, corona would hit Turkey, this one will drop below 1.3$
dolar/turkish lira would be up to 6.84-7.2TL( average 7TL)
1,3*7TL=9,1TL, my entry for Long

Decaying IV and stagnant marketsThe airlines have been pretty quiet lately with the year being primarily sideways trending and relatively unchanged.
Although earnings have been well the IV has remained low all year long. With potential to the upside remaining plausible there is not currently a push of buyers entering new positions.
Remaining neutral with a slight negative bias for the next few weeks based on current market conditions
