Will the Airlines finally take off??GREETINGS!
I've made several posts on Rolls Royce and Raytheon the past few months. Ultimately, we remain bullish for another leg up, but the back-and-forth price action has been exhausting.
Why are we bullish? Well, my strategies involve a simplistic basis of eliot wave theory which shows airlines and major indices have another leg, but I also consider other non-voodoo indicators. For example, Look at the put/call ratio or general market sentiment... EVERYONE IS BEARISH . The contrarian should be salivating.
I'm here to provide an update on the RTX play. The primary count is still active, although price targets have changed slightly from the previous post (see related ideas below to see the DD).
Here I think we are compressing into a triangle wave 4 of C, resulting in a delayed takeoff. I have the 1.272 extension at $95, but we could go to the 1.618 near $105 which would also result in a sharp peak out of the channel, which we often look for for blow-off tops.
Triangles can be annoying to trade, depending on your time commitment available for your capital to be tied-up. This is because intermediate waves often consist of fakeouts! In this case, I think it's time to accumulate! I will be purchasing RYCEY and RTX (at these prices) as my primary exposure to the airline sector.
Good luck!
Airlines

Big volume on Friday for easyJetFriday's massive volume shows that traders and investors are betting on easyJet to turn it around. One day does not make a reversal although the high volume seems compelling.

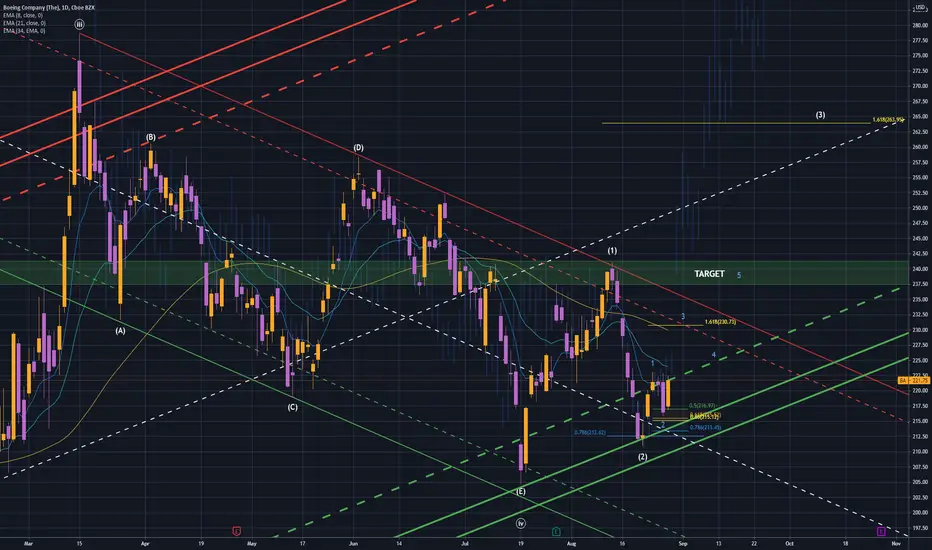
Fun Prediction for $BA - Must See!I decided to make my own prediction and draw in my own RSI, MACD, & 50 MA lines from today (9/14/21) through (2/25/22).
The pink bells indicate past explosive bullish movement (ER run ups?)
I have also created a fib extension from the last impulse wave
Let me know what you guys think of my prediction!
My Plan for 9/14/21 - 9/24/21
Entries: $214, 213.50
Exits: $218, 218.50, $220
Once any of my entries are triggered, I will hop in a $BA $217.5c 9/24/21 (3.30)
-Gordy

Air Canada AC 2-1-2 Downside MonthLooking for Air Canada to go 2-1-2 on the monthly to the downside to trigger some pain here. 20 days left on the month lots can happen
Formed a head and shoulder on daily if you look hard enough

Norwegian Air Shuttle (NAS) OSE: Daily seems to be gearing up!I think the bottom is in (unless issue). And now with the June numbers more than doubling, NAS could see aa decent upside and make some recovery. We are still not out of dark water with 50% of population still not vaccinated and the alarm bells about Delta variant. But ignoring those variables and just looking at the current picture I think it make's a good buy case.
BTW this is not a financial advice. I share my opinion and you should #DYOR
Please hit the like or leave a comment to share your thoughts.

BA $240 moving to in short term BA Current Price $221 Price Target $240
Option - $220c 9/10 ($568,1.7% till breakeven)
After reporting their first profitable quarter in 6 quarters I believe now is the time to add some BA to your portfolio. FDA approval for COVID vaccines coming in just last week shouldact as a tailwind for the travel sector and especially Boeing. In June, Boeing booked defense contracts valued at $1.1 billion. The contract flow was carried by orders for the CH-47 Chinook and the AH-64 Apache. Seemingly, July was even better in terms of contract value. There was a fear out there that BA may see a decline in defense spending due to changes in administrations as we went from the trump administration to the Biden Administration but that is simply not taking place, defense contracts have been very strong for the company. Looking at the chart I believe we will trade up to the top line of resistance around $240 over the coming weeks.

$BA | WEEKLY WATCHLISTLoving this setup going into the week, I entered a swing position last Friday near open. Already up in decent profit. As long as the lows hold around $216, we should expect an impulsive move up to the $230-231 region. Ultimately looking for $238-241 to completely take profits on my swing, but that may take a little longer.
$GOGO: 33% Short Interest Heading Into Holiday Season$GOGO getting a pop today one day after the White House announced mask mandates through the holiday season, should we buy the news or will this be a holiday humbug?

$BA | WEEKLY WATCHLIST (Update)Just a quick update since my post on Sunday. Held my level perfectly and looking for targets shown above! Congrats if you played the bottom.
TrendyTrades: BA Going Up! (Bullish Analysis)BA closed nicely on a key fib level with a bullish harami leading me to believe BA will push up towards 220 for a retest of trend.

$BA | WEEKLY WATCHLISTThis has been swinging around and consolidating since March, very frustrating. However, I believe there is some light ahead of us. Patience is key for this one and will pay off. Sitting on major trend line support and expecting a bounce. Conservative target zone marked around $237-241. Next target above is around $264.

$BAIt’s always good to look at the higher timeframes, Boeing still in a uptrend on the daily/weekly charts.
Might be a good time to put this on your watchlist in case of a break of trend or reversal.
- Factor Four

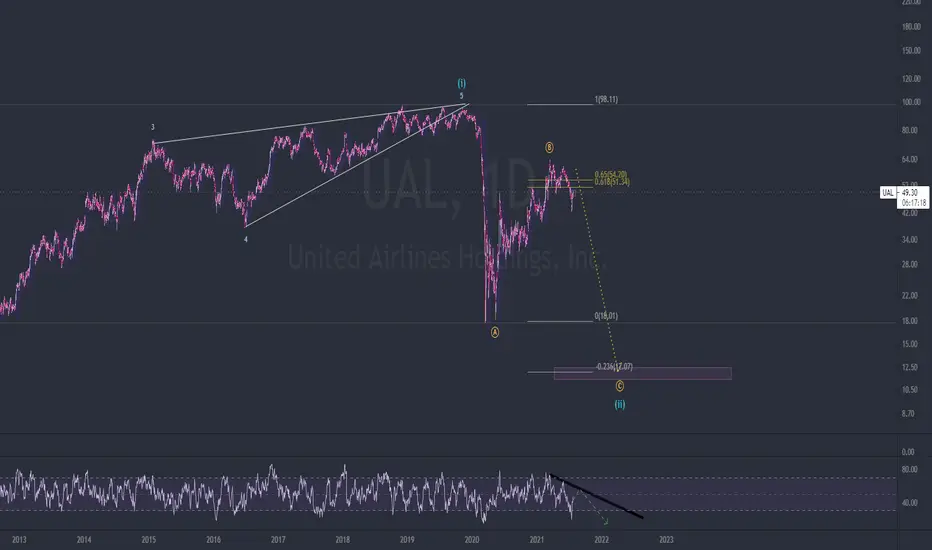
Turning point for UAL?Price action ending 19AUG presents an interesting scenario for NASDAQ:UAL . First, there is clear price divergence with RSI, a bullish indication. Today's candle suggests a (crucial) third touch on a dynamic support level in the 43.00 range, suggestive of a possible upward bounce. Finally, today's candle also presents a double bottom against this rising support level, again a bullish indication.
My positions in NASDAQ:UAL have been hammered in recent months, but I'm guessing that eventually the momentum will change direction. Today's candle simply presents one scenario for that change.

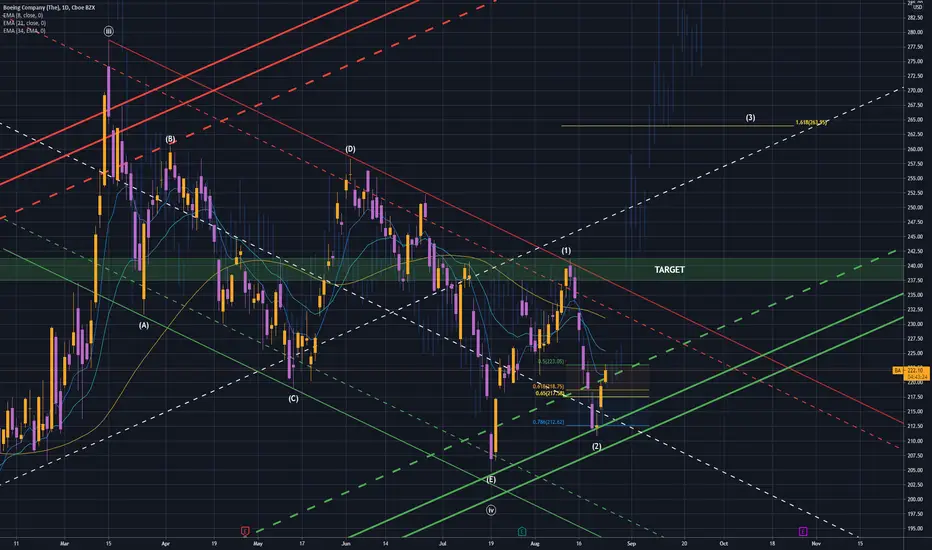
(Request by user ktaba) BA: Price is consolidatingPrice broke down down back in mid July and the up trendline supported well. It then retraced to neckline and followed by a small sell off before stabilizing at current price.
It seems like price is going to be in consolidation for awhile. Depending on the price action of the consolidation, that will give us a hint on its next move.
As price is currently in the middle of a long pennant pattern, I won't be buying or selling yet.
However, the other airlines are showing signs of slowing down in the selling pressure. BA seems to be the stronger stock. Therefore, my bias is towards buying should the next few days shows weakness in selling pressure as well.
Disclaimer: I'm not giving any trading and investing advice. I'm just sharing my chart observations.
If you have any symbols that you'd like me to analyze, feel free to drop me a comment.

aal w3 setupsame story as ual,
risky move here, but everything checks out for this push up.
w3 target = $26

INDIGO BULLISH VIEW FOR INVESTMENT RISK REWARD 1:4Hi,
Guys we have came through one more idea for investment for a year. In which you can get 1:4 Risk reward ratio for your investments.
This is my view not a recommendation for any one. Do your own research and please ask your financial advisor before buying any equity.

Technical analysis update: Lufthansa AG (28th July 2021)In 2020 airlines around the globe experienced one of the worst years in their history due to pandemic crisis and worldwide restrictions on travel and freedom of movement. This had detrimental impact on airlines around the world. Story is no different for Lufthansa AG. Last year German government bailed out Lufthansa AG with 9 billion euros. Subsequently German government gained 20% stake in the company which is supposed to be temporary until LHA gets back on its feet. As part of the bailout deal German government is not allowed to interfere in daily operations of Lufthansa AG. German government having 20% stake in the company suggests relatively lower risk associated with this investement as opposed to other airline investments where no government is involved with the company. Company's stock declined since December 2017 until September 2020 when it reached low of 6.848 EUR per share. Since then price reversed and started to make higher highs and higher troughs. Within last two months divergence between price and RSI became observable. In addition to that RSI, MACD and Stochastics turned bullish. Though, ADX contains low value suggesting that weak or no trend is present. Despite that we think LHA is poised to move higher eventually. In the short term we expect company to move sideways and struggle but in the long term we expect LHA to perform well. We would like to set our long term price target for LHA to 12 euros per share.
Divergence between price and RSI:
Disclaimer: This analysis is not intended to encourage buying or selling of any particular securities. Furthermore, it should not serve as basis for taking any trade action by individual investor. Your own due dilligence is highly advised before entering trade.

ual setupshort airlines,
thank me later
i have this feeling, i can't explain it to you in words - but i'm going heavy into airline shorts from here.
look for 2022 expiries, give it some time - and one day, you'll wake up and be like "how did elo know"?

Potential Long on JetBLue JBLURecognizing multiple Technical confluences for a potential move long on JBLU
1. We see price following the trend that existed prior to Covid
2. The 100 EMA has dipped below the 200 EMA (sign price may be reversing current trend.)
3. Price has entered a significant Demand Zone
4. Price is respecting the trend lines since the Covid dip
5. The RSI is displaying possible divergence.
6. The MACD is below 30. (Sign price is oversold).
Negative Confluences:
1. OUR OBV line is showing a decline in buying volume.
2. Price is still outside the lower, longer (pre-Covid) trend zone.
Fundamental Analysis:
1. Earnings expected first week of August. (Price typically declines into earnings).
2. Earnings report for 2nd quarter includes months prior to economic opening. (Earnings may be lower.)
3. Operating Income negative year over year
4. Gross profit change from previous years same quarter show significant loss
5. Economic reports show record travel numbers from July 4th
6. Economy nearly fully opened since roughly June
7. JBLU to start flights from NY to UK in August.

watching for breakout above resistancetouching major resistance level today, watching for breakout and hold within the box, buy target is a break above the box.

Long Run on Boeing BALooks like BA has reached potential support.
Looking for signs of bottom to go long on the 15 min chart and for the 100ema to cross under the 200 on the 4 hour into daily chart to present possible price reversal.
Looking for entry around $200 - 190.
Take profit around $300
Technical Analysis:
Positives:
1. In line with post Covid trendlines.
2. RSI below 30
3. OBV shows slowing of selling
4. MACD around neutral
Negatives:
N/A
Fundamental Analysis:
Positives:
1. New drone project expected to raise billions
2. Large United Airline order (200 -737 max)
3. travel increasing as Covid restrictions lift
4. China approval of the MAX will likely happen in the second half of the year.
Negatives:
1. Airbus taking market share
2. Chip shortage slowing production and creating backlog
3. declining sales trend for planes
4. China trade relations are a mess
* Not trade or investment advice, trade at your own risk.

BOEING COMPANY (BA) for long positionSignals
Position: long Entry price: 198
Target price: 230 Stop loss: 200
Indicators
RSI is very low, better to wait till the price touches the support line around 198.
Bullinger bands and Keltner channel are opened, meaning a strong trend. So the price will probably reach the support. Same clues from the MACD .
Conclusions
Boeing is going to be fine despite the near-term turbulences. Recent weaknesses from the stock is an entry opportunity for long positions and also for long term positions.
Clearly from the lines the trend is positive.
