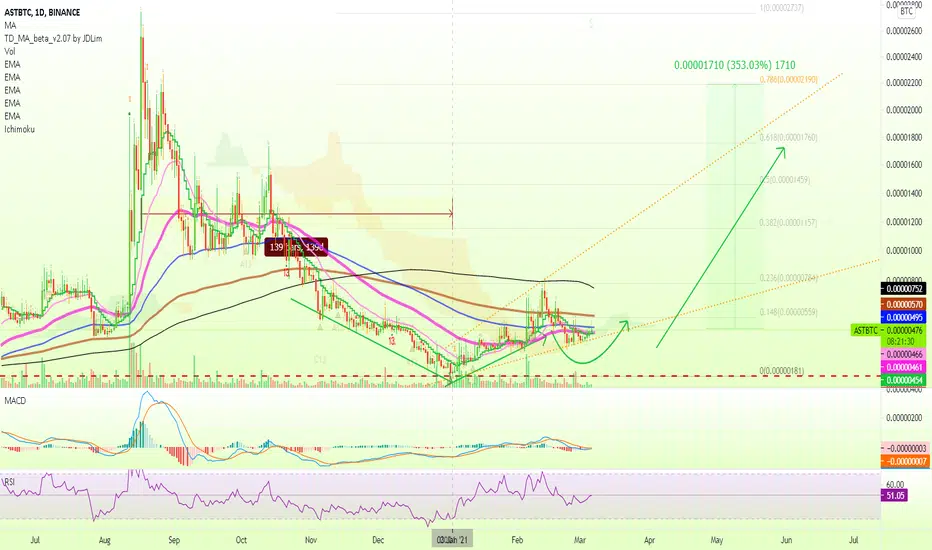
350%+ Mapped for AirSwap (AST)After the massive bull run AirSwap (ASTBTC) had back in 2020, what followed was a 4.5 months long correction that found a low on January 3, 2021...
We have been having bullish action since.
Here we have the Adam & Eve bottom pattern when we look at the chart long-term, as well as a new uptrend confirmed after the 3-Jan. low.
This is good news.
With a higher low now in and prices closing above EMA50, there can be additional growth.
Remember to build a plan/strategy before trading.
Thanks a lot for your support.
Namaste.
Airswap
AST trading opportunity RSI oversold on 4h. If there isn't any fundamentally wrong with this coin I can see reversal potential from here(that long red wick is a good thing most of the time) Goals are marked on chart... STILL...
BTC alert: if this suddenly drops then you know how badly it's gonna influence markets. 60K $/btc ATH was not a funny thing.

AirSwap AST interesting coinI entered around 560 sats. o think this might suprise us this year!
AST is showing some elliot wave pattern on daily chart and it had a huge dip which we can reverse into. im thinking on holding this for longer-term.
# I am not a financial advisor, i do this for fun :) Trade at your own risk, remember ALOT of people lose their money.

AST Double Top patternAST has made a double top pattern after 75% rally. Take profit if you have this coin.


AirSwap (AST) Can Grow Over 480%, Gaining Momentum!AirSwap (ASTBTC) had a major run back in 2020 in the tune of 1700%+
Peaked in August, a strong correction took place, landed in a higher low and now the trend is starting to turn.
Going from red to green, bullish momentum is now building up.
Here we have ASTBTC, prices moving above EMA50... We have good potential for massive growth...
Soon, we will have another bullish run.
Namaste.

ASTBTC - Cup and Handle + H+S + Everything BullishI'm a noob practising TA. Not advice!
Red Lines are S/R from 2020 - these are my targets.

Airswap-BTC WEDGE Greetings,
on the weekly schedule Airswap ( AST ) coin. After testing the bottom in June, the coin has grown by 1600%. Then the dump is 85%. At the moment, the price of a fairly strong support zone 425-450 Satoshi.
Technically, the coin formed a falling wedge pattern, at the moment there are attempts to break it down, as well as on the weekly chart we can see two green dodges with a small candle body, which indicate a possible reversal of the movement.
Do not ignore the red scenario, when the price breaks down to the local bottom 170-200 Satoshi. In this case, the trading logic is the same for a wedge breakdown. Targets in the development of the upward movement 850, 1480, 2400.
Stop Loss according to your trading system, and risk management.
Always use Stop Loss, and do not use a leverage greater than x3.
A trader should always have tomorrow.
If you find the information useful, place a liking and sign up so you don't miss anything.

AirSwap ASTUSD - A breakoutPossible bullflag forming above the 200MA.
Large falling wedge has led to this breakout.

AirSwap (AST) Before The Action Starts!We have another strong support level below the current one (yellow) for ASTBTC, but it is likely that the new bullish move will start from here.
The trading volume is almost non-existent on the drop, meaning that the bears have no momentum nor strength.
The indicators are slowly looking better while trending towards the bullish side.
We are likely to see action here soon.
Note: IF prices break below the red dashed line, the lower support level can be tested before the next bullish jump.
Thanks a lot for reading.
Namaste.


AirSwap (AST) 90% Target MappedAirSwap (ASTBTC) has been consolidating strongly above all EMAs... This one can jump anytime.
We remain strongly bullish on this setup as long as prices are trading above the EMA100 blue line... Falling below this price would change the dynamics of the chart.
Still, the bulls remain strong with any candle close above 0.00000938. Anything lower and the bearish potential increases.
Now, our next target is mapped at 90%+ from the current price.
This can easily happen as the week develops.
The altcoins market is preparing to print some really, really strong growth... Make sure to prepare yourself so that you can make the right calls when the time comes.
Namaste.


AirSwap Long-Term (Weekly Chart Analysis)Let's take a look at AirSwap (ASTBTC) and how it is behaving around the EMA lines.
First, we saw ASTBTC break above EMA50, quickly followed by a test of this level as support.
Second, we saw ASTBTC break above EMA100, quickly followed by a test of this level as support.
Now, we have prices consolidating strong above EMA10, EMA50, and EMA100...
This opens the door for additional growth.
If prices drop (red arrow), we remain bullish and still expect another jump (2nd green arrow).
We are bullish mid/long-term... The altcoins will continue to grow.
As long as we have higher highs and higher lows... It doesn't matter how long it takes or if Bitcoin is going down or up... Higher highs and higher lows, is the classic definition of an uptrend, so there can be more... GREEN.
Namaste.

ASTBTC AirSwap Break Up or Break Down? Airswap has been in a downward trend since late august. It has now fallen more than 50% below its all time high.
It looks to be forming a large descending wedge, which are typically bullish formations, but the market is quite volatile right now.
It briefly tried to break to the upside a few days ago but was immediately pushed down. A large move should be coming either way very shortly.
Red line signifies temporary local support. A daily close below this line and the turquoise will be the next area of interest.
Green lines signify potential profit points if it does go bullish.
AST has historically made very swift and large moves, so this is high risk/high reward.
This is not financial advice.

ASTBTC Watch MACD moving more bullish. Potential BIG move comingASTBTC is now breacking bullish after a higher low.
This pair here is looking really good and has lots of potential for additional growth
We have increasing volume while pries move back above EMA10, EMA50 where EMA 100 held support perfectly.
MACD is slowing improving so it might take some more days before AST moves up.

✳️AirSwap [AST/BTC] on Sept-10 #AST $AST #ASTBTCAST is forming a Double Bottom pattern in order to push it up and the easy-to-reach target is the 1400sts zone. This is also an important area and we need to watch it carefully.
The larger pattern is the Falling Wedge, and if the AST breaks the 1400sts, the target will be the 2200sts zone and may even retest the old peak around 2700sts this September.
Private Signal :

AST- low-cap speculation/gamble. Long if weekly S/R lvl holdAs DEXes trading volume approach or even exceed that of centralized exchanges, speculators are pushing up the price of DEX tokens.
AirSwap has the market cap of around 35 millions and is a speculative DEX token that has a lot of upside potential.
Long now or wait until the weekly S/R lvl is successfully retested.

Look this Hidden Bullish Divergence.This chart is so Bullish.
Thanks JpMorgan.
Hidden Bullish Divergence :
www.perfecttrendsystem.com

AST ConsensysNews consensys/Fluidify
defirate.com
Have pump from 150 to 900 now 61.8 fibo, good support. He go can higher now with 10m cap and circulating supply 150 millions, this is very cheap...

0x- Dex tokens go up with DeFi goldrush! Long it in the buy zone unless the breakout fails and the price falls below the invalidation lvl.
0x (ZRX) & kyber network (KNC) are two of the older DEX tokens (Decentralized exchanges) and they are both on Coinbase. Whereas, Balancer (BAL), airswap (AST) and other DEX token s are not.
ZRX is still under $1 and unlike KNC which has gone up 10x already, it has "only" gone up 2x this year. Furthermore, its spot trading volume is consistently ranked among top 10 DEX (Uniswap doesn't have the native governance token) and its token, in terms of trading volume, is consistently ranked in the top 5 DEX tokens.
The only thing to watch out for is its market cap... Yes, in crypto, 300 million market cap means large cap and speculators had the penchant for driving up the price of low market cap tokens between 50 to 100 million back in 2017.
I expect the Defi gold rush and liquidity farming to continue carry DEX, lending and oracle tokens at least in the near future.
