Daily Bullish Signal $AST #AST AST/BTC (3 Jan)BLUE ARROW indicates the EXPECTED Time and Targets
Level Stoploss point up to maximize profit and reduce risk
I'm working all the time, even in Bearish Market
Airswap

$AST - Long -increasing buy volume coming in
-looking for a small pullback for entry
- will probably dip further for entry but mainly looking for previous low to hold.
-wide stop hopefully to avoid accidentaly stop out from wider swing.
-targets marked on chart

$AST Big Moves Ahead-Prior Divergence
-Strong Accumulation
-Bullish Fan Chart
-Big room for Growth
-17X from January High
Goodluck!

A trading opportunity to buy in ASTETHTechnical analysis:
. AirSwap/Ethereum is in a range bound and the beginning of uptrend is expected.
. The price is below the 21-Day WEMA which acts as a dynamic resistance.
. The RSI is at 40.
Trading suggestion:
. There is a possibility of temporary retracement to suggested support zone (0.0002700 to 0.0002300). if so, traders can set orders based on Price Action and expect to reach short-term targets.
Beginning of entry zone (0.0002700)
Ending of entry zone (0.0002300)
Entry signal:
Signal to enter the market occurs when the price comes to " Buy zone " then forms one of the reversal patterns, whether " Bullish Engulfing ", " Hammer " or " Valley " in other words,
NO entry signal when the price comes to the zone BUT after any of the reversal patterns is formed in the zone.
To learn more about " Entry signal " and the special version of our " Price Action " strategy FOLLOW our lessons:
Take Profits:
TP1= @ 0.0003520
TP2= @ 0.0004050
TP3= @ 0.0004730
TP4= @ 0.0006180
TP5= @ 0.0007160
TP6= @ 0.0008660
TP7= @ 0.0010650
TP8= @ 0.0012650
TP9= @ 0.0015490
TP10= @ 0.0019110
TP11= Free

[ASTBTC][92% PP] AirSwap Cash Trade @alanmastersOur last AirSwap (ASTBTC) trade generated over 80% profits for us in a single month, no need to mention that we are really happy with the results. We bought in, waited patiently and later sold on target. Now, we have the chance to buy again and profit more along the way.
Let's take a quick look at the signals and continue to trade.
Daily chart analysis
Bullish MACD and RSI.
Bullish hammer candlestick and several other bullish signals coming from candlesticks.
Increase in volume.
Up wave coming... Time to profit.
Trade instructions by Alan Masters
Buy in: Up to 0.00000980
Targets:
(1) 0.0000117
(2) 0.0000138
(3) 0.0000161
(4) 0.0000189
Stop loss: Close daily candle below 0.00000700.
Capital allocation: <10%.
YES IT CAN BE DONE! I WIN!
What is it about success, that brings people together?
What is it about dedication, that makes us want to help each other?
Have you noticed, that when you work hard, there is always people by your side?
But when you complain, nobody seems to care!
So what is it that we need to do, in order to achieve our goals?
What is it that we need to do, to become what we dream everyday?
Start the change by looking in the mirror.
And asking yourself what it is that you need to do.
You have to be, everything you want everyone else to be.
You have to visualize your dreams, so that they can become reality.
So the only thing that you really need to do, to become your true self.
Is stand up in your own two feet and take the first step.
That can be as simply as saying, “Ok, I know that I am special, I know that I am a winner. So now… Let’s trade!”.
I love You!
Namaste.

A trading opportunity to buy in ASTBTCTechnical analysis:
. AirSwap/Bitcoin is in a range bound and the beginning of uptrend is expected.
. The price is above the 21-Day WEMA which acts as a dynamic support.
. The RSI is at 52.
Trading suggestion:
. There is a possibility of temporary retracement to suggested support zone (0.00001400 to 0.00001260). if so, traders can set orders based on Price Action and expect to reach short-term targets.
Beginning of entry zone (0.00001400)
Ending of entry zone (0.00001260)
Entry signal:
Signal to enter the market occurs when the price comes to " Buy zone " then forms one of the reversal patterns, whether " Bullish Engulfing ", " Hammer " or " Valley " in other words,
NO entry signal when the price comes to the zone BUT after any of the reversal patterns is formed in the zone.
To learn more about " Entry signal " and the special version of our " Price Action " strategy FOLLOW our lessons:
Take Profits:
TP1= @ 0.00001830
TP2= @ 0.00002000
TP3= @ 0.00002380
TP4= @ 0.00003250
TP5= @ 0.00003960
TP6= @ 0.00005030
TP7= @ 0.00005670
TP8= @ 0.00006960
TP9= @ 0.00008240
TP10= @ 0.00011560
TP11= @ 0.00013520
TP12= Free

There is a possibility for the beginning of an uptrend in ASTETHTechnical analysis:
. AirSwap/Ethereum is in an up trend and the beginning of uptrend is expected.
. The price is below the 21-Day WEMA which acts as a dynamic resistance.
. The RSI is at 51.
Trading suggestion:
. There is a possibility of temporary retracement to suggested support zone (0.0004130 to 0.0003630). if so, traders can set orders based on Price Action and expect to reach short-term targets.
Beginning of entry zone (0.0004130)
Ending of entry zone (0.0003630)
Entry signal:
Signal to enter the market occurs when the price comes to " Buy zone " then forms one of the reversal patterns, whether " Bullish Engulfing ", " Hammer " or " Valley " in other words,
NO entry signal when the price comes to the zone BUT after any of the reversal patterns is formed in the zone.
To learn more about " Entry signal " and the special version of our " Price Action " strategy FOLLOW our lessons:
Take Profits:
TP1= @ 0.0005210
TP2= @ 0.0006180
TP3= @ 0.0007160
TP4= @ 0.0008660
TP5= @ 0.0010650
TP6= @ 0.0012650
TP7= @ 0.0015490
TP8= @ 0.0019110
TP9= Free

There is a possibility for the beginning of an uptrend in ASTETHTechnical analysis:
. AirSwap/Ethereum is in a range bound and the beginning of uptrend is expected.
. The price is below the 21-Day WEMA which acts as a dynamic resistance.
. The RSI is at 51.
Trading suggestion:
. There is a possibility of temporary retracement to suggested support zone (0.0004130 to 0.0003630). if so, traders can set orders based on Price Action and expect to reach short-term targets.
Beginning of entry zone (0.0004130)
Ending of entry zone (0.0003630)
Entry signal:
Signal to enter the market occurs when the price comes to " Buy zone " then forms one of the reversal patterns, whether " Bullish Engulfing ", " Hammer " or " Valley " in other words,
NO entry signal when the price comes to the zone BUT after any of the reversal patterns is formed in the zone.
To learn more about " Entry signal " and the special version of our " Price Action " strategy FOLLOW our lessons:
Take Profits:
TP1= @ 0.0005210
TP2= @ 0.0006180
TP3= @ 0.0007160
TP4= @ 0.0008660
TP5= @ 0.0010650
TP6= @ 0.0012650
TP7= @ 0.0015490
TP8= @ 0.0019110
TP9= Free

AST Breakout is Confirmed on the 4H ChartAST looks very bullish on the 4H chart. Price is over MA20 and Tom Demark count gave a green 2.
Daily chart is also bullish with price over MA20. Stoch RSI is oversold and there is a huge potential for price increase.
Here is my trading idea:
Buy: 1480 - 1550
Sell targets: 1600 - 1690 - 1830 - 2040 - 2100
Stop loss: 1390

Daily Bullish Signal $AST #AST AST/BTC (07 November)#AST (AST/BTC)
Buy : 1350-1400
Stop : 1250
BLUE ARROW indicates expected Time and Targets
Level up Stoploss level gradually to maximize profit and reduce risk


Pay Attention on $AST, It Will Be Fruitful!First time i recognize AirSwap existence was on July after a 80% pump when i saw it on Binance front page. This stuff really catches my attention and then i'm looking for the background and look up the chart.
This token is a wallet project and have 500 mills total supply, but only 150 mills. Really, A BRD wallet junior competitor. But I will prefer BRD of course! with no doubt.
Fortunately, the chart is quite bottom, even make a lower low from last season at 1000 sats. This is quite bargain. That right now already up 40% of it in 3 weeks.
So this is my idea. Short term will follow the elliot wave. Mid-term will follow fibonacci. Will post a bigger time frame, on the comment of this chart.
If all of these ideas I posted helps you, give them thumbs up, shares, comments and follow me. If you have a suggestion, just fill in the comment sections or message me. Looking forward to hear from you all. Thanks a lot!

[ASTBTC] AirSwap Bull Chart [440% - 1000% PP]AirSwap (ASTBTC). Here is a perfect example of the charts we used to look at last year before December's bull run. I will point out the main points we used to look for. All these trades generated massive gains, we are talking in the ranges of 2-7x each and some even higher. So let's take a look at the chart for AST and see what we can learn from it:
- Here we are just looking at the chart in general. You don't need to be an "analyst", you don't need to read any books, you don't need to know anything about trading to be able to look at this chart. But as soon as you start looking at it, you start to learn, you gain information even if it is in a "strange" language. Right now we are looking at candlesticks, patterns and indicators, but there is much more... So let's dive in...
- The peak/top price/all time high (ATH) was hit on January 10th, 2018. I marked the date on the chart. After that we have a downtrend for the following 245 days, assuming the 12th September is when the bottom was hit. Note: There can still be another drop, strong one and fast one and that's why we use a stop loss for our trades. So far this seems to be the bottom based on the signals we are going to discuss below.
- The market had plenty of time to remove all the weak hands. All this time the price dropping, these are the people that no longer want to hold this token, gone. The light blue line is the EMA10 indicator and you can see we trade below it most of the time. Now, we are trading above EMA10 and we touched the same bottom twice, mid August and mid September. A sign of support.
- We have massive bullish divergence on the MACD building up for many months. This is the main signal to look for big profits potential long term trades.
- The RSI and STOCH are both bullish... and the weekly chart can also give you an idea of the growth potential ahead...
- ASTBTC is lacking some volume but is having slow steady growth, which is good signal for future growth. Once volume starts to build up, you will see this altcoin move up faster than what you can imagine.
- Please allow time for this trade to develop. It can take weeks and months for these signals to fully develop and there will be price swings in between.
- These signals change as the market changes. A bullish signal can be invalidated because of an event, just as another event can change the chart completely... so we remain always open to knowing that change is possible and these are only signals. We diversify. We have patience. We trade. We profit. We are grateful always for the profits... and we move on!
- Back to the trade...
Trade instructions for AirSwap vs Bitcoin (ASTBTC)
Buy in: 0.0000113 - 0.0000129
Targets for ASTBTC:
(1) 0.0000157
(2) 0.0000185
(3) 0.0000238
More target available to PREMIUM supporters...
Stop loss: Close below 0.00000975 on the weekly candle.
Capital allocation: <5%.
SUCCESS IN TIMES OF FAILURE
How to succeed when everything is failing?
To succeed when failing is in question, you need to persist.
You to need focus on your goals, focus all of your energy... concentrate in what you believe.
As long as you persist and focus on your dreams... YOU WILL SUCCEED!
How to be/get good, when things seems to be doing/going bad?
To get good be good. To do good be good.
When things are going bad you can stop. Focus on what is going on.
Accept everything that is happening and understand the purpose behind it all.
Once you can meditate on the situation and the moment you call bad, you will be able to see the bigger picture and get the good out of the bad.
Namaste.

AirSwapAirSwap Moving in a falling wedge. Soon we will break up. Fibonacci are our targets. My opinion AirSwap one of the best decentralized exchanges at the moment
On October 10th , we’re rolling out the new AirSwap with capabilities for traders, teams, and OTC desks to create their own trading environments. What kind of space will you create?
twitter.com

AirSwap vs. BitcoinASTBTC shows bullish setup, continuation of the trend.
My targets near 2000 level.

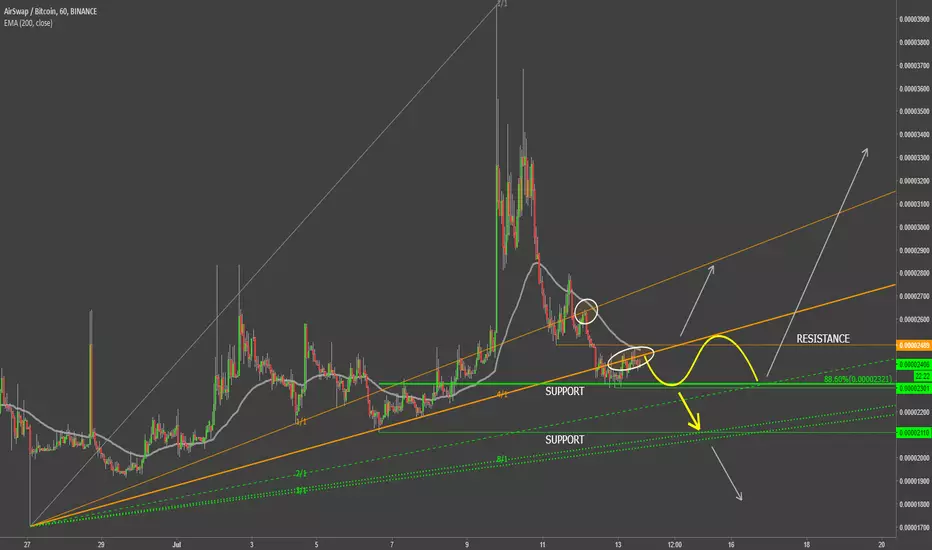
AirSwap Continues Losing To BitcoinAirSwap seems to have established a short term downtrend, while it has already declined from the 3960 satoshis, down to 2320 satoshis, where it found the support at 88.6% Fibonacci retracement level.
Although the support has been rejected, price has broke below the uptrend trendline and today rejected the 50 Moving Average. The resistance has been formed at 2490 satoshis, and while it is holding either range trading will take place or, if price will break and close below 2300 satoshis, downtrend continuation should be the case.
Upon the support break, AST/BTC could go down to 2110 satoshis, that is confirmed by the previous support as well as the 8/1 Gann Fan trendline. Break below the Gann Fan trendline would push price even lower, perhaps to the previous low at 1700 satoshis.
On the upside, if AirSwap will manage to break above the 2500 satoshis level, a correctional wave up should be expected, although it is unlikely that the price will reverse to the upside at this stage.
AST/BTC Airswap could run soon Accumulate AST between 2250-2000
2200 | 2163 | 2094 | 2031
Targets
2380 | 2530 | 2660+
also use fibs to sell/buy
Stoploss
1978 | 1947

$AST (Airswap) levels.supports and resistances for $ast.
this is the last support. if we can't hold it, we will fall and will make a new all time low.
also, let me know what do you think about it.
Thanks.


Let's AirSwapI hear that banks are getting out of the way, but NYC hedge funds are stepping in. Regardless, I like this chart. Live product and peer to peer. Count me in!


#ASTBTC #cryptocurrency pulling back for a nice entry here for another swing toward testing resistance in the 7000s. Support level shown would yield a ~1:3 risk/reward entry for a project that just released an beautiful DEX platform that works well. 4600-4800s ideal support area that also maintains the trend upward.
