AI ( SPOT )BINANCE:AIUSDT
#AI/ USDT
Entry( 0.1040- 0.1070)
SL 4H close below 0.0963
T1 0.1150
T2 0.1320
T3 0.1444
_______________________________________________________
Golden Advices.
********************
* collect the coin slowly in the entry range.
* Please calculate your losses before the entry.
* Do not enter any trade you find it not suitable for you.
* No FOMO - No Rush , it is a long journey.
AIUSDT
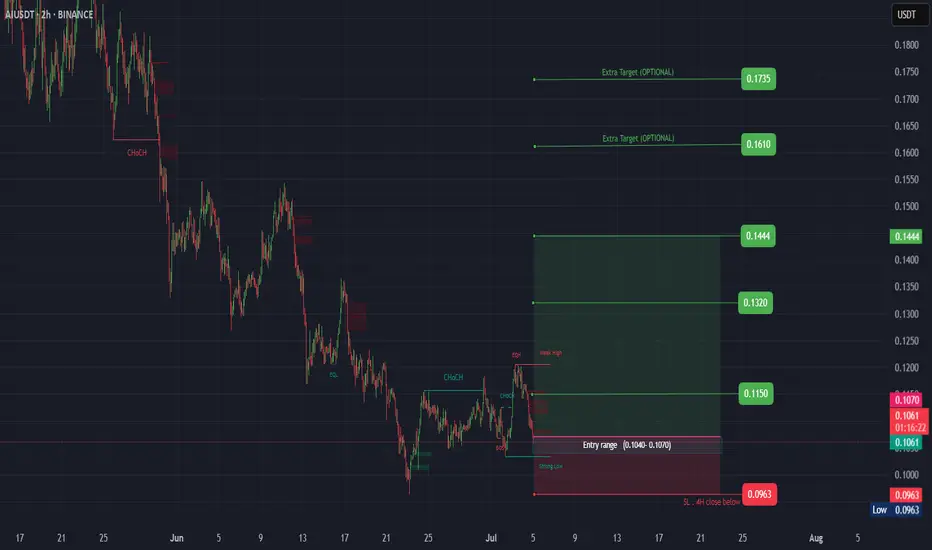
AI Looks Bullish (12H)The AI correction has started from the point marked as "start" on the chart.
It seems that wave C has completed, as its time cycle has finished and the price has reclaimed key levels.
As long as the green zone holds, the price can move toward the targets and the red box.
The targets are marked on the chart.
A daily candle closing below the invalidation level will invalidate this analysis.
For risk management, please don't forget stop loss and capital management
Comment if you have any questions
Thank You

AIUSDT Forming Falling ChannelAIUSDT is capturing trader interest with a well-defined falling wedge pattern, a strong technical signal that often precedes a major bullish reversal. This setup shows the price compressing within converging trendlines while volume remains supportive, hinting at an upcoming breakout. With expectations for a 90% to 100% gain once the wedge resistance is breached, this pair stands out for swing traders seeking high-probability crypto setups.
The AI narrative continues to gain momentum in the crypto market, and AIUSDT has benefited from this growing sector trend. As blockchain projects focusing on artificial intelligence integrations expand, more investors are looking for exposure to tokens that could lead the AI revolution in decentralized applications. This increasing investor confidence is reflected in the steady accumulation during the wedge formation, showing that buyers are positioning for a breakout.
Traders should closely monitor how the price behaves at the wedge resistance line, as a clean breakout with strong volume could trigger the expected upside move. Confirmations like bullish retests and a surge in trading volume can add conviction to the setup. Risk management remains key, with well-placed stop-losses below the wedge support to protect capital while targeting the full measured move potential.
✅ Show your support by hitting the like button and
✅ Leaving a comment below! (What is You opinion about this Coin)
Your feedback and engagement keep me inspired to share more insightful market analysis with you!

SCRUSDT UPDATE
Pattern: Falling Wedge Breakout
Current Price: \$0.268
Target Price: \$0.398
Target % Gain: 50.1%
Technical Analysis: SCR has broken out of a falling wedge pattern on the 12H chart with a clean close above resistance. The breakout is backed by bullish candles and increasing volume, suggesting a potential 50% move upward.
Time Frame: 12H

NEARUSDT UPDATE
Pattern: Descending Triangle Breakout
Current Price: \$2.937
Target Price: \$3.60
Target % Gain: 22.69%
Technical Analysis: NEAR has broken out of a descending triangle on the 8H chart. Price is closing above resistance with decent momentum, indicating a potential move toward \$3.60.
Time Frame: 8H

XRPUSDT UPDATE
Pattern: Falling Wedge Breakout
Current Price: \$2.5398
Target Price: \$3.90
Target % Gain: 55.29%
Technical Analysis: XRP has broken out of a falling wedge on the 1D chart with strong bullish momentum. The breakout is confirmed with a daily close above resistance and increased volume.
Time Frame: 1D
Risk Management Tip: Always use proper risk management.

SOLUSDT UPDATE
Pattern: Falling Wedge Breakout
Current Price: \$173.38
Target Price: \$300
Target % Gain: 105.90%
Technical Analysis: SOL has broken out of a falling wedge pattern on the daily chart, indicating a bullish reversal. Strong momentum and breakout confirmation suggest a potential move towards the \$300 level.
Time Frame: 1D
Risk Management Tip: Always use proper risk management.

LISTAUSDT UPDATELISTAUSDT Technical Setup
Pattern: Falling Wedge Breakout
Current Price: $0.1893
Target Price: $0.30
Target % Gain: 60.04%
Technical Analysis: LISTA has broken out of a falling wedge pattern on the 12H chart with increasing momentum. Price is holding above the breakout trendline, suggesting bullish continuation. A confirmed breakout with volume could push price to the projected target.
Time Frame: 12H
Risk Management Tip: Always use proper risk management.

SUPERUSDT UPDATESUPERUSDT is a cryptocurrency trading at $0.5519, with a target price of $1.2000. This represents a potential gain of over 170%. The technical pattern observed is a Bullish Falling Wedge, indicating a possible trend reversal. This pattern suggests that the downward trend may be coming to an end. A breakout from the wedge could lead to a significant upward movement in price. The Bullish Falling Wedge is a positive indicator, signaling a potential price surge. Investors are showing optimism about SUPERUSDT's future performance. The current price may present a buying opportunity. Reaching the target price would result in substantial returns for investors. SUPERUSDT is positioned for a potential breakout and significant gains.

TAOUSDT UPDATETAOUSDT is a cryptocurrency trading at $231.9, with a target price of $360.0. This represents a potential gain of over 60%. The technical pattern observed is a Bullish Falling Wedge, indicating a possible trend reversal. This pattern suggests that the downward trend may be coming to an end. A breakout from the wedge could lead to a significant upward movement in price. The Bullish Falling Wedge is a positive indicator, signaling a potential price surge. Investors are showing optimism about TAOUSDT's future performance. The current price may present a buying opportunity. Reaching the target price would result in substantial returns for investors. TAOUSDT is positioned for a potential breakout and significant gains.

CFXUSDT UPDATECFXUSDT is a cryptocurrency trading at $0.0788, with a target price of $0.1400. This represents a potential gain of over 80%. The technical pattern observed is a Bullish Falling Wedge, indicating a possible trend reversal. This pattern suggests that the downward trend may be coming to an end. A breakout from the wedge could lead to a significant upward movement in price. The Bullish Falling Wedge is a positive indicator, signaling a potential price surge. Investors are showing optimism about CFXUSDT's future performance. The current price may present a buying opportunity. Reaching the target price would result in substantial returns for investors. CFXUSDT is positioned for a potential breakout and significant gains.

CRAIUSDT - An interesting coin!CRAI token is a part of Cryptify AI project
Cryptify AI uses AI and blockchain to analyze influencer performance on social media, helping businesses make more accurate and transparent marketing decisions using the CRAI token.
A strong and interesting project with a unique idea.
On the chart, it has formed a descending channel, and the 0.236 resistance has been broken on the 3-day chart.
The price movement is expected as shown in the chart
Best regards Ceciliones🎯

UNIUSDT UPDATEUNIUSDT is a cryptocurrency trading at $6.780. Its target price is $10.000, indicating a potential 50%+ gain. The pattern is a Bullish Falling Wedge, a reversal pattern signaling a trend change. This pattern suggests the downward trend may be ending. A breakout from the wedge could lead to a strong upward move. The Bullish Falling Wedge is a positive signal, indicating a potential price surge. Investors are optimistic about UNIUSDT's future performance. The current price may be a buying opportunity. Reaching the target price would result in significant returns. UNIUSDT is poised for a potential breakout and substantial gains.

DOTUSDT IDEADOTUSDT is a cryptocurrency trading at $4.415. Its target price is $7.500, indicating a potential 70%+ gain. The pattern is a Bullish Falling Wedge, a reversal pattern signaling a trend change. This pattern suggests the downward trend may be ending. A breakout from the wedge could lead to a strong upward move. The Bullish Falling Wedge is a positive signal, indicating a potential price surge. Investors are optimistic about DOTUSDT's future performance. The current price may be a buying opportunity. Reaching the target price would result in significant returns. DOTUSDT is poised for a potential breakout and substantial gains.

PEPEUSDT UPDATEPEPEUSDT is a cryptocurrency trading at $0.00729. Its target price is $0.01400, indicating a potential 100%+ gain. The pattern is a Bullish Falling Wedge, a reversal pattern signaling a trend change. This pattern suggests the downward trend may be ending. A breakout from the wedge could lead to a strong upward move. The Bullish Falling Wedge is a positive signal, indicating a potential price surge. Investors are optimistic about PEPEUSDT's future performance. The current price may be a buying opportunity. Reaching the target price would result in significant returns. PEPEUSDT is poised for a potential breakout and substantial gains.

LUNAUSDT UPDATELUNAUSDT is a cryptocurrency trading at $0.1946. Its target price is $0.3500, indicating a potential 85%+ gain. The pattern is a Bullish Falling Wedge, a reversal pattern signaling a trend change. This pattern suggests the downward trend may be ending. A breakout from the wedge could lead to a strong upward move. The Bullish Falling Wedge is a positive signal, indicating a potential price surge. Investors are optimistic about LUNAUSDT's future performance. The current price may be a buying opportunity. Reaching the target price would result in significant returns. LUNAUSDT is poised for a potential breakout and substantial gains.

FIDAUSDT UPDATEFIDAUSDT is a cryptocurrency trading at $0.1094. Its target price is $0.2400, indicating a potential 100%+ gain. The pattern is a Bullish Falling Wedge, a reversal pattern signaling a trend change. This pattern suggests the downward trend may be ending. A breakout from the wedge could lead to a strong upward move. The Bullish Falling Wedge is a positive signal, indicating a potential price surge. Investors are optimistic about FIDAUSDT's future performance. The current price may be a buying opportunity. Reaching the target price would result in significant returns. FIDAUSDT is poised for a potential breakout and substantial gains.

SHELLUSDT UPDATESHELLUSDT is a cryptocurrency trading at $0.3100. Its target price is $0.4500, indicating a potential 60%+ gain. The pattern is a Bullish Falling Wedge, a reversal pattern signaling a trend change. This pattern suggests the downward trend may be ending. A breakout from the wedge could lead to a strong upward move. The Bullish Falling Wedge is a positive signal, indicating a potential price surge. Investors are optimistic about SHELLUSDT's future performance. The current price may be a buying opportunity. Reaching the target price would result in significant returns. SHELLUSDT is poised for a potential breakout and substantial gains.

ACAUSDT UPDATEACAUSDT is a cryptocurrency trading at $0.0430. Its target price is $0.0800, indicating a potential 80%+ gain. The pattern is a Bullish Falling Wedge, a reversal pattern signaling a trend change. This pattern suggests the downward trend may be ending. A breakout from the wedge could lead to a strong upward move. The Bullish Falling Wedge is a positive signal, indicating a potential price surge. Investors are optimistic about ACAUSDT's future performance. The current price may be a buying opportunity. Reaching the target price would result in significant returns. ACAUSDT is poised for a potential breakout and substantial gains.

JAMBO WITH AN AI PHONE?!BYBIT:JUSDT.P
Jambo seems like they are doing the most... while researching i came across jambo and kind of dug into what they are trying to accomplish and its quite impressive. With jambo built on the BYBIT:SOLUSDT.P train these guys have release an AI orientated phone. Here is the description on the phone below.
"Description
The JamboPhone 2 continues our mission to empower users globally! For only $99, your device comes with the powerful JamboGPT, bringing cutting edge AI to the palm of your hands. The JamboPhone 2 also includes the JamboPlay dapp store, JamboEarn opportunities and JamboWallet. You have a JamboPhone, you have a job! Start earning today ✌️
Fully equipped with:
Jambo Ecosystem applications including JamboApp, JamboGPT and more
Charging Cable (Type-C)
Charging Adapter
Sim Key
User Manual
Phone Case
*The JamboPhone offers compatibility with 3G and 4G networks in emerging markets across Africa, Latin America, and Southeast Asia, ensuring seamless connectivity for users. For broader network coverage, the JamboPhone supports most major carriers worldwide that do not require phone packages. Alternatively, users can may utilize WiFi for connectivity.
*The JamboPhone 2 comes with RAM and vRAM"
For only $99 in this day and age, crazy to think how something this new and low scale for most average humans will be so so expensive one day and right now you can take advantage for $99... anyway back to the chart basically if this shows a nice support IM IN ALL DAY!
Thanks guys

LPTUSDT UPDATELPTUSDT is a cryptocurrency trading at $7.414. Its target price is $14.000, indicating a potential 90%+ gain. The pattern is a Bullish Falling Wedge, a reversal pattern signaling a trend change. This pattern suggests the downward trend may be ending. A breakout from the wedge could lead to a strong upward move. The Bullish Falling Wedge is a positive signal, indicating a potential price surge. Investors are optimistic about LPTUSDT's future performance. The current price may be a buying opportunity. Reaching the target price would result in significant returns. LPTUSDT is poised for a potential breakout and substantial gains.

LAYERUSDT UPDATELAYERUSDT is a cryptocurrency trading at $0.7311. Its target price is $1.3000, indicating a potential 85%+ gain. The pattern is a Bullish Pennant, a continuation pattern signaling a trend continuation. This pattern suggests a brief consolidation before a strong upward move. A breakout from the pennant could lead to a significant price surge. The Bullish Pennant is a positive signal, indicating a potential trend continuation. Investors are optimistic about LAYERUSDT's future performance. The current price may be a buying opportunity. Reaching the target price would result in significant returns. LAYERUSDT is poised for a potential breakout and substantial gains.

AUCTIONUSDT UPDATE
AUCTIONUSDT is a cryptocurrency trading at $14.18. Its target price is $26.00, indicating a potential 100%+ gain. The pattern is a Bullish Falling Wedge, a reversal pattern signaling a trend change. This pattern suggests the downward trend may be ending. A breakout from the wedge could lead to a strong upward move. The Bullish Falling Wedge is a positive signal, indicating a potential price surge. Investors are optimistic about AUCTIONUSDT's future performance. The current price may be a buying opportunity. Reaching the target price would result in significant returns. AUCTIONUSDT is poised for a potential breakout and substantial gains
