AIXBT Swing Trade Buy / Long SetupMarket is taking some good correction, Also It has cleared almost all liquidity below side, Now It can move towards upside. Must wait for the entry. It's a swing trade so it can take time on entry and tp. Best Of Luck.
Aixbtusdtidea

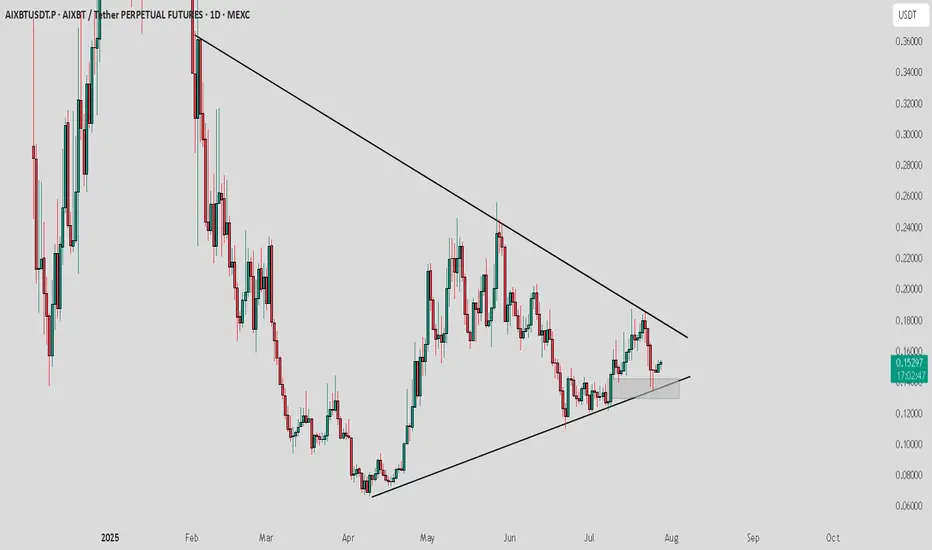
AIXBT / USDT : Getting support and moving towards resistance AIXBT/USDT is currently forming a symmetrical triangle pattern and testing a key support zone. A short-term rally of around 10% towards the upper resistance is expected, leading to a potential breakout.
Bullish Scenario:
A solid breakout above the upper trendline could initiate a major rally, targeting levels around $0.18 and higher.
Watch for confirmation of the breakout for a sustained move.
Targets for the short-term rally:
Expect a move towards $0.18 before the breakout happens. A major rally will commence once the breakout occurs. 🚀
Stay patient and keep an eye on the price action for potential entry points! 📈
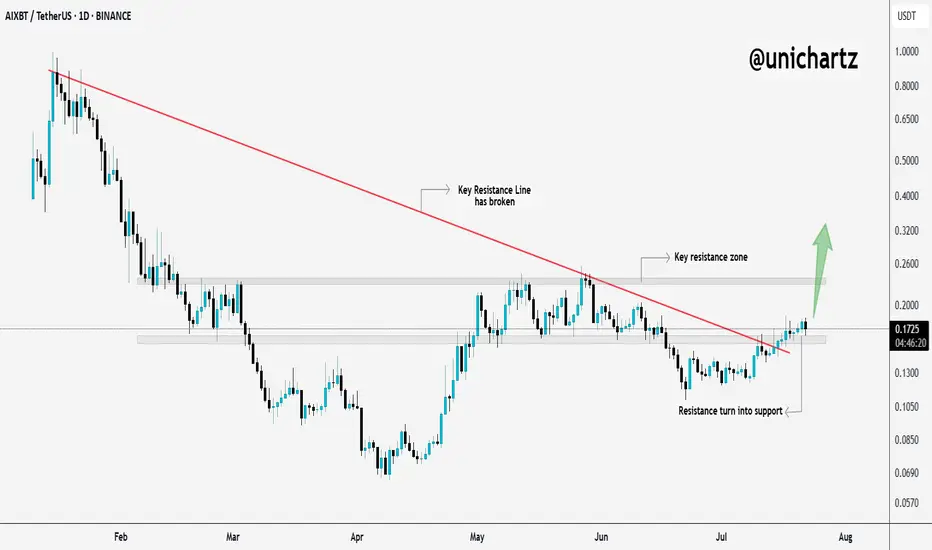
$AIXBT Breaks Trendline – Sharp Move Ahead?$AIXBT just broke out of its downtrend and flipped resistance into support, classic breakout behavior.
It’s now pushing toward a key resistance zone, and if it clears that level, we could see a sharp move up.
Momentum is shifting, this chart deserves your attention.
DYOR, NFA
AIXBT/USDT – Symmetrical Triangle Squeeze! A Major Move is Brewi🔍 Market Structure Overview
AIXBT/USDT is currently forming a well-defined Symmetrical Triangle pattern on the 1D timeframe, signaling a tightening consolidation between lower highs and higher lows.
Price is consolidating just above a strong demand zone between $0.1200–$0.1350, suggesting accumulation by smart money. This triangle formation represents a classic volatility squeeze, where price coils before a significant breakout or breakdown.
These setups are often the calm before the storm—and they typically lead to explosive moves once price escapes the pattern.
✅ Bullish Scenario (Breakout Upwards)
If price breaks above the descending trendline and clears the $0.1664 horizontal resistance level, it could ignite a powerful bullish run toward the following targets:
1. 🎯 Target 1: $0.2255 – Previous swing high & structural resistance.
2. 🎯 Target 2: $0.3942 – Strong horizontal resistance from historical price action.
3. 🎯 Target 3: $0.5982 – Mid-term Fibonacci/volume confluence level.
4. 🚀 Ultimate Target: $0.8763 – Psychological level and former macro resistance.
> Breakout Confirmation: Look for a daily candle close above the triangle with a surge in volume for confirmation.
❌ Bearish Scenario (Breakdown)
If bulls fail to break out and the price breaks down below the triangle and loses the $0.1200–$0.1349 support zone, the following downside targets come into play:
1. ⚠️ Support 1: $0.0950 – Previous local low.
2. ⚠️ Support 2: $0.0750 – A historical accumulation zone.
3. ⚠️ Support 3: $0.0590 – Major demand floor and last line of defense.
This would invalidate the current bullish structure and signal a potential mid-term trend reversal.
📐 Pattern Highlight: Symmetrical Triangle
Nature: Neutral continuation/reversal pattern, depending on breakout direction.
Volume Behavior: Typically contracts as price nears the apex, then expands post-breakout.
Strategy: Smart entries usually occur on breakout + retest with volume confirmation.
🧠 Final Thoughts
AIXBT/USDT is reaching a critical inflection point. The symmetrical triangle formation is nearing its apex, suggesting that a large move is imminent. Whether the breakout will be bullish or bearish depends on how price behaves at the key boundaries outlined.
📢 Pro Tip: Watch for breakout direction, volume spikes, and possible retests to position accordingly. Don’t forget to set stop-losses in either scenario to manage risk effectively.
#AIXBT #CryptoBreakout #SymmetricalTriangle #TechnicalAnalysis #AltcoinSetup #ChartPatterns #VolumeAnalysis #SupportAndResistance #CryptoTrading #CryptoTA

AIXBTUSDT 1DAIXBT ~ 1D Analysis
#AIXBT Buy gradually after successfully penetrating this resistant line with a short -term target of at least 15

AIXBT COIN UPDATE AND NEXT POSSIBLE MOVES!!$AIXBT Coin Update!!
• Keep Your eyes on it... Any Time 15%-30% bounce back expected in its price if market stay little bit stable🫡
Reason : on chain data & technical analysis with market current conditions totally fit with this coin ( according to my analysis)
But without SL Trade is Not recommended... Still if you want to buy it in spot ( without SL)🚨then i will recommend don't use up 10% of your portfolio... No one Knows what will happen next🙈
Warning : That's my idea DYOR Before taking any action🚨

AIXBT/USDT 1H: Hidden Bullish Divergence – Potential Reversal??!AIXBT/USDT 1H: Hidden Bullish Divergence – Potential Reversal at $0.1850?
🚀 Follow me on TradingView if you respect our charts! 📈 Daily updates!
Current Market Structure:
Price at $0.1776 is exhibiting a bearish distribution pattern with lower highs.
Clear resistance is observed at $0.1850.
Market Maker Activity:
Accumulation is evident in the $0.1700-0.1750 zone, suggesting that institutional players are positioning for a reversal.
Smart Money appears to be building positions at these levels.
Technical Indicators:
Hidden bullish divergence is present on RSI at 46.36 relative to price action, signaling potential for a reversal despite the bearish setup.
Trade Setup (Confidence 8/10):
Long Entry: At $0.1776.
Targets:
T1: $0.1850
T2: $0.1950
Stop Loss: Place at $0.1700 (below key support).
Risk Score:
7/10 – Favorable risk-to-reward, with clear entry, target, and stop levels.
Key Levels:
Support: $0.1700, $0.1650
Resistance: $0.1850, $0.2000
Recommendation:
Recommend a cautious long position given the accumulation signals and hidden bullish divergence.
Maintain tight stops below $0.1700 to manage risk effectively.
Monitor price action near $0.1850 for further confirmation of upward momentum.
🚀 Follow me on TradingView if you respect our charts! 📈 Daily updates!

#AIXBTUSDT: Get Ready for a Breakout! Short Still the Priority?BYBIT:AIXBTUSDT.P is showing significant weakness after a prolonged downtrend, and now the market is at a critical level. Buyers failed to initiate even a minor rebound, indicating strong selling pressure.
🔎 Key Factors Right Now:
✔ Current Price: $0.23480
✔ Daily Change: -10.76%
✔ Key Levels:
🔹 Resistance: $0.38080, $0.31670
🔹 Support: $0.22063
━━━━━━━━━━━━━━━━━━━━━━
💡 Main Signals Influencing the Market:
📌 No rebound after the drop – the lack of buying pressure increases the chances of further decline.
📌 Empty space ahead – below $0.2206, there are no strong support zones, meaning a sharp drop could follow.
📌 Closing near a critical level – price remains at risk, increasing the likelihood of a breakdown.
📌 Breakout from consolidation – the asset has left its range, signaling the potential formation of a new trend.
━━━━━━━━━━━━━━━━━━━━━━
📉 Main Scenario: Continued Decline
🔻 If BYBIT:AIXBTUSDT.P breaks below $0.2206, the market may accelerate downward:
✅ Target 1: $0.2100 – the nearest technical support.
✅ Target 2: $0.1955 – a zone where a short-term bounce could occur.
✅ Target 3: $0.1780 – a major support level where stronger buyer resistance is expected.
📢 Short remains the priority as long as price stays below $0.2300.
A breakdown of $0.2206 could trigger liquidations and accelerate the drop.
Be cautious with long positions – there are no strong reversal signals yet.
━━━━━━━━━━━━━━━━━━━━━━
🟢 Alternative Scenario: Bullish Reversal
If BYBIT:AIXBTUSDT.P holds above $0.2300 and starts to recover, potential targets include:
✅ Target 1: $0.2700 – a local resistance zone.
✅ Target 2: $0.3167 – a level where a pullback is likely.
✅ Target 3: $0.3800 – a key resistance, breaking which could change the overall trend.
📢 A long entry is only valid if price holds above $0.2400.
Reversal confirmation requires an increase in volume and stability above $0.2500.
📢 As long as the price is below $0.2300 – long positions remain risky.
Conclusion : Critical Moment! Be Ready for a Sharp Move!
📌 BYBIT:AIXBTUSDT.P is at a make-or-break level – any move could lead to an explosive price shift.
📌 Sellers remain in control, but if $0.2300 holds, an unexpected rebound could happen.
📌 Short remains the main scenario, unless price successfully stabilizes above $0.2400.
🚀 Get ready for a major move! Watch $0.2206 closely – this level will determine BYBIT:AIXBTUSDT.P is next direction! 🔥

#AIXBTUSDT continuation of the downtrend📉 SHORT BYBIT:AIXBTUSDT.P from $0.2255
🛡 Stop Loss: $0.2366
⏱ 1H Timeframe
✅ Overview:
➡️ BYBIT:AIXBTUSDT.P continues its downtrend, forming lower highs and lower lows.
➡️ The price has broken the $0.2290 liquidity zone and is holding below it, signaling weak buying pressure.
➡️ If sellers maintain control at $0.2255, a drop towards $0.2040 is likely.
➡️ POC at $0.2566 suggests the main volume accumulation is above the current price, reinforcing the bearish outlook.
➡️ High volume on recent candles indicates selling pressure, which could accelerate the downtrend.
⚡ Plan:
📉 Bearish Scenario:
➡️ Enter SHORT from $0.2255 if price confirms a breakdown.
➡️ Risk management with Stop-Loss at $0.2366, above key resistance.
🎯 TP Target:
💎 TP1: $0.2040 — strong support and profit-taking zone.
📢 BYBIT:AIXBTUSDT.P is in a bearish phase. If the price holds below $0.2255, further downside movement towards $0.2040 is expected.
📢 However, if the price reclaims $0.2366, the bearish scenario could be invalidated, leading to a potential bullish correction.
🚀 BYBIT:AIXBTUSDT.P Expecting a continuation of the downtrend!

AIXBT/USDT: Potential Bullish ReversalHey traders!
Looking at the AIXBT/USDT chart BINANCE:AIXBTUSDT , we've recently witnessed a significant low, which has caught my attention for a potential long opportunity. I'm anticipating an upward price movement that could signal the start of a new bullish trend.
To ensure a safer and more calculated entry, I'm planning to initiate a buy trade above the $0.8000 level. This would provide confirmation of a potential breakout and reduce the risk of entering prematurely.
My targets for this trade are:
Target 1: $1.000
Target 2: $1.1500
While this analysis focuses on the potential for an upward move based on the recent low, it's important to note that this chart doesn't include a detailed breakdown of specific technical indicators or patterns. Further analysis incorporating tools like trendlines, Fibonacci retracements, or oscillators could provide additional confluence and strengthen the trade idea.
As always, remember to manage your risk appropriately and consider your own trading strategy.
Happy trading! 🥳

AixbtUSDT Analysis & IdeaHey traders!
Looking at the AixbtUSDT chart, we can see the price recently pulled back after reaching $0.5980, which coincided with the top of an ascending channel. This correction found support just below the 0.50 Fibonacci retracement level.
With the overall market showing strength and increasing volume in altcoins, particularly Bitcoin and Ethereum, AixbtUSDT appears to be resuming its upward momentum and targeting the $0.65 area.
Key Resistance Levels:
$0.5700
$0.6100
Trade Idea:
Entry: Long above $0.4800
Stop Loss: $0.4600
Remember:
This is just my personal view, and it's important to always do your own research before making any trading decisions.
Keep an eye on volume and price action for confirmation of any potential breakouts.
Consider setting stop-loss orders to manage your risk effectively.
Let me know your thoughts on AixbtUSDT!
Happy trading!
