Altcoin Correction Scenario: Where to Look for EntriesHi traders and investors!
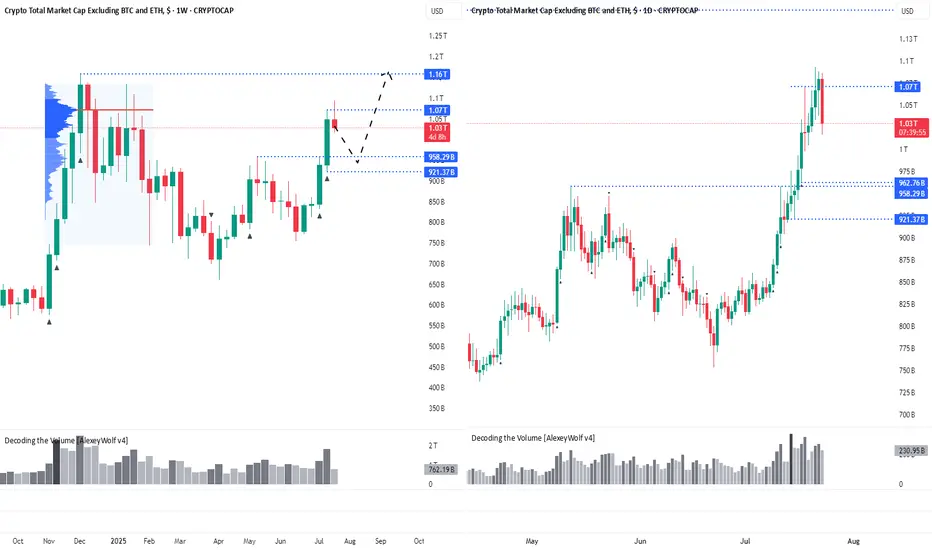
The market capitalization of Total3 has reached $1.07 trillion, marking the first major target for the altcoin market.
This level corresponds to the Point of Control (POC) from the previous bullish rally and the subsequent correction — a key area of traded volume and market interest.
Several factors now suggest the potential for a continued move higher. On the fundamental side, the recent signing of a pro-crypto bill by Donald Trump has boosted overall sentiment in the digital asset space, especially among altcoins. From a technical perspective, many leading altcoins are showing bullish continuation patterns.
Ideally, if the altcoin market corrects its capitalization (Total3) into the 963B–921B range, it would be a good zone to look for buying opportunities with the target of renewing the capitalization ATH.
Wishing you profitable trades!
Alexeywolf
Altcoin Market Hits First Target at $1.07THi traders and investors!
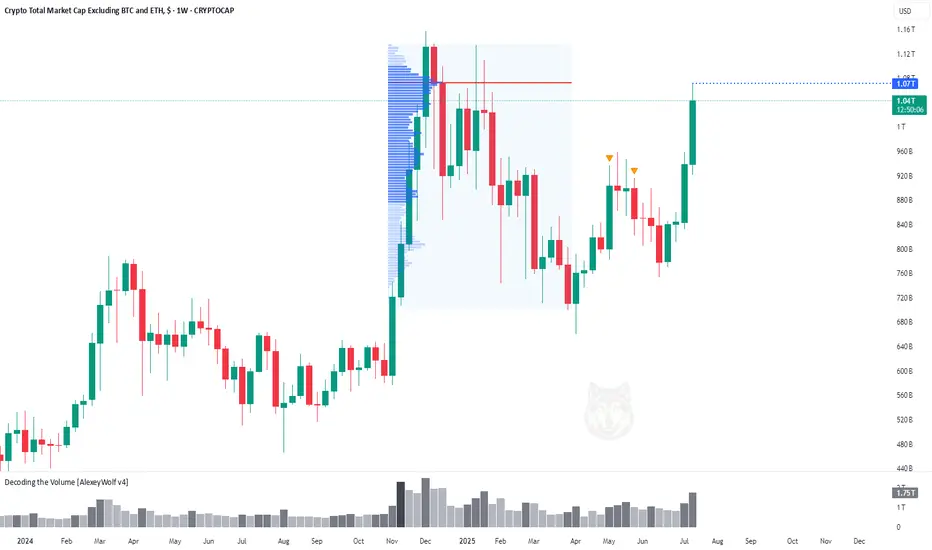
The market capitalization of Total3 has reached $1.07 trillion, marking the first major target for the altcoin market.
This level corresponds to the Point of Control (POC) from the previous bullish rally and the subsequent correction — a key area of traded volume and market interest.
Several factors now suggest the potential for a continued move higher. On the fundamental side, the recent signing of a pro-crypto bill by Donald Trump has boosted overall sentiment in the digital asset space, especially among altcoins. From a technical perspective, many leading altcoins are showing bullish continuation patterns.
Wishing you profitable trades!
Gold. 3310 reaction & will Buyers reach their remaining targets?Hi traders and investors!
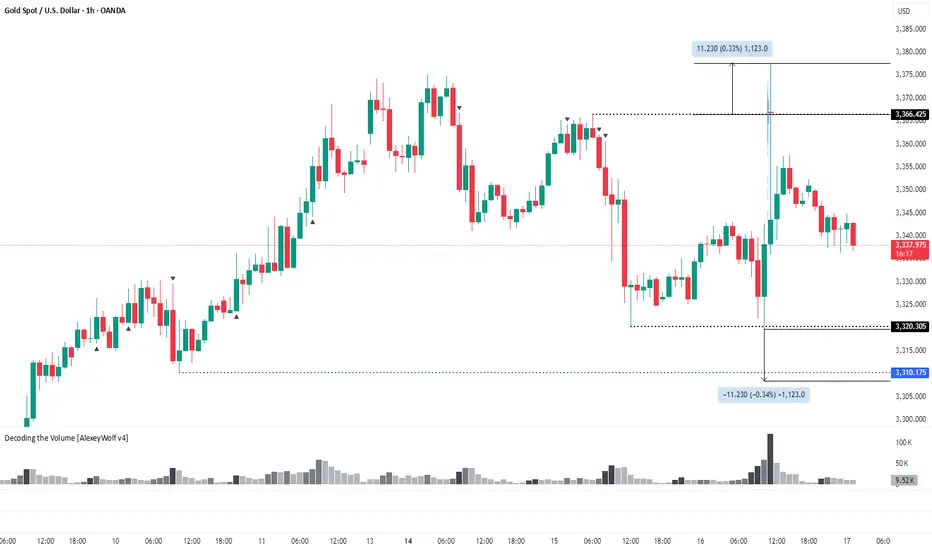
The 3310 level worked out perfectly. We can see a familiar buy pattern forming.
If the buyer fails to push the price higher and the seller returns to the 3310 level, it's likely that the price will continue to decline on the daily timeframe toward the next nearest targets — 3244, or more likely, 3154.
For now, however, we still expect the buyer to pursue the remaining unmet targets at 3393 and 3403.
This analysis is based on the Initiative Analysis concept (IA).
Wishing you profitable trades!
Gold. Where to look for buy setupsHi traders and investors!
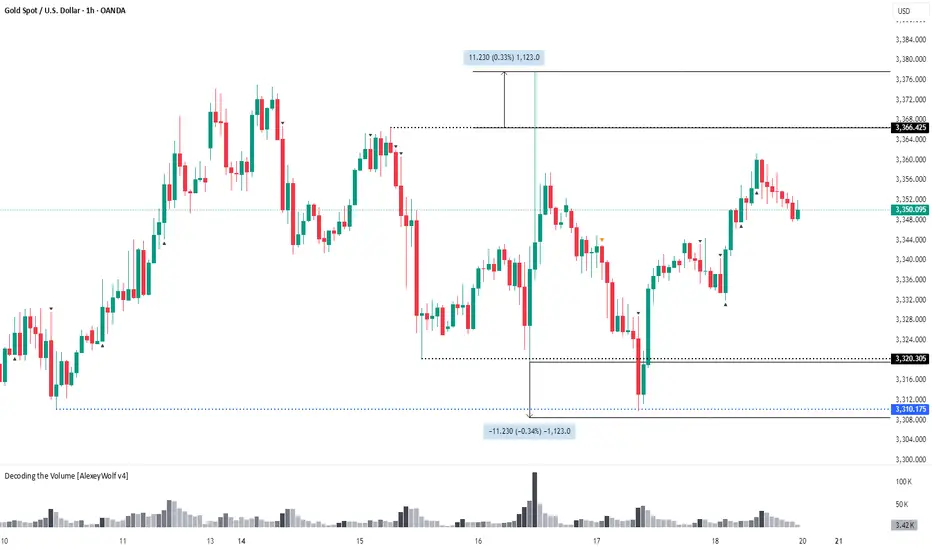
The price is currently in a sideways range, with the boundaries marked by black lines.
Sellers defended the buyer's first attempt to break through the 3366 level — the key volume in the candle that touched this level was accumulated exactly at that point.
Now, it would be ideal to symmetrically expand the range downward by 11.230 points, which would bring the price right to the 3310 level.
From the 3310 level, it makes sense to look for potential buy patterns.
This analysis is based on the Initiative Analysis concept (IA).
Wishing you profitable trades!
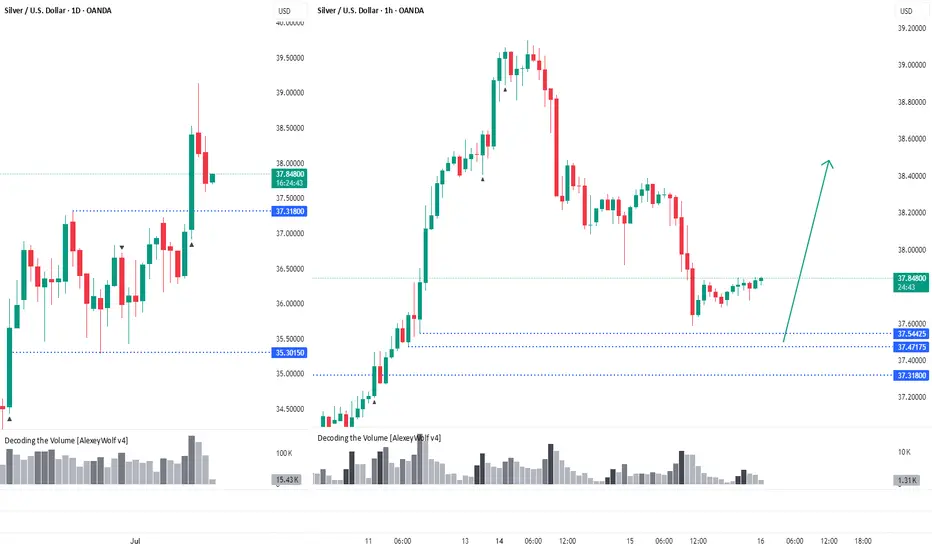
Silver. The price has pulled backHi traders and investors!
On the daily timeframe, the price has broken out of the sideways range through the upper boundary at 37.31.
The price has pulled back close to levels where potential buy patterns could form — 37.54, 37.47, and 37.31.
This analysis is based on the Initiative Analysis concept (IA).
Wishing you profitable trades!
BTCUSDT. Current scenario range Current scenario range — can shift depending on how the market reacts next.
This analysis is based on the Initiative Analysis concept (IA).
Wishing you profitable trades!
OPUSDT: Buyers try to regain control inside the rangeHi traders and investors!
On the daily timeframe, OPUSDT is trading in a sideways range. The price has repeatedly dipped below the lower boundary at 0.545, but each time, buyers managed to bring it back.
Now, we’re seeing another attempt to return into the consolidation zone — a possible sign of renewed buyer initiative.
If the price secures above 0.545, the path opens toward the next targets at 0.844 and 0.954. However, a short-term dip below 0.52 may occur within this bullish scenario.
Therefore, buying becomes a priority once the price is firmly back above 0.545.
This analysis is based on the Initiative Analysis concept (IA).
Wishing you profitable trades!

Final move by the bears? Bulls lining up for ATHHi traders and investors!
Buyers have reached the first target at 108,952.
On Binance spot, BTC missed the second target (110,530.17) by just 99 cents.
Is this a setup for a breakout and a run toward a new ATH?
So far, the price action looks like a level manipulation around 108,952: volume in all 3 bars interacting with this level is concentrated above it.
Just below lies a buyer zone (107,500 – 105,100).
I am watching for buyer reaction once the price reaches this area.
This analysis is based on the Initiative Analysis concept (IA).
Wishing you profitable trades!

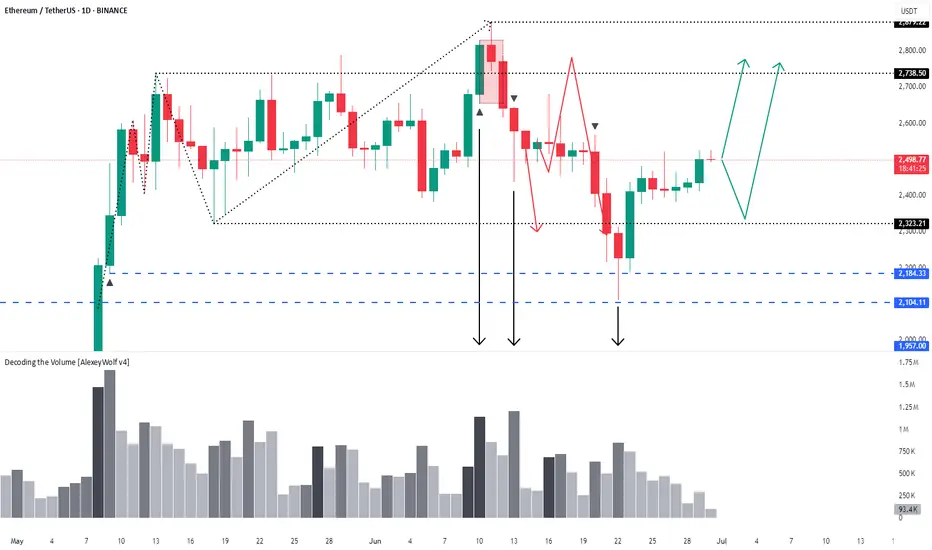
Ethereum – 1D timeframe overview with Initiative AnalysisHey traders and investors!
The seller has reached their target.
A buyer started buying from the 2184 level and now holds the initiative.
Targets are on the chart.
This analysis is based on the Initiative Analysis concept (IA).
Wishing you profitable trades!
Silver - overview with Initiative AnalysisHey traders and investors!
Hourly Timeframe
📍 Context
The hourly chart is in a sideways range.
Currently, the buyer has the initiative, potential target 36.55.
📊 Key Actions
The 35.30 level on the hourly timeframe has worked well. This level marks the correction extreme within the dominant buyer initiative (i.e., an initiative where the correction is less than 50%).
A seller attack bar (IKC) targeting the lower boundary of the sideways range was absorbed by the buyer, and this absorption led to a renewed buyer. Targets visible on the chart - Hourly and daily timeframe: 36.55 and 36.89
Daily Timeframe
📍 Context
Currently, the buyer has the initiative, potential target 36.89.
📊 Key Actions
On the daily timeframe, there was also a seller IKC bar attacking the lower boundary of the buyer's initiative, which was bought back by the buyer.
🎯 Trade Idea
Potential buying patterns can now be monitored at: 36.20, 36.05, 35.67, 35.458
With targets set at: 36.55, 36.89, 37.32.
This analysis is based on the Initiative Analysis concept (IA).
Wishing you profitable trades!

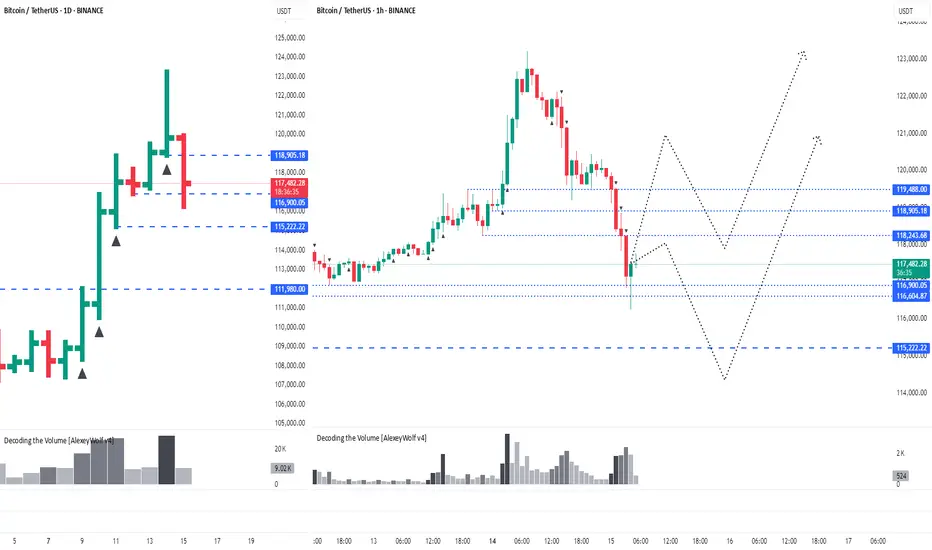
Bitcoin - overview with Initiative AnalysisHey traders and investors!
📍 Context
On the daily timeframe, the market is in a sideways range.
The boundaries are marked with black lines.
Buyer initiative is currently active.
Targets: 108,952; 110,530; 111,980.
📊 Key Actions
The seller attempted twice, on increased volume, to break down below the range, but both times the buyer brought the price back inside. Only seller wicks remained below the lower boundary.
🎯 Trade Idea
🔹 Look for long setups from 105 500 -104,622 or the 103,400–100,718 zone.
There is no context for short trades at the moment.
This analysis is based on the Initiative Analysis concept (IA).
Wishing you profitable trades!

GOLD. Daily Timeframe overview with Initiative AnalysisHey traders and investors!
Daily Timeframe
Market phase : sideways. Seller's initiative.
Boundaries marked with black lines.
Gold followed an alternative scenario from the previous review toward 3435. The buyer played out the 8-9 vector of the range on the daily timeframe, and now the initiative has shifted to the seller. The seller's targets are 3245 and 3201 — areas to watch for potential buy patterns aiming for a new ATH. The price might get stuck in the 3293–3271 zone. If a strong buyer reaction occurs, a reversal may happen in this range.
The ideal area to look for buy patterns is around 3201.
Selling is risky.
This analysis is based on the Initiative Analysis concept (IA).
Wishing you profitable trades!

Ethereum – 1D timeframe overview with Initiative AnalysisHey traders and investors!
The price has reached the lower boundary of the range. There is no volume spike.
I expect a further decline toward 2184 and 2100. The 2100 level is a contextual area to look for buying patterns.
As part of a correction, the price could potentially drop to 1800. Monitoring.
This analysis is based on the Initiative Analysis concept (IA).
Wishing you profitable trades!

BTCUSDT. Initiative Analysis Market OverviewHey traders and investors!
📍 Context
On the daily and 4H timeframes, the market is in a sideways range (Black lines = range boundaries).
Buyer initiative is active on 4H. The target initiative is 108,952.
However, on the daily timeframe, the seller initiative is in control, and a seller zone has formed. The seller zone is the red rectangle on the chart.
📊 Key actions
The buyer attempted to break out of the range on the daily timeframe twice, but both times the seller pushed the price back inside.
The price is currently interacting with the seller zone. Watching for the reaction.
🎯 Trade Idea
🔸 Long positions — with caution. Only valid if the price holds above 105,336, aiming for the target at 108,952.
🔸 Until that happens, the priority is on further downside, in line with the current seller initiative on the daily. It’s reasonable to look for short setups if the seller defends 105,336.
This analysis is based on the Initiative Analysis concept (IA).
Wishing you profitable trades!

Ethereum. Daily Timeframe. Seller initiativeHey traders and investors!
📍 Context
• Market phase: Sideways range
• Current control: Seller initiative
📊 Key Price Action:
The price broke above the upper boundary of the range (2738) with a buyer KC candle, touching the 50% retracement level (2874) of the last weekly seller initiative (1).
However, the seller absorbed the buyer’s candle and pushed the price back inside the range (2), forming an IKC candle (3) — the highest volume candle within the seller’s initiative.
This sequence presents three bearish signals that support a potential continuation to the downside.
🎯 Trade Idea
Likely scenario: price tests the lower boundary of the range at 3,323.
🔸 In the meantime, it’s reasonable to look for short setups on lower timeframes within the current seller initiative.
🔸 If price reaches 3,323 and valid buyer patterns appear, this zone may offer a good opportunity for long entries.
This analysis is based on the Initiative Analysis concept (IA).
Wishing you profitable trades!

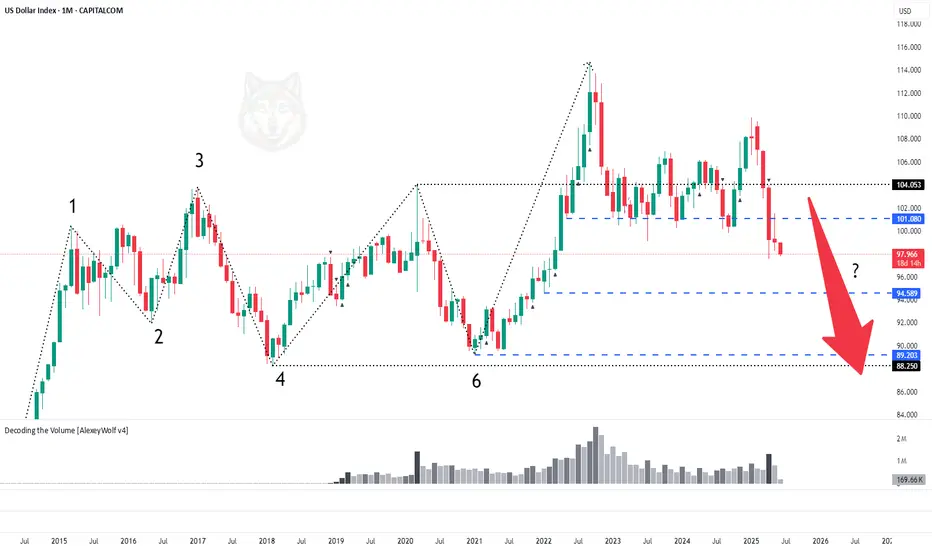
DXY. Midterm Analysis of the US Dollar IndexHey traders and investors!
📍 Context
On the monthly timeframe, the market was in a range. The price broke above the upper boundary and was long supported around the 101.080 level. This level was repeatedly tested by sellers and now appears to have been broken.
📊 Monthly targets: 89.20 and 88.300.
🔎 Analysis
Why might the downward movement continue?
Daily TF
On the daily chart, we can see that on the day buyers returned to the 101.080 level, the main volume was accumulated in a buyer candle right at and slightly above the level. This suggests the level was defended by sellers. This indicates they are currently in control, and the decline may continue. Let’s look at the nearest potential buyer activity levels.
11-day TF
The price has once again broken downward out of the range. Below, there is a small consolidation area formed during the previous upward movement. Its boundaries are: upper boundary — 97.385, lower boundary — 94.589.
🎯 Trade Idea: Rebounds from the upper boundary at 97.385 are possible, but overall the priority remains with a move into this range and towards the 95.00–94.589 zone.
This analysis is based on the Initiative Analysis concept (IA).
Wishing you profitable trades!
GOLD 4HLocal range near top of broader sideways (gray lines = local range).
Seller broke down from it.
Price now in buyer zone — possible buyer reaction. Just below: a gap.
Seller targets: 3271, 3245.
Conservative shorts: watch for buyer activity + seller defending local range breakout (3333).
Note: buyer initiative still active on daily TF (!).
For longs, better to wait near 3245–3271 and look for bullish patterns.
This analysis is based on the Initiative Analysis concept (IA).
Wishing you profitable trades!

GOLD — Daily & 4H Timeframes📍 GOLD — Daily & 4H Timeframes
On the daily timeframe, gold is targeting the 3435 level.
On the 4-hour chart, buyers attempted to break out of the sideways range, but the price was pulled back inside.
A second attempt also failed — only the wick extended beyond the range, where the key volume is located.
It’s likely that the price will test the buyer zone again (blue rectangle on the chart), which also contains a price gap.
The boundaries of the sideways ranges are marked with black lines.
This analysis is based on the Initiative Analysis concept (IA).
Wishing you profitable trades!

EURUSD — Daily & 4H TimeframesThe correction continues on EURUSD.
Both the daily and 4H timeframes show sideways ranges, with seller initiative in control. The boundaries of the sideways ranges are marked with black lines.
However, sellers appear weak — the price has been stuck for several hours inside a buyer attack bar near the upper boundary of the range. Now, sellers are attempting to absorb this buyer bar.
If considering long setups, it's safer to look for patterns near the daily level of 1.13126, or from the lower boundary of the 4H range.
Another option is to wait for a confirmed breakout above the range.
Searching for buys in the upper part of the current range is risky.
This analysis is based on the Initiative Analysis concept (IA).
Wishing you profitable trades!

Where to Look Today: 5 Hot Crypto Sectors with Real UtilityHello traders and investors!
These five sectors are seen as the most promising areas for crypto market development. Each represents real blockchain applications, not just speculation: they enable simpler, faster, and cheaper access to finance, data, and computing power. Based on them, you can build a diversified crypto portfolio. Each sector offers unique drivers—from real-world assets to AI. This selection helps you navigate trends and pick promising tokens according to your strategy and investment horizon.
1. Real-World Assets (RWA)
What it is: Real assets—such as bonds, real estate, or commodities—are digitized and issued as tokens on the blockchain. These tokens can be bought, sold, used as collateral, or integrated into DeFi applications.
Why it’s growing: Institutional players (funds, corporations, DAOs) are seeking reliable yield and transparency. Over $7 billion has already been invested in tokenized US Treasuries.
Top tokens:
ONDO: Token of Ondo Finance: offers access to tokenized funds, including U.S. Treasuries from BlackRock.
CFG: Token of Centrifuge: connects real assets (invoices, equipment, real estate) to DeFi, allowing companies to receive financing.
POLYX: Token of Polymesh: a blockchain specialized in securities tokens, with a focus on regulation and compliance.
RIO: Token of Realio: merges traditional assets (e.g., real estate) with DeFi and private equity potential.
2. Ethereum Layer-2 / Rollups
What it is: Layer-2 networks (Optimistic and ZK-rollups) process transactions separately and then send them to Ethereum in batches. This lowers load, speeds up the network, and reduces fees.
Why it’s growing: Layer-2 scales Ethereum without compromising security. Transactions become cheaper, dApps faster, and startups/corporates can build without overloading the base layer.
Top tokens:
ARB: Token of Arbitrum, the largest Optimistic Rollup network.
OP: Token of Optimism, which is being integrated into various partner projects and DAOs.
zkSync: Layer-2 platform based on ZK-rollups, focused on scalability and privacy. Native token: ZK.
STRK: Token of StarkNet, one of the most advanced ZK-based solutions.
3. Restaking & EigenLayer Ecosystem
What it is: If you’ve already staked ETH, you can reuse it by delegating it to EigenLayer, which lends it to other protocols. If they act honestly, you earn extra yield. This is restaking.
Why it’s growing: One ETH can now generate multiple streams of income. Restaking increases capital efficiency and supports a new ecosystem of reliable services that don’t need their own security. Total Value Locked (TVL) has already exceeded $15 billion, and the EIGEN token has just launched.
Top tokens:
EIGEN: Native token of EigenLayer.
ETHFI: Ether.fi platform issues eETH and enables restaking without transferring ETH custody to third parties.
PUFFER: Protocol offering pufETH—a token for restaking in EigenLayer. It features enhanced protection from price manipulation and MEV (Maximum Extractable Value) front-running, focusing on security and restaking yield optimization.
RSETH: Token from KelpDAO earned via restaking through EigenLayer. It's a liquid equivalent of a staked token, usable in DeFi apps while your ETH keeps working.
4. Yield Tokenization
What it is: Splitting an asset into two parts: principal and future yield. This lets you sell or buy just the yield the asset will generate.
Why it’s growing: It brings flexibility to financial planning. Users can lock in returns or buy discounted yield. A bond-like market within DeFi emerges. Traders, funds, and DAOs benefit from flexible and strategic income management.
Top tokens:
PENDLE: Sector leader; supports yield trading from crypto assets (e.g., stETH) and tokenized RWAs. Enables separating "principal" and "interest" to trade them independently—like selling a bond coupon without selling the bond itself.
ELEMENT: Allows trading fixed and variable yields. Users can split a yield-bearing token (like an LSD) into two parts—one entitled to yield, one not.
SWIVEL: Designed for institutional clients: supports KYC/AML and packages deals as fixed-rate, long-term bonds, easily understood by funds and treasuries. Works with crypto assets (e.g., staking and DeFi tokens) but presents them in traditional finance format.
5. AI & Decentralized Compute
What it is : Projects at the intersection of AI and blockchain: decentralized rendering, GPU power exchange, model training, and data sourcing.
Why it’s growing: Decentralized compute enables AI scaling without centralized cloud dependence. It boosts privacy and global access to AI infrastructure.
Top tokens:
FET: Fetch.AI: platform for creating "smart agents" — AI that can autonomously negotiate, buy or sell services and data. Entirely blockchain-based and mediator-free. Promising for automation in logistics, smart cities, and data economy.
TAO: Token of Bittensor: a network where thousands of participants train and share AI models. TAO is used for payments, rewards, and governance. Think of it as "Bitcoin for neural networks."
RNDR: Render Network connects users with spare GPU power to those who need rendering. A decentralized cloud-rendering system paid in tokens. In demand for 3D, film, and metaverses.
GRT: The Graph helps find and structure data from decentralized apps. Like Google for Web3—essential for the growing Web3 ecosystem.
Each of these sectors reflects real utility and demand for blockchain innovation. Following them may help you form a future-proof, high-conviction crypto portfolio.
Wishing you profitable trades!

WTI Crude: Bears Target 60.549 USDHey traders and investors!
🔹 Crude Oil — 1D / 4H
📍 Context
Daily (1D): clear short trend; price capped below 65.40 USD.
4-Hour (4H): sideways range — its boundaries are marked by black lines on the chart — with seller initiative in control.
Higher-time-frame levels reinforce the bearish bias.
🔎 Analysis
Sellers keep the upper hand on 4H. The daily shows no strong buyer bars, sustaining downward pressure. If price retests the IKC zone and prints bearish confirmation (high-volume seller bar or buyer absorption), the odds of breaking 60.549 USD increase.
🎯 Trade Idea
Setup: hunt for short patterns inside the IKC range.
Target: 60.549 USD (range low).
Confirmation: pattern on M15–H1 + seller-side volume.
📌 Takeaway
Bears remain in control. Wait for a trigger inside the IKC zone and lower-TF confirmation before joining the move toward 60.549 USD.
This analysis is based on the Initiative Analysis concept (IA).
Wishing you profitable trades!

Bitcoin is approaching a “Golden Cross”🚀 Bitcoin is approaching a “Golden Cross”
(the 50-day moving average is about to cross above the 200-day)
What does that mean, and what might come next?
📍 What’s happening right now
BTC is squeezed in a $101 K – $107 K range.
The 50-day SMA is racing toward the 200-day SMA; the bullish crossover (the “Golden Cross”) is expected within the week.
On Deribit, more than 60 % of the 30 May option series are $110 K call options.
When traders buy these calls, market-makers hedge by buying spot BTC. The nearer the price gets to $110 K, the more spot BTC they have to buy.
📈 How the market behaved before
The 10-day chart shows the 50-day (blue) and 200-day (orange) SMAs.
In the last three cycles, a bullish Golden Cross appeared 50–90 days after a bearish “Death Cross.” Each time, the cross formed inside a buyer zone (marked with blue rectangles).
In the 2nd and 3rd cycles, price never came back to retest that buyer zone.
Right now, the buyer zone is already in place, the Golden Cross is only about $300 away, and 50 days have passed since the last Death Cross. Some traders seem to be buying early, betting on a break to a new all-time high (ATH).
Wishing you profitable trades!

Watching 3265 — The Key Level for Gold BuyersHey traders and investors!
📊 GOLD / W + D
📍 Context
On the weekly timeframe: a seller candle with increased volume but no result — the close is above 3201. This gives buyers a chance to take over the initiative.
On the daily timeframe: the buyer has brought the price back into the range (lower boundary at 3201), which also keeps the door open for bullish scenarios.
🎯 Trade Idea
Consider long positions after the price holds above 3265
Potential targets: 3435 and 3500
📌 Conclusion
Bulls have a chance — it's important to watch the price behavior around 3265 and look for long setups on lower timeframes. For example, a retest of 3265 after a breakout and absorption of the retest candle by the buyer, similar to what happened at the 3167 level on the hourly timeframe.
