BTCUSDT. Short term analysisHello traders and investors!
On the daily timeframe we see a resumption of buyers from the buyer's zone (blue background) with an upper boundary of 69674.
On the hourly timeframe, a sideways trend has formed, where the buyer's vector 4-5 has already reached the obligatory target. Searching for sales is risky because there is a resumption from the buyer's zone on the daily timeframe. It is not systematic to look for purchases at the upper boundary of the sideways.
It is better to look for purchases at the lower boundary of the sideways trend, for example, from the buyer's protection levels at 69071, 67518.
Sales are advisable to look for below the level of 67518 as an idea for implementing the seller's vector 9-10 of the sideways trend on the daily timeframe with the first target at 64493 (second - 60775).
As before, I am waiting for a repeated interaction of the price with the level of 72419.
By the way, purchases could be found yesterday on the 30-minute timeframe (see the chart).
Alexeywolf

ETHUSDT. Looking for purchasesOn the daily timeframe we have a sideways market. The bearish vector 5-6 has been played out. The price has already interacted with the level of 3200. Priority is given to considering purchases, preferably from the zone between 3200 and 3400, with the initial target at 3722.

ETHUSDT. Monitoring the seller's actions.Hello traders and investors!
It's time to update the forecast. During the last review (22.03.2024), we observed a short vector 5-6 in the sideways trend on the daily timeframe. The target of the long vector 6-7 was 3722 (see the chart from the last review). Currently, the long vector 6-7 has reached this target. At the top, there is a seller's zone with a lower boundary of 3722 (red background). So far, we haven't seen any reaction from the seller in this zone.
It is advisable to look for sales at the upper boundary of the sideways trend. However, for short positions, the first threat is the buyer's zone (blue color) with an upper boundary of 3505, which formed on the daily timeframe. There is a high probability that the buyer will reach the level of 3822.
On the hourly timeframe, a sideways trend has formed with boundaries of 3727 and 3665. I am waiting for the price to interact with these boundaries. We can look for a trade opportunity based on the protection of these boundaries.
For a more detailed explanation of how to read charts and consider different timeframes when looking for trades, you can refer to the article

Trade in a sideways marketMain price pattern of financial instruments
So, when we talk about the price of financial stuff, like stocks or crypto, it often moves in specific ranges over different timeframes, right? Whether it's weekly, daily, hourly, or even minute charts, prices tend to hang out in these ranges for a while. Traders call this kind of price movement "consolidation," "range-bound," or simply a "sideways market."
In this article, we'll just call it a sideways market or range. When prices are stuck in this sideways action, they can break out with a sudden burst of momentum, kickstarting a trend, or they might just keep bouncing around, forming a new sideways pattern.
Let's check out the daily chart of BTCUSDT starting from October 2021. On the chart (see above), we've marked those periods where the price was moving sideways with blue markers. Since October 2021, we've spotted 7 of these sideways patterns. We label the first point of each sideways move as "1". Out of 884 trading days, the price was stuck in this sideways action for 758 days (884 - 72 - 39 - 15), which makes up about 85%. This means that throughout this whole period, you could've been looking at trades from one edge of the sideways range to the other.
Based on my estimates, most financial instruments spend more than 75% of their time in this sideways market mode.
So, knowing how to trade in sideways markets is a super important skill for traders. And for investors, understanding these sideways moves can really amp up the profitability of their investments by pinpointing better entry and exit points.
For example, right now, considering buying BABA stocks might be a good idea because the price is chilling at the bottom of a sideways range on the weekly chart.
Example1
Mastering the Skills for Successful Trading in Sideways Market
Being able to effectively trade within trading ranges, between their boundaries, requires not only a certain amount of knowledge but also the development of specific skills. Initially, one must grasp the theoretical foundations and then apply them in practice, gradually honing their skills. Let's look at the necessary skills:
Skill 1: Understanding and applying the Concept of Time Frame (TF) Interconnection: higher TF, lower TF. Grasping the context of the higher TF in relation to the sideways market TF.
Skill 2: Identifying sideways market: determining the absolute and current boundaries of the range, as well as the current direction (vector) of price movement.
Skill 3: Recognizing zones of interest for buyers and sellers.
Skill 4: Determining the presence of buyers at the lower boundary (bottom protection by buyers) and sellers at the upper boundary (top protection by sellers).
Skill 5: Adhering to risk management principles when entering trades (especially crucial for traders).
Each of these skills is based on a vast amount of knowledge that needs to be absorbed first and then applied in practice. The journey can be long and sometimes tedious. Is there a way to hack this system and shorten the time it takes to acquire knowledge, develop skills, and start trading? Well, there are options. For example, you can use technical indicators (such as RSI, Bollinger Bands, ATR, etc.) to make buying or selling decisions. Or you could completely bypass the process of acquiring knowledge and skills and rely on signals from Telegram channels or expert opinions. But what will you find there about trading in sideways market (ranges), where the market spends more than 75% of its time?
This series of articles is written for those who are ready to take control of their financial destiny, who strive to understand how financial markets work, and who want to master the skills of independent trading and making more informed investment decisions. Here you will find the knowledge and tools to start understanding what is happening in the financial markets and how to profit from it. I don't promise any magic pills or "money" buttons:).
So, let's get started.
Skill 1: Applying the Concept of Time Frame Interconnection
The higher time frame (TF) always takes precedence over the lower one. For instance, if we observe on the daily chart that the market is in a seller's zone (which is determined by Skill 3), then on the hourly chart, we need to analyze the seller's actions (Skill 4) and primarily look for selling opportunities. However, there might be a situation where the seller is inactive, and the price starts to rise due to buyer pressure (in this case, Skill 4 comes into play again).
Example2
On the provided chart, areas of seller interest are marked in red, while buyer interest areas are marked in blue. Let's examine the period from March 25th to March 27th, highlighted in yellow on the chart.
On the daily TF, we observe sideways movement since December 22, 2023, with the bearish vector (11-12) being relevant. The first target of the bearish vector, 3.119, was reached on March 19, 2024. The second target (2.822) and the third (2.611) remain valid. On March 25th, the price returned to the seller's zone on the daily chart (the red zone with the lower boundary at 3.680).
On the hourly chart, on March 25th, the price trend reached the daily seller's zone and formed a range with 7 points. The breakout from this range occurred downwards on March 27th. Therefore, in this range, it was advisable to look for selling opportunities from the upper boundary and riskily consider buying from the lower one.
Similarly, you can make investment decisions by analyzing, for example, the weekly and daily TFs.
To be continued...
P.S. This is indeed an interesting point! Despite the fact that the market spends more than 75% of its time in sideways movement, indicators and strategies specifically designed for trading in this mode have not gained as much popularity as other trading approaches. Even on the internet, including TV and trading Telegram channels, signals or analyses based on identifying sideways movement are very rarely encountered. If you have experience or knowledge about trading methods in sideways markets (including indicators), please share them in the comments!

KMB.Medium-term analysisOn the weekly timeframe we have a sideways market. The current buyer vector is 16-17.

BTCUSDT. Correction or range?On the daily timeframe the market is consolidating sideways. A short vector of 7-8 is observed. It is not advisable to seek sales at the bottom of the range. It is advisable to look for purchases after the price interacts with the zone of 59000-61500 and a buyer emerges (result, spread, volume).

SOLUSDT. Intraday tradeIf the price returns to 197.95 now and if the seller defends this level, then we can look for a short with a target of 178.55."

NQ. Short or LongIf liquidity is not removed at the level 18172 before the NY session, and shorting does not occur, then was liquidity left there to go long?

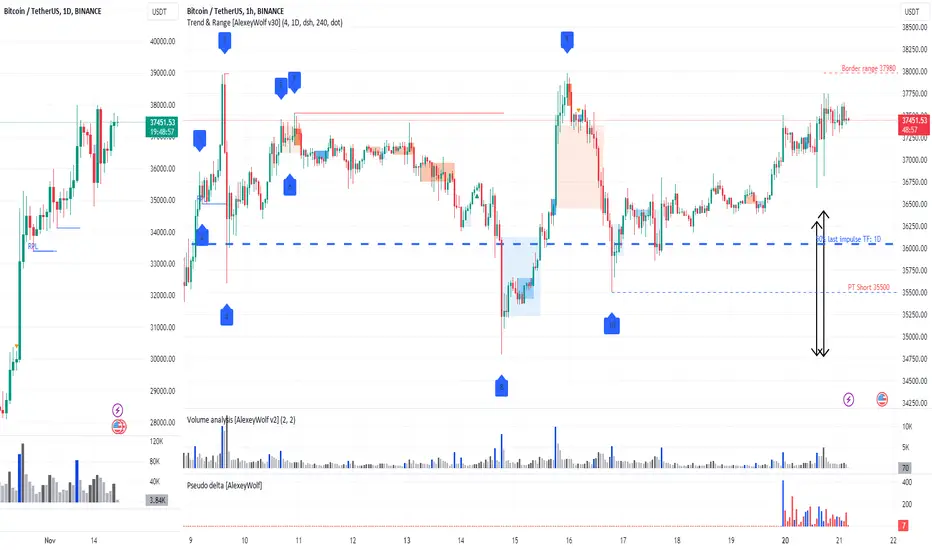
BTCUSDT. Waiting for the local high to be updated. Highlights
Waiting for the price to interact with the upper boundary of the sideways range at 37980.
Preference (buying/selling) - neutral.
Description
On the hourly timeframe, a sideways movement has been observed since November 9th. The upper boundary of the sideways range is at 37980. Judging by the wicks of yesterday's hourly candles (see chart), buyers are pushing the prices beyond the sideways range. Buying at the top of the range is not systematic. But if you really want to trade, you can aggressively look for buys when buyers defend the wicks of yesterday's hourly candles. (if the price returns there before breaking out of the sideways range).
31812, 36677 - boundaries on the five-minute timeframe
37302 - boundary on the one-minute timeframe.
BTCUSDT. Waiting for actions from buyers and sellers.Highlights
The previous scenario played out.
Awaiting actions from buyers and sellers.
Preference (buying/selling) - neutral.
Description
On the daily chart, buyers resumed from the discount zone (bottom 50%) of the last daily impulse and absorbed the seller's candle on increased volume, forming a buyer's zone (blue color, upper edge of the daily buyer zone 37337.57). This scenario was described here
On the hourly chart, the price is at the upper boundary of the range, but considering the daily context, selling immediately is risky. It is necessary to assess the actions of the seller and the buyer. If the seller breaks the level of 37337.57 and defends it, you can look for sales with the first target at 36744 (upper edge of the daily buyer zone), the second target is 36000. Conservatively look for buys if the buyer breaks the upper boundary of the range (37972.24) and defends this breakout.
