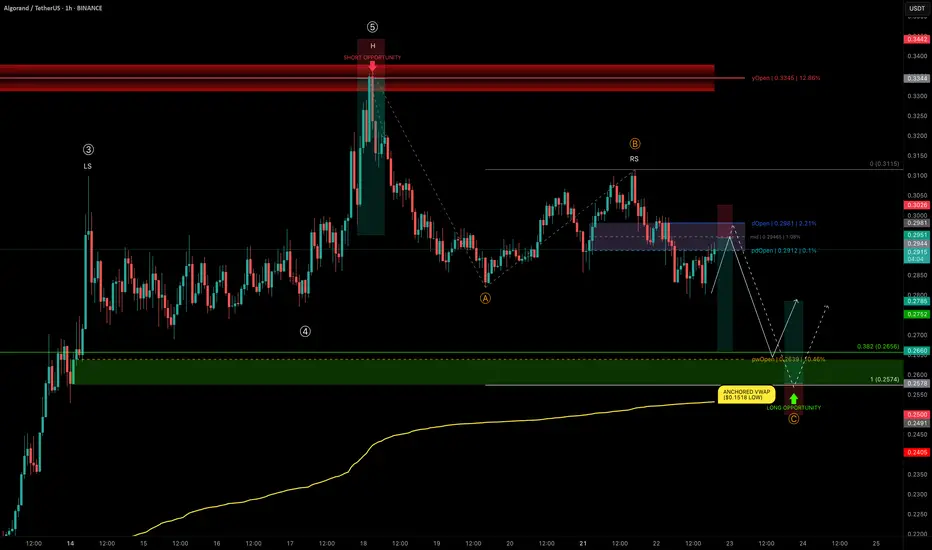
ALGO rejects at yOpen — Mapping High-Conviction Trade ZonesALGO has delivered an impressive +124% rally from $0.1518 to $0.336 in just 25 days, completing a 5-wave Elliott impulse right into the yearly open resistance.
We are now in a correction phase, and the current structure is showing a head and shoulders pattern, with the right shoulder currently forming.
Let’s break down the key levels and setups.
🧩 Technical Breakdown
➡️ ABC Corrective Structure:
Targeting wave C near the trend-based fib extension (TBFE) at $0.2574
➡️ Fib Retracement Confluence:
0.382 retracement of the entire 5-wave move → $0.2656
Previous weekly open (pwOpen) → $0.2639
Liquidity pocket likely to be swept
Anchored VWAP from the $0.1518 low (start of the bullish trend) → currently at $0.2532, acting as a major support layer
Conclusion: Long opportunity zone between $0.2656–$0.2574
Trade Setups
🔴 Short Setup:
Why? ALGO has lost dOpen and pdOpen — a bearish sign for downward continuation.
Entry Zone: Between dOpen and pdOpen
Stop-loss: Above dOpen
Target (TP): 0.382 fib retracement (~$0.2656)
R:R: ≈ 1:3.5
🟢 Long Setup:
Entry Zone: Laddered Entries between $0.2656–$0.2574
Stop-loss: Below anchored VWAP (~$0.2532)
Target (TP): ~$0.2785+
R:R: ≈ 1:2.65
🛠 Indicator Note
I’m using my own indicator called "DriftLine - Pivot Open Zones " for this analysis, which I recently published.
✅ Feel free to use it in your own analysis!
Just head over to my profile → “Scripts” tab → apply it directly to your charts.
💡 Educational Insight: Why Confluence Matters
High-probability trades aren’t based on just one tool or level — they come from confluence, where multiple signals align: fib levels, VWAP, liquidity pools, price structures , and key levels.
For example, in this ALGO setup, it’s not just the fib retracement or just the VWAP — it’s the stacking of all these elements together that creates a precise zone with a better statistical edge.
✍️ Lesson: Don’t chase trades off single signals; stack tools for confirmation.
Patience, confirmation, and confluence — as always, the keys to high-probability setups. 🚀
_________________________________
💬 If you found this helpful, drop a like and comment!
Want breakdowns of other charts? Leave your requests below.
Algo
H&S on $ALGO
H&S almost reached the target move. If you missed an entry on EURONEXT:ALGO , this might be a good entry buy. Head and Shoulders

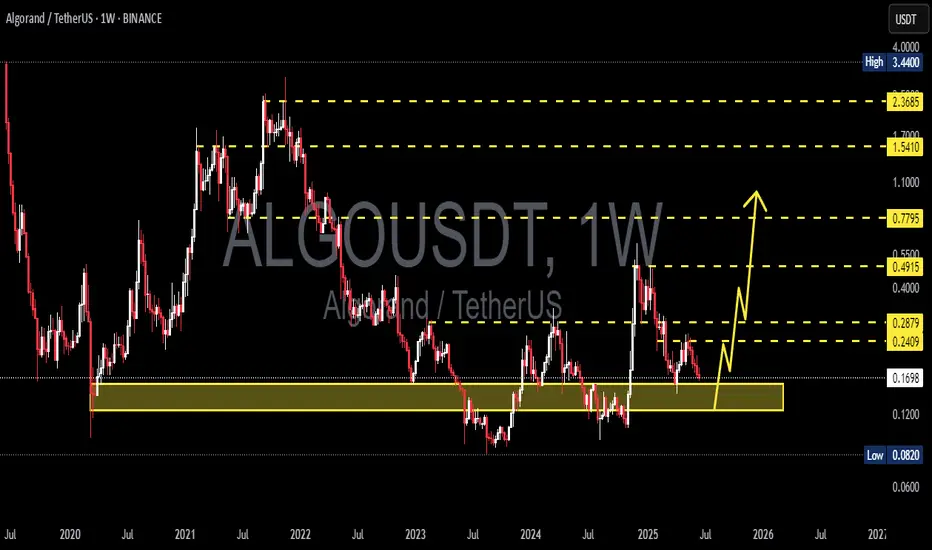
ALGOUSDT Approaching Breakout!BINANCE:ALGOUSDT is showing a potential trend reversal after bouncing from a strong historical demand zone around $0.15. Price action is testing the descending trendline for a breakout, which could trigger a bullish continuation move. Similar to the previous breakout in late 2024, this setup hints at a possible repeat rally. A weekly close above the trendline would confirm strength, opening targets at $0.32 and $0.70+.
COINBASE:ALGOUSD

Algorand breaking up from inverse head and shouldersSeems like most of the cryptos from the iso20022 compliant chains are breaking out right now and algorand is no exception. Most likely in anticipation of Fednow’s migration to it tomorrow. *not financial advice*

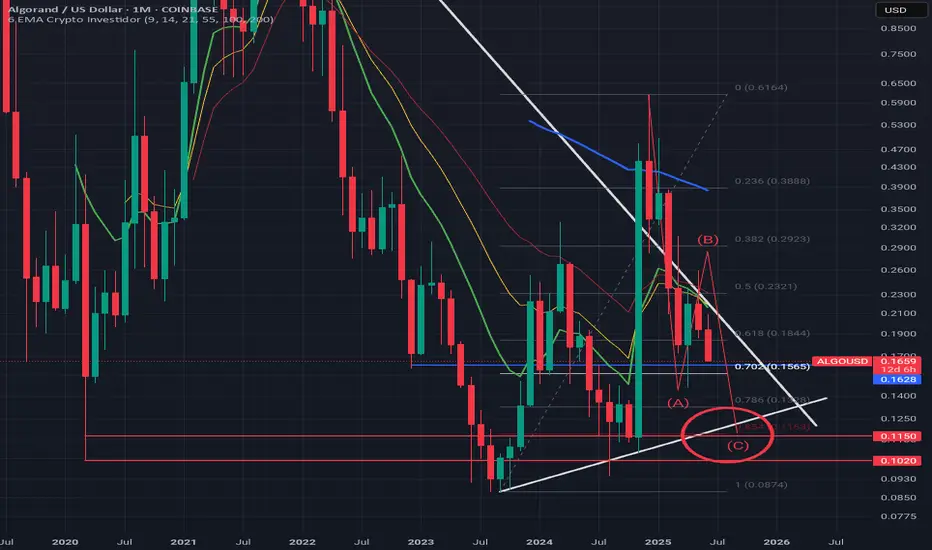
$0.10 inbound. BUY OpportinityIMO, were going to backtest the 2020 lows, and complete the ABC correction/C Leg down to the 0.854FIB and wick down into the $0.10s if you can catch a falling knife and go LONG!!!
Algorand ALGO price analysis#Algo price is being held back from a deep dive, as far as it is appropriate to say that about altcoins right now.
The price decline on reduced volumes is similar to the previous two times on the OKX:ALGOUSDT chart.
🙂 A risky purchase from $0.15, if they hold the price there, it will be very cool.
📈 And if not, then “buckets” for buying in the $0.10-0.11 range, if you believe in the prospects of the #Algorand project
👊 And keep your fingers crossed, because there is a hypothetical chance that the price of #ALGO will rise to the $1.35-1.41 range by the end of this year, but everyone will have to be very lucky)
____________________
Did you like our analysis? Leave a comment, like, and follow to get more

ALGOUSDT 1W AnalysisALGO ~ 1W Analysis
#ALGO Buy back gradually from here with a short-term target of at least 20%++.
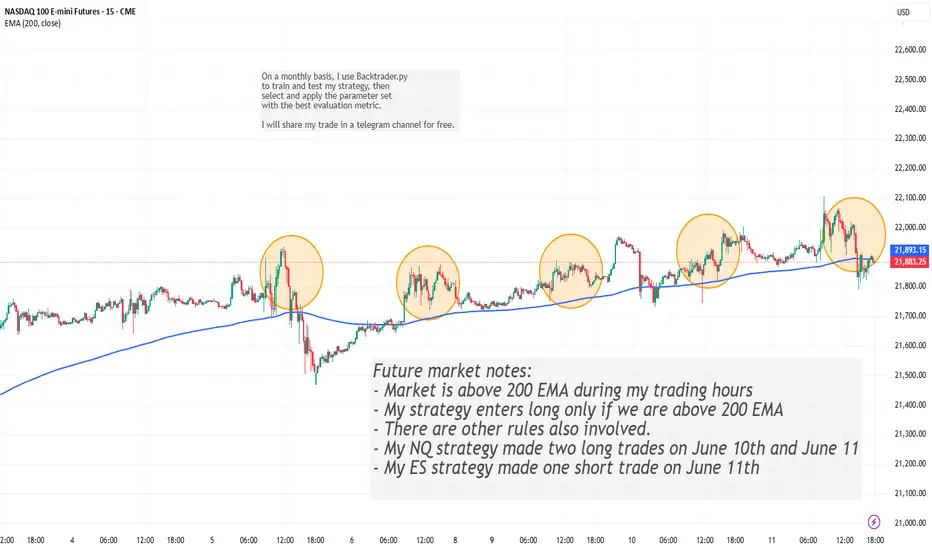
200 EMA Futures Strategy Recap: June 10–11Description:
Market Context:
During my trading window (11:00–17:00 ET), price remained decisively above the 200-period EMA.
Key Rule:
• As one of several entry conditions, the model only goes long when price is above the 200 EMA.
June 10–11 Trades:
NQ Strategy: Two long entries—one on June 10 and one on June 11.
ES Strategy: One short entry on June 11 (all other rules aligned).
Feel free to ask questions or share feedback!
TradeCityPro | ALGO: Bearish Pressure Builds Near Key Support👋 Welcome to TradeCity Pro!
In this analysis, I’m going to review the ALGO coin for you. The Algorand project is one of the Layer 1 and RWA projects.
⚡️ The coin, with the ticker ALGO, currently holds a market cap of $1.63 billion and ranks 53rd on CoinMarketCap.
⏳ 4-Hour Timeframe
As you can see in the 4-hour timeframe, after the price reached the 0.2505 resistance level, a bearish phase began, and with the breakdown of the 0.2123 level, the first bearish leg extended down to 0.1912.
✔️ After this drop, the price retraced up to the 0.382 Fibonacci level and now has returned to the 0.1912 zone. Given the strong bearish momentum in the market, the probability of breaking this level is quite high.
✨ If 0.1912 is broken, the extension wave could begin. According to Fibonacci projections, the targets for this position are 0.1780, 0.1732, and 0.1602.
💥 An entry of RSI into the Oversold zone would serve as a very strong momentum confirmation for this position. If that happens, the price may reach the 0.1602 target.
📊 Volume also plays a key role. Currently, the selling volume isn’t very strong, which might result in a fake breakout of 0.1912. I suggest waiting to see whether sell volume increases, because without volume, price movement is unlikely.
📈 For a long position, the first trigger we currently have is the 0.2023 level, which is a significant high and overlaps with the 0.382 Fibonacci retracement level. Breaking this level could resume the long-term bullish trend.
💫 The momentum confirmation for a long position would be the RSI breaking above the 50 level. A breakout here could kick off a bullish trend in the higher timeframes.
📝 Final Thoughts
This analysis reflects our opinions and is not financial advice.
Share your thoughts in the comments, and don’t forget to share this analysis with your friends! ❤️

ALGOUSDT 1D AnalysisALGO ~ 1D Analysis
#ALGO Buy back gradually from here with a short term target of at least 15%+ from here.

ALGOUSDT making its way for journey towards 0.35$Here is the idea about ALGOUSDT.
The price is currently trading at daily support DS1.
The price was rejected from weekly resistance WR1 before coming back to daily support zone DS1.
I believe this daily support is very likely to provide support and make the price bounce from here.
The likely trajectory of the price is depicted in the chart.
The price is likely to aim for weekly resistance WR1 next on this bounce.
At WR1, the price is likely to face some pullback before ripping this resistance and target the next strong resistance which is quarterly resistance 3MR1.
Lets monitor this one as we go and adjust our expectations. But for now this is what I see as the likely path for ALGOUSDT.
Whats your thought?

Algorand 5X Lev. Full PREMIUM Trade-Numbers (PP: 1500%)This is an unusual pair for us to approach with leverage, the last time we opened a LONG on ALGOUSDT was in August 2023. Market conditions are different today.
Back then, prices were trading at the bottom before the recovery, so we were predicting the trend reversal and bullish breakout. Today, the bottom pattern is already in, a rounded bottom coupled with a long-term higher low (April 2025 vs August 2024). So we are only predicting a continuation.
Needless to say, I believe the bulls have the upper-hand. The action right now is happening above the 3-Feb. low, and after more than a month of rising prices there is still no rising volume, which means that there is plenty of room available for growth.
We are doing an easy wave, easy targets. The final wave can go much higher than what is shown on this chart. Since we are not greedy, we are happy with 465% and 1,500%.
The 1,500% is a mild target and high probability.
The rest is up to you.
Thank you for reading.
Full trade-numbers below:
_____
LONG ALGOUSDT
Lev: 5X
Entry levels:
1) $0.2355
2) $0.2200
3) $0.2000
Targets:
1) $0.2564
2) $0.3247
3) $0.3800
4) $0.4352
5) $0.5138
6) $0.6139
7) $0.7243
8) $0.7926
9) $0.9031
Stop-loss:
Close weekly below $0.1900
Potential profits: 1502%
Capital allocation: 3%
_____
Namaste.

How To Spot The Next Big Algorand Crypto Move!In the fast-paced world of crypto trading, many traders gravitate toward intraday and scalping strategies, chasing quick profits while often ignoring the powerful signals presented by higher timeframes. Yet, the smart money — institutional players, whales, and seasoned swing traders — operate differently. They focus on bigger timeframe supply and demand imbalances to enter high-probability trades with calculated risk and substantial reward potential. One such opportunity is currently setting up in Algorand ( BINANCE:ALGOUSDT ).
Why Higher Timeframes Matter in Crypto Trading
Most crypto traders operate on the 1-minute to 15-minute charts. While this can be effective, especially with crypto intraday strategies, it often leads to overtrading and emotional decision-making. In contrast, higher timeframes — such as the daily and weekly charts — provide clearer market structure, show major supply and demand imbalances, and are less noisy.
These timeframes reveal where whales and institutions place large orders, creating impulsive moves that leave behind clues for patient traders. Ignoring these clues is akin to trading blind.
The Weekly Demand Imbalance on BINANCE:ALGOUSDT
BINANCE:ALGOUSDT is currently showcasing a textbook example of a solid and strong weekly demand imbalance around the $0.1380 level. A few months ago, this zone sparked a massive bullish impulse — a series of consecutive large-bodied white candlesticks that broke through resistance with conviction.
Such moves don’t happen randomly. They’re often the result of institutional accumulation — smart money stepping in with size. These large players create imbalances where demand far outweighs supply, causing prices to rally aggressively. The key for retail traders is to identify the origin of these moves and wait patiently for the price to return.

Algorand Inverse H&S
Algorand EURONEXT:ALGO inverse H&S developing, target .48, need to close .26 daily.

ALTCOIN BOOM FOR ALGORAND 2025-2026 PROPOSALAlgorand ( EURONEXT:ALGO ) is a layer-1 blockchain designed for speed, scalability, and sustainability. It uses Pure Proof of Stake (PPoS) to achieve fast, low-cost transactions while maintaining decentralization. Algorand’s niche is bridging TradFi and DeFi, with a focus on real-world assets (RWAs), CBDCs, and institutional adoption. Think of it as the “green Ethereum” with a compliance-friendly edge.
Recent News Launched “Algorand 2.0” with quantum-resistant cryptography and dynamic NFT standards. Secured a partnership with the IMF to pilot a cross-border CBDC project. EURONEXT:ALGO rallied 25% in July after months of stagnation, but still lags behind major layer-1 tokens.
Deep Dive Algorand’s quantum-resistant upgrade is a sleeper hit. While others focus on speed, ALGO is future-proofing against quantum hacks—a unique selling point for risk-averse institutions. The IMF partnership is HUGE, positioning Algorand as a potential CBDC backbone, but progress will be slow (TradFi moves at a glacial pace). Competitors like Hedera and Ripple are ahead in enterprise adoption, so ALGO needs to accelerate development.
Latest Tech or Utility Update
Update Details Algorand 2.0 introduced quantum-safe encryption, dynamic NFTs (updatable metadata), and “State Proofs” for trustless cross-chain interoperability.
Implications Quantum resistance is a long-term bet, but it’s a marketing win for institutional clients. Dynamic NFTs could revolutionize gaming and IP licensing. State Proofs allow Algorand to interact with chains like Bitcoin and Ethereum without bridges, reducing exploit risks. However, adoption depends on other chains integrating Algorand’s tech—a chicken-and-egg problem.
Biggest Partner & How Much Was Invested
Partnership Spotlight The International Monetary Fund (IMF) is testing Algorand for a multi-country CBDC network. No direct investment, but a 3-year technical collaboration.
Impact Analysis If the IMF pilot succeeds, Algorand could become the go-to chain for central banks. This would create significant demand for EURONEXT:ALGO as a settlement layer. However, CBDCs are politically charged—regulatory backlash could slow adoption.
Most Recent Added Partner & Details
New Collaboration Partnered with Circle to launch EURC and USDC natively on Algorand, enabling near-instant settlements. No funding disclosed, but revenue-sharing on stablecoin transactions.
Future Prospects EURC/USDC integration makes Algorand more attractive for DeFi and remittances. Short-term, this boosts liquidity; long-term, it could position ALGO as a Euro-on-ramp for institutions.
Tokenomics Update
Token Dynamics Fixed max supply of 10B EURONEXT:ALGO , with 7.3B already in circulation. Governance rewards slashed to 6% APY (from 8%) to reduce inflation. New burn mechanism: 0.1% of transaction fees destroyed monthly.
Deep Analysis The hard cap is bullish, but slow burn rates won’t offset inflation from vesting tokens. Lower governance APY might deter casual stakers, but it tightens supply. Algorand’s tokenomics still lack the deflationary firepower of ETH or BNB.
Overall Sentiment Analysis
Market Behavior Mixed bag: Retail remains cautious (social sentiment neutral), but whales are quietly accumulating. ALGO’s price is still 90% below its ATH, creating a “cheap layer-1” narrative.
Driving Forces CBDC hype and quantum-resistance FOMO. Critics argue Algorand’s marketing lags behind its tech, and ecosystem growth is too slow compared to Solana or Avalanche.
Deeper Insights Sentiment hinges on the IMF partnership delivering tangible progress. If the CBDC pilot stalls, ALGO could re-enter “zombie chain” territory.
Recent Popular Holders & Their Influence
Key Investors VanEck added EURONEXT:ALGO to its digital assets portfolio. Crypto whale "0x5a1D" bought 10M EURONEXT:ALGO in July, now a top 50 holder.
Why Follow Them? VanEck’s move signals institutional interest in Algorand’s CBDC potential. Whale “0x5a1D” has a history of accumulating undervalued layer-1s before rallies (e.g., bought DOT at $4 in 2023).
Summary & Final Verdict
Recap Algorand is a tech-first chain with strong partnerships (IMF, Circle) and cutting-edge upgrades (quantum resistance). However, its ecosystem growth lags, and tokenomics lack urgency.
Final Judgment EURONEXT:ALGO is a high-risk, high-patience play . It could 5x if CBDCs take off or quantum security becomes a priority, but institutional adoption takes time.
Considerations Can Algorand onboard enough devs to escape the “ghost chain” label? Will the IMF partnership lead to real CBDC deployments, or just research papers? How will ALGO’s inflation schedule impact price if adoption remains slow?
If you're bullish on CBDCs and quantum-resistant tech, accumulating under $0.20 could pay off long-term. If you prefer faster-moving projects, look elsewhere.

Algorand is slow and steadyALGO has begun an uptrend; a sustainable uptrend needs volume. Can the bulls bring it? The momentum is not overbought, which means the majority of the move up is not in; however, we could see a pullback or a consolidation before that happens.
Full TA: Link in the BIO

How to Trade Gold with AI-Powered Algos in 2025📊 How to Trade Gold with AI-Powered Algos in 2025
A practical action plan for serious gold traders
🔍 1. Know Why Gold Requires Custom Algo Tactics
Gold is volatile, news-sensitive, and driven by macro events like Fed policy, geopolitics, and inflation. Generic stock or crypto bots fail here — gold needs precise, event-aware automation.
🧠 2. Use AI-Powered Bots Trained for Gold Volatility
Deploy bots that adapt to real-time data like CPI releases, bond yields, and geopolitical headlines. Use machine learning models that detect gold breakouts, consolidations, and safe-haven flows.
Top AI algos for gold traders: Multiple systems based on MT4/MT5
Fully-automated, AI-based gold bot with breakout detection, precision entries, and built-in risk control.
⚙️ 3. Build or Choose the Right Algo Strategy for Gold
Trend-Following: Use 21/50 EMA crosses on H1 and H4
Mean Reversion: Bollinger Band fades in range-bound sessions
Breakout Algos: Trigger trades on CPI or FOMC event volatility
Volume-Based AI: Analyze volume spikes vs. historical patterns
🧪 4. Backtest Gold-Specific Models
Always test your bot using historical gold data, especially during NFP weeks, Fed meetings, and geopolitical escalations. Use data from 2018 to 2024 for high-volatility periods.
Tools: TradingView for Pine Script testing, MetaTrader 5 for EA deployment
🛡️ 5. Control Risk with Gold-Specific Parameters
Max drawdown: Keep under 15 percent
Stop-loss: Always use hard stops (not just trailing)
Position sizing: 0.5 to 1 percent of capital per trade
Use volatility filters: Avoid entries during thin liquidity hours
🔄 6. Automate Monitoring and Adaptation
Run multiple bots for breakout, momentum, and reversal setups
Use dashboards to track gold-specific metrics like VIX, USDX, DXY, and 10Y Treasury yields Integrate AI that adjusts parameters after major data releases
🚀 7. Prepare for 2025 Market Structure
Gold is increasingly driven by
Central bank digital currency rollouts
USD de-dollarization risks
Global stagflation or recession themes
DeFi and tokenized gold products
Your algo must factor in these macro narratives using real-time data feeds
📌 Gold Algo Trading Success Plan 2025
Use AI bots built for gold volatility
Trade high-probability breakouts post-news
Backtest with gold-specific macro filters
Maintain strict risk limits with max 15 percent drawdown
Monitor global news and macro data with bot triggers
Continuously optimize and adapt
Gold is not just a commodity — it’s a signal of global risk. Automate smartly, manage risk tightly, and use AI to stay one move ahead.

ALGO/USDTThe coin is exhibiting a local bullish market structure. A long position may be considered from the marked demand zone, contingent on favorable entry conditions. Upside targets are set at 0.2389, 0.2602, and 0.3078

ALGO/USDT - Long Setup Update on 3D Time Frame29.04.2025
On April 22, we had a long entry signal on the 3D time frame. As of today, the price remains around the same level.
The system’s rules are favourable for another long entry:
- Price > MLR > SMA > PSAR
- Price is above the 200 MA, reinforcing the bullish bias.
Consider a long entry at today’s close or at the close of this 3D bar. However, note that on the 1D time frame, the price is still below the 200 MA, which could act as resistance.
The PSAR stop-loss is a good option for spot trading, given its placement.
Keep an eye on updates and thank you for reading! 📈📊

We see greater potential in AlgorandWe see greater potential in Algorand, but we can't say with certainty that it will rise during this bull run. I believe the projects behind Algorand have a strong impact and could trigger significant hype. We're approaching a breakout point that could lead to another move upward. If we break through the $0.47 level, we would turn bullish and could expect the beginning of a hype cycle.

TradeCityPro | ALGO: Key Levels in RWA Coin’s Bullish Revival👋 Welcome to TradeCity Pro!
In this analysis, I’m going to review the ALGO coin for you. This project is one of the RWA (Real World Assets) crypto initiatives, which saw significant growth during the recent hype around this category.
💫 Currently, the market cap of this project stands at $1.99 billion, placing it at rank 47 on CoinMarketCap among crypto projects.
📅 Daily Timeframe
As you can see in the daily timeframe, ALGO has had a notable bullish leg that started from the 0.1085 level and continued up to 0.5138, marking a significant upward move.
💥 However, after reaching that level, the first corrective phase took place down to the 0.3267 support. After breaking this zone, the price continued falling to the 0.1602 support, which also overlaps with the 0.786 Fibonacci level.
🔍 After finding support there, a new high formed at 0.2147, and thanks to the strong buying volume and bullish candles, this resistance has been broken, and price is now heading upward.
📊 The RSI oscillator is currently very close to the Overbought zone, and if it enters that area, we might see some high-volatility moves, increasing the likelihood of sharp bullish candles.
📈 The next resistance levels above are 0.2553 and 0.3267, which align with the 0.5 and 0.382 Fibonacci levels respectively. If price can break through these levels and return to 0.5138, the chances of breaking that top will be significantly higher this time.
✨ On the other hand, if this breakout turns out to be a fake move and price falls below 0.2147, heavy bearish momentum could enter the market, greatly increasing the risk of breaking the 0.1602 level.
🎲 If the market continues to drop, the next major support to watch is 0.1085, which stands as the most critical support for ALGO.
📝 Final Thoughts
This analysis reflects our opinions and is not financial advice.
Share your thoughts in the comments, and don’t forget to share this analysis with your friends! ❤️

ALGO/USDT Technical Analysis Deep Dive! Let’s break down this ALGOUSDT chart step-by-step — it’s a perfect example of trading patterns in action!
🏄♂️ Timeline (Aug 2024 - April 2025):
▸ Accumulation (Aug - Nov 2024): ALGO consolidates between $0.1050 and $0.1450, showing low volatility. This is a classic accumulation phase where buyers are quietly building positions.
▸ Breakout & Uptrend (Nov - Dec 2024): Boom! The price breaks above $0.1300 with strong momentum, climbing to $0.6100.
▸ Pause in a Symmetrical Triangle (Dec 2024 - Jan 2025): After the surge, ALGO takes a breather, forming a Descending Triangle (a neutral pattern). This signals market indecision — traders are waiting for the next big move.
▸ Breakout & Downtrend (Jan - Mar 2025): The price breaks below the triangle, dropping to $0.1480. This aligns with a "Descending Wedge" (reversal) from the cheat sheet , confirming the downtrend and reversal structure of the Wedge.
▸ Consolidation (Mar - Apr 2025): ALGO stabilizes between $0.1400 and $0.1600, setting the stage for the next move.
▸ Breakout & Uptrend (Apr - April 2025): Another breakout! The price surges above $0.1600, reaching $0.2200 again. It might reach higher levels like $0.2400 and $0.3000 in next weeks.
This chart shows how patterns like Descending Triangles, and Wedges can guide your trades. Spotting these using my Trading Patterns Cheat Sheet can help you time your entries and exits like a pro!
✉️ What’s your next move on ALGO? Are you buying the dip, waiting for confirmation, or taking profits? Drop your thoughts below — I’d love to hear your strategy!

Algorand NLP & Higher High & 619% Profits PotentialThis is a very nice chart. Algorand is solid strong on the weekly timeframe (long-term).
There are two main signals; Long-term growth in the form of a rising channel, higher highs and higher lows. Short-term bullish based on a recovery.
Notice the "magic blue line" I drew on the chart. This is a bottom signal. You can draw an inverted head and shoulder here or a v shaped bottom. This week strong move seals the deal. A massive higher low compared to early August 2024.
Ok. How are you doing today my friend in the law?
I hope you are having a wonderful day.
You see...
Hear me out; listen!
Can you feel me?
Do you understand?
Do you grasp what I am trying to share with you?
Can you see what I am doing?
These are all different representational systems, people use difference senses to understand reality. Some are primarily visual, others auditory, kinesthetic, digital, etc.
So, you are likely the feeling type, then, can you grasp what I am trying to say? Are we on the same wavelength? Does it resonate with you?
Yes? Then Algorand is bullish and going up. Why?
Because the chart says so. Because that is exactly what is doing and that is exactly what it will continue to do long-term.
The main low happened in August 2023 and we have the higher lows without question, a higher high comes next.
For your convenience, I mapped this chart with the main target for this bullish wave. It can go higher.
Namaste.
