ALGOUSDTBINANCE:ALGOUSDT i think is ready for a huge move
⛔"Daily crypto market analyses I provide are personal opinions & not financial advice. Trading carries risks, so do your own research & seek advisor's help.#DYOR"
Don't forget to like and comment
Algo

Bitcoin Update | Alt Coin Update | ICP | FilecoinCHECK OUT THE LATEST Bitcoin Update | Alt Coin Update | ICP | Filecoin

ALGO/USDT Looking Good with Recent Bull Rally |👀 What's Next? 💎 Paradisers, shift your attention to ALGOUSDT, as it presents a notable trading setup in the demand zone, reinforced by a recent Market Structure Shift (MSS). This scenario suggests a substantial chance for a bullish trend.
💎 On analyzing ALGO's pattern, Algorand has a consistent record of breaking above its descending trendline, a harbinger of upward trends. It is currently targeting a key Bearish Order Block (OB) challenge, with continued momentum above the EMA100 indicating potential supply targets at $0.23 and $0.28.
💎 However, given the ever-changing nature of the crypto market, ALGO traders need to be equipped for different eventualities. Should the anticipated bullish surge not materialize, pivoting to a rebound strategy from the support level at $0.1325 will be crucial.
💎 A decline below this support level would call for a revision in strategy, highlighting the need to reassess the bullish stance and modify trading approaches to suit the evolving market context.
💎 Stay focused and tactically astute, Paradisers. Your ParadiseTeam is committed to providing you with comprehensive analysis and strategic guidance, helping you make informed decisions in these fluctuating market conditions.

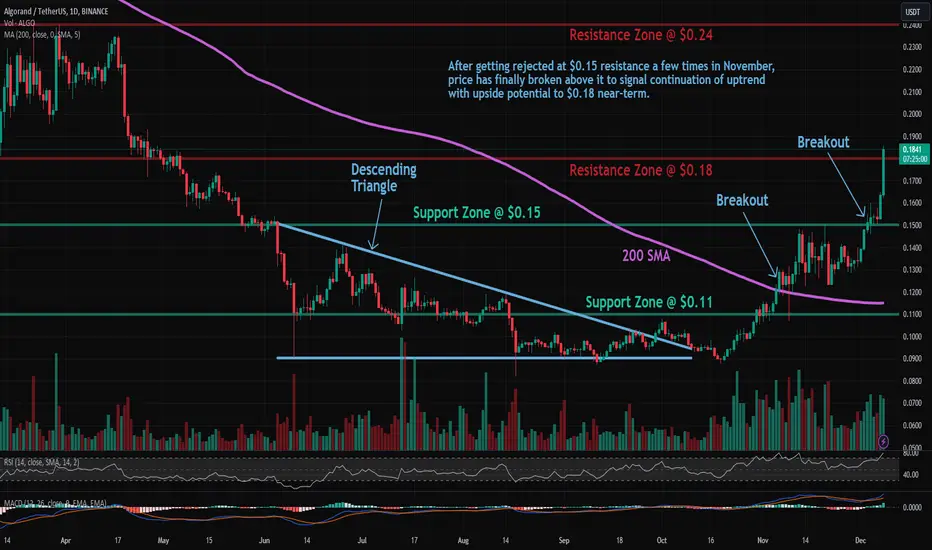
ALGO: Resistance BreakoutAlgorand (ALGO) technical analysis:
Trade setup : After getting rejected at $0.15 resistance a few times in November, price has finally broken above it to signal continuation of uptrend with upside potential to $0.18 near-term. Previously, price broke above above 200-day moving average, which confirmed a bullish trend reversal to an Uptrend.
Trend : Uptrend across all time horizons (Short- Medium- and Long-Term).
Momentum is Bullish ( MACD Line is above MACD Signal Line and RSI is above 55).
Support and Resistance : Nearest Support Zone is $0.15 (previous resistance), then $0.11. The nearest Resistance Zone is $0.18, then $0.24.
Technical analysis for: Dow Jones( US30 ) 05 Dec 2023Technical analysis for: Dow Jones( US30 ) 05 Dec 2023
Trend : Up
Expected scenario : the technical analysis prices will keep moving up on long term but the the technical analysis saying that there is a correction to support level zone ( 35200 to 34600 ) which consider it as strong and good zone for buyers with targeting the highest historical prices at 37000 $ .

Technical Analysis for (USDJPY) 5 December 2023Technical Analysis for USD/JPY - December 5, 2023
Trend: Down
Details: The market is currently bearish; the trend has shifted to a downward trajectory, and prices are gradually approaching the nearest support zone at levels 144.83 to 143.43. Once prices reach this zone, we can consider the possibility of a reversal and an upward movement again.

XAUUSD ( Spot gold ) for 5 Dec 2023 Technical analysis saying :
Trend : UP
Details : XAUUSD pair is still under high pressure selling, and the first support zone located at level ( from 2007 to 1992 ) for ounce, which might pushing the prices up again to 2040 $ .

Potential Price ReversalALGO has demonstrated a notable uptrend, successfully overcoming a resistance level that previously hindered its price growth for several days.
This bullish momentum led it to encounter another resistance zone. At present, the price growth has stalled, suggesting a potential reversal to the downside. However, a newly formed support zone has emerged, which could act as a buffer against further decline in price.
This support level, potentially a key pivot point, is positioned around $0.1357 to $0.1370. If it holds, it might catalyze a renewed upward movement in ALGO's price.
This analysis is for informational purposes only and should not be considered as financial advice.

ALGO: Resistance BreakoutAlgorand (ALGO) technical analysis:
Trade setup : After getting rejected at $0.15 resistance a few times in November, price has finally broken above it to signal continuation of uptrend with upside potential to $0.18 near-term. Previously, price broke above above 200-day moving average, which confirmed a bullish trend reversal to an Uptrend.
Trend : Uptrend across all time horizons (Short- Medium- and Long-Term).
Momentum is Bullish (MACD Line is above MACD Signal Line and RSI is above 55).
Support and Resistance : Nearest Support Zone is $0.11 (previous resistance), then $0.09. The nearest Resistance Zone is $0.15, which it broke, then $0.18.

ALGO: Pullback in UptrendAlgorand (ALGO) technical analysis:
Trade setup : Price broke above above 200-day moving average, which confirmed a bullish trend reversal to an Uptrend. So far it has been rejected at $0.15 resistance. We wait for price to either
1) break above $0.15 to signal continuation of uptrend with upside potential to $0.18 near-term, or
2) pull back near $0.12 support (200-day MA) for a swing entry in Uptrend with upside potential back to $0.14.
Trend : Uptrend across all time horizons (Short- Medium- and Long-Term).
Momentum is Mixed as MACD Line is below MACD Signal Line (Bearish) but RSI ~ 50 (Neutral).
Support and Resistance : Nearest Support Zone is $0.11 (previous resistance), then $0.09. The nearest Resistance Zone is $0.15, then $0.18.

ALGORAND Big opportunityI can see a big opportunity on Algorand. We are in a strong uptrend, there's a good bullish ascending triangle with a 18% move. If we set this 18% move as target, we can see it at 0.17. It's a good 30% from actual price, on spot... Imagine on features

ALGO Scalp LongI am scalping long on Algorand. Opportunity looks good, the short term downtrend in broken, a small pump is likely to happen

ALGO/USDT = Sideways before The Breakdown/BreakoutWe see a tight trading range, signifying indecision between buyers and sellers. If we see a solid break above the upper yellow line, there could be potential for an upward push, possibly initiating a new bullish phase for ALGO coin. However, the odds seem slim, and we may more likely witness a bounce between the resistance and support zones.
We're on the lookout for a potential breakdown, which would necessitate a confirmed re-test of the resistance turned from the support zone. Such a move would signal a clear shift in market sentiment and a potential move to our liquidity grab zone as well!

The key is whether it can rise above 0.1409-0.1718Hello traders!
If you "Follow" us, you can always get new information quickly.
Please also click “Boost”.
Have a good day.
-------------------------------------
(ALGOUSDT chart)
The key is whether the price can be maintained above 0.1093 and rise above 0.1718.
(1W chart)
In order to escape from the bottom section, the price must rise above 0.1718 and maintain the price.
However, to escape the true bottom zone, it must rise above 0.4253.
Only then is it expected to turn into an upward trend and rise.
(1D chart)
Therefore, the key is whether the price can be maintained by receiving support around 0.1214 and rising above 0.1409.
If the price maintains by rising above 0.1409, it appears likely that it will rise quickly to around 0.2462.
Otherwise, if it falls below 0.1214 and is resisted, there is a possibility that it may fall to around 0.0954, so you need to think about a response plan.
Since a volume profile section has been formed around 0.3091, it is expected that a sharp rise will occur only when it breaks upward around this area.
--------------------------------------------------
- The big picture
The full-fledged upward trend is expected to begin when the price rises above 29K.
This is the section expected to be touched in the next bull market, 81K-95K.
-------------------------------------------------- -------------------------------------------
** All explanations are for reference only and do not guarantee profit or loss in investment.
** Trading volume is displayed as a candle body based on 10EMA.
How to display (in order from darkest to darkest)
More than 3 times the trading volume of 10EMA > 2.5 times > 2.0 times > 1.25 times > Trading volume below 10EMA
** Even if you know other people’s know-how, it takes a considerable amount of time to make it your own.
** This chart was created using my know-how.
---------------------------------

ALGORAND Update, time to start buying it?I was wrong on my prevoius idea, it wass maybe too early for ALGO to fly. But the hot zone i marked as resistance and support has worked nicely. We are back to resistance and i think Algorand has enough strength to flip it to support and fly high in the mid term. 0.2 is my target before end of the year

I'll Go To The Moon (ALGOUSDT)ALGO has been trading in an ascending broadening wedge pattern since 19th October.
In that time it has risen by ~67% and is once again trading above all EMA's. The market is shaky at the moment and any drops in BTC are causing bigger drops in alts, but any increase in BTC is not necessarily increasing alts much.
In any case, despite the very recent downward pressure ALGO found support around $0.13 and is looking to push up to the top of the channel for a short-term 20% increase. In the mid-term, if a breakout of the channel occurs we can target the $0.20 range.
If there is any major downward pressure, ALGO could fall considerably to $0.10, but that seems unlikely for now.
It has been a while since ALGO has shown some strength, now that it has the explosion should be big.
Please note I am not a financial advisor and this is not financial advice. All ideas are for educational purposes only.
Please feel free to leave your comments and thoughts below!

ALGO Long UpdateUpdating my long position on ALGORAND. So far so good, that's what i want to see to continue the good uptrend. In daily TF we are in strong bull trend. Big support (big rectangle) and small resistance to breake.

Algorand ALGO longterm trading 1D candles using BB, AO, RSIThis trading strategy uses Bollinger Band, Awesome Oscillator and RSI for longterm Algorand (ALGO-USDT) trading.

ALGO Update, back on entry?Nice profits on ALGORAND. Price is in resistance zone, will ALGO pull back to entry before go up again or it will keep going up? Let's see, stop on BE is a good idea

ALGO undervaluedAlgo looks very undervalued from here. Hit Covid lowest level
Clearly formed a bottom cycle

Algorithmic vs. Manual Trading - Which Strategy Reigns SupremeIntro:
In the dynamic world of financial markets, trading strategies have evolved significantly over the years. With advancements in technology and the rise of artificial intelligence (AI), algorithmic trading, also known as algo trading, has gained immense popularity. Algo trading utilizes complex algorithms and automated systems to execute trades swiftly and efficiently, offering numerous advantages over traditional manual trading approaches.
In this article, we will explore the advantages and disadvantages of algo trading compared to manual trading, providing a comprehensive overview of both approaches. We will delve into the speed, efficiency, emotion-free decision making, consistency, scalability, accuracy, backtesting capabilities, risk management, and diversification offered by algo trading. Additionally, we will discuss the flexibility, adaptability, intuition, experience, emotional intelligence, and creative thinking that manual trading brings to the table.
Advantages of Algo trading:
Speed and Efficiency:
One of the primary advantages of algo trading is its remarkable speed and efficiency. With algorithms executing trades in milliseconds, algo trading eliminates the delays associated with manual trading. This speed advantage enables traders to capitalize on fleeting market opportunities and capture price discrepancies that would otherwise be missed. By swiftly responding to market changes, algo trading ensures that traders can enter and exit positions at optimal prices.
Emotion-Free Decision Making: Humans are prone to emotional biases, which can cloud judgment and lead to irrational investment decisions. Algo trading removes these emotional biases by relying on pre-programmed rules and algorithms. The algorithms make decisions based on logical parameters, objective analysis, and historical data, eliminating the influence of fear, greed, or other human emotions. As a result, algo trading enables more disciplined and objective decision-making, ultimately leading to better trading outcomes.
Consistency: Consistency is a crucial factor in trading success. Algo trading provides the advantage of maintaining a consistent trading approach over time. The algorithms follow a set of predefined rules consistently, ensuring that trades are executed in a standardized manner. This consistency helps traders avoid impulsive decisions or deviations from the original trading strategy, leading to a more disciplined approach to investing.
Enhanced Scalability: Traditional manual trading has limitations when it comes to scalability. As trade volumes increase, it becomes challenging for traders to execute orders efficiently. Algo trading overcomes this hurdle by automating the entire process. Algorithms can handle a high volume of trades across multiple markets simultaneously, ensuring scalability without compromising on execution speed or accuracy. This scalability empowers traders to take advantage of diverse market opportunities without any operational constraints.
Increased Accuracy: Algo trading leverages the power of technology to enhance trading accuracy. The algorithms can analyze vast amounts of market data, identify patterns, and execute trades based on precise parameters. By eliminating human error and subjectivity, algo trading increases the accuracy of trade execution. This improved accuracy can lead to better trade outcomes, maximizing profits and minimizing losses.
Backtesting Capabilities and Optimization: Another significant advantage of algo trading is its ability to backtest trading strategies. Algorithms can analyze historical market data to simulate trading scenarios and evaluate the performance of different strategies. This backtesting process helps traders optimize their strategies by identifying patterns or variables that generate the best results. By fine-tuning strategies before implementing them in live markets, algo traders can increase their chances of success.
Automated Risk Management: Automated Risk Management: Managing risk is a critical aspect of trading. Algo trading offers automated risk management capabilities that can be built into the algorithms. Traders can program specific risk parameters, such as stop-loss orders or position sizing rules, to ensure that losses are limited and positions are appropriately managed. By automating risk management, algo trading reduces the reliance on manual monitoring and helps protect against potential market downturns.
Diversification: Diversification: Algo trading enables traders to diversify their portfolios effectively. With algorithms capable of simultaneously executing trades across multiple markets, asset classes, or strategies, traders can spread their investments and reduce overall risk. Diversification helps mitigate the impact of individual market fluctuations and can potentially enhance long-term returns.
Removal of Emotional Biases: Finally, algo trading eliminates the influence of emotional biases that often hinder trading decisions. Fear, greed, and other emotions can cloud judgment and lead to poor investment choices. Byrelying on algorithms, algo trading removes these emotional biases from the decision-making process. This objective approach helps traders make more rational and data-driven decisions, leading to better overall trading performance.
Disadvantage of Algo Trading
System Vulnerabilities and Risks: One of the primary concerns with algo trading is system vulnerabilities and risks. Since algo trading relies heavily on technology and computer systems, any technical malfunction or system failure can have severe consequences. Power outages, network disruptions, or software glitches can disrupt trading operations and potentially lead to financial losses. It is crucial for traders to have robust risk management measures in place to mitigate these risks effectively.
Technical Challenges and Complexity: Technical Challenges and Complexity: Algo trading involves complex technological infrastructure and sophisticated algorithms. Implementing and maintaining such systems require a high level of technical expertise and resources. Traders must have a thorough understanding of programming languages and algorithms to develop and modify trading strategies. Additionally, monitoring and maintaining the infrastructure can be challenging and time-consuming, requiring continuous updates and adjustments to keep up with evolving market conditions.
Over-Optimization: Another disadvantage of algo trading is the risk of over-optimization. Traders may be tempted to fine-tune their algorithms excessively based on historical data to achieve exceptional past performance. However, over-optimization can lead to a phenomenon called "curve fitting," where the algorithms become too specific to historical data and fail to perform well in real-time market conditions. It is essential to strike a balance between optimizing strategies and ensuring adaptability to changing market dynamic
Over Reliance on Historical Data: Algo trading heavily relies on historical data to generate trading signals and make decisions. While historical data can provide valuable insights, it may not always accurately reflect future market conditions. Market dynamics, trends, and relationships can change over time, rendering historical data less relevant. Traders must be cautious about not relying solely on past performance and continuously monitor and adapt their strategies to current market conditions.
Lack of Adaptability: Another drawback of algo trading is its potential lack of adaptability to unexpected market events or sudden changes in market conditions. Algo trading strategies are typically based on predefined rules and algorithms, which may not account for unforeseen events or extreme market volatility. Traders must be vigilant and ready to intervene or modify their strategies manually when market conditions deviate significantly from the programmed rules.
Advantages of Manual Trading
Flexibility and Adaptability: Manual trading offers the advantage of flexibility and adaptability. Traders can quickly adjust their strategies and react to changing market conditions in real-time. Unlike algorithms, human traders can adapt their decision-making process based on new information, unexpected events, or emerging market trends. This flexibility allows for agile decision-making and the ability to capitalize on evolving market opportunities.
Intuition and Experience: Human traders possess intuition and experience, which can be valuable assets in the trading process. Through years of experience, traders develop a deep understanding of the market dynamics, patterns, and interrelationships between assets. Intuition allows them to make informed judgments based on their accumulated knowledge and instincts. This human element adds a qualitative aspect to trading decisions that algorithms may lack.
Complex Decision-making: Manual trading involves complex decision-making that goes beyond predefined rules. Traders analyze various factors, such as fundamental and technical indicators, economic news, and geopolitical events, to make well-informed decisions. This ability to consider multiple variables and weigh their impact on the market enables traders to make nuanced decisions that algorithms may overlook.
Emotional Intelligence and Market Sentiment: Humans possess emotional intelligence, which can be advantageous in trading. Emotions can provide valuable insights into market sentiment and investor psychology. Human traders can gauge market sentiment by interpreting price movements, news sentiment, and market chatter. Understanding and incorporating market sentiment into decision-making can help traders identify potential market shifts and take advantage of sentiment-driven opportunities.
Contextual Understanding: Manual trading allows traders to have a deep contextual understanding of the markets they operate in. They can analyze broader economic factors, political developments, and industry-specific dynamics to assess the market environment accurately. This contextual understanding provides traders with a comprehensive view of the factors that can influence market movements, allowing for more informed decision-making.
Creative and Opportunistic Thinking: Human traders bring creative and opportunistic thinking to the trading process. They can spot unique opportunities that algorithms may not consider. By employing analytical skills, critical thinking, and out-of-the-box approaches, traders can identify unconventional trading strategies or undervalued assets that algorithms may overlook. This creative thinking allows traders to capitalize on market inefficiencies and generate returns.
Complex Market Conditions: Manual trading thrives in complex market conditions that algorithms may struggle to navigate. In situations where market dynamics are rapidly changing, volatile, or influenced by unpredictable events, human traders can adapt quickly and make decisions based on their judgment and expertise. The ability to think on their feet and adjust strategies accordingly enables traders to navigate challenging market conditions effectively.
Disadvantage of Manual Trading
Emotional Bias: Algo trading lacks human emotions, which can sometimes be a disadvantage. Human traders can analyze market conditions based on intuition and experience, while algorithms solely rely on historical data and predefined rules. Emotional biases, such as fear or greed, may play a role in decision-making, but algorithms cannot factor in these nuanced human aspects.
Time and Effort: Implementing and maintaining algo trading systems require time and effort. Developing effective algorithms and strategies demands significant technical expertise and resources. Traders need to continuously monitor and update their algorithms to ensure they remain relevant in changing market conditions. This ongoing commitment can be time-consuming and may require additional personnel or technical support.
Execution Speed: While algo trading is known for its speed, there can be challenges with execution. In fast-moving markets, delays in order execution can lead to missed opportunities or less favorable trade outcomes. Algo trading systems need to be equipped with high-performance infrastructure and reliable connectivity to execute trades swiftly and efficiently.
Information Overload: In today's digital age, vast amounts of data are available to traders. Algo trading systems can quickly process large volumes of information, but there is a risk of information overload. Filtering through excessive data and identifying relevant signals can be challenging. Traders must carefully design algorithms to focus on essential information and avoid being overwhelmed by irrelevant or noisy data.
The Power of AI in Enhancing Algorithmic Trading:
Data Analysis and Pattern Recognition: AI algorithms excel at processing vast amounts of data and recognizing patterns that may be difficult for human traders to identify. By analyzing historical market data, news, social media sentiment, and other relevant information, AI-powered algorithms can uncover hidden correlations and trends. This enables traders to develop more robust trading strategies based on data-driven insights.
Predictive Analytics and Forecasting: AI algorithms can leverage machine learning techniques to generate predictive models and forecasts. By training on historical market data, these algorithms can identify patterns and relationships that can help predict future price movements. This predictive capability empowers traders to anticipate market trends, identify potential opportunities, and adjust their strategies accordingly.
Real-time Market Monitoring: AI-based systems can continuously monitor real-time market data, news feeds, and social media platforms. This enables traders to stay updated on market developments, breaking news, and sentiment shifts. By incorporating real-time data into their algorithms, traders can make faster and more accurate trading decisions, especially in volatile and rapidly changing market conditions.
Adaptive and Self-Learning Systems: AI algorithms have the ability to adapt and self-learn from market data and trading outcomes. Through reinforcement learning techniques, these algorithms can continuously optimize trading strategies based on real-time performance feedback. This adaptability allows the algorithms to evolve and improve over time, enhancing their ability to generate consistent returns and adapt to changing market dynamics.
Enhanced Decision Support:
AI algorithms can provide decision support tools for traders, presenting them with data-driven insights, risk analysis, and recommended actions. By combining the power of AI with human expertise, traders can make more informed and well-rounded decisions. These decision support tools can assist in portfolio allocation, trade execution, and risk management, enhancing overall trading performance.
How Algorithmic Trading Handles News and Events?
In the fast-paced world of financial markets, news and events play a pivotal role in driving price movements and creating trading opportunities. Algorithmic trading has emerged as a powerful tool to capitalize on these dynamics.
Automated News Monitoring:
Algorithmic trading systems are equipped with the capability to automatically monitor news sources, including financial news websites, press releases, and social media platforms. By utilizing natural language processing (NLP) and sentiment analysis techniques, algorithms can filter through vast amounts of news data, identifying relevant information that may impact the market.
Real-time Data Processing:
Algorithms excel in processing real-time data and swiftly analyzing its potential impact on the market. By integrating news feeds and other event-based data into their models, algorithms can quickly evaluate the relevance and potential market significance of specific news or events. This enables traders to react promptly to emerging opportunities or risks.
Event-driven Trading Strategies:
Algorithmic trading systems can be programmed to execute event-driven trading strategies. These strategies are designed to capitalize on the market movements triggered by specific events, such as economic releases, corporate earnings announcements, or geopolitical developments. Algorithms can automatically scan for relevant events and execute trades based on predefined criteria, such as price thresholds or sentiment analysis outcomes.
Sentiment Analysis:
Sentiment analysis is a crucial component of news and event-based trading. Algorithms can analyze news articles, social media sentiment, and other textual data to assess market sentiment surrounding a specific event or news item. By gauging positive or negative sentiment, algorithms can make informed trading decisions and adjust strategies accordingly.
Backtesting and Optimization:
Algorithmic trading allows for backtesting and optimization of news and event-driven trading strategies. Historical data can be used to test the performance of trading models under various news scenarios. By analyzing the past market reactions to similar events, algorithms can be fine-tuned to improve their accuracy and profitability.
Algorithmic News Trading:
Algorithmic news trading involves the automatic execution of trades based on predefined news triggers. For example, algorithms can be programmed to automatically buy or sell certain assets when specific news is released or when certain conditions are met. This automated approach eliminates the need for manual monitoring and ensures swift execution in response to news events.
Risk Management:
Algorithmic trading systems incorporate risk management measures to mitigate the potential downside of news and event-driven trading. Stop-loss orders, position sizing algorithms, and risk management rules can be integrated to protect against adverse market movements or unexpected news outcomes. This helps to minimize losses and ensure controlled risk exposure.
Flash Crash 2010: A Historic Market Event
On May 6, 2010, the financial markets experienced an unprecedented event known as the "Flash Crash." Within a matter of minutes, stock prices plummeted dramatically, only to recover shortly thereafter. This sudden and extreme market turbulence sent shockwaves through the financial world and highlighted the vulnerabilities of an increasingly interconnected and technology-driven trading landscape.
The Flash Crash Unfolds:
On that fateful day, between 2:32 p.m. and 2:45 p.m. EDT, the U.S. stock market experienced an abrupt and severe decline in prices. Within minutes, the Dow Jones Industrial Average (DJIA) plunged nearly 1,000 points, erasing approximately $1 trillion in market value. Blue-chip stocks, such as Procter & Gamble and Accenture, saw their prices briefly crash to a mere fraction of their pre-crash values. This sudden and dramatic collapse was followed by a swift rebound, with prices largely recovering by the end of the trading session.
The Contributing Factors:
Several factors converged to create the perfect storm for the Flash Crash. One key element was the increasing prevalence of high-frequency trading (HFT), where computer algorithms execute trades at lightning-fast speeds. This automated trading, combined with the interconnectedness of markets, exacerbated the speed and intensity of the crash. Additionally, the widespread use of stop-loss orders, which are triggered when a stock reaches a specified price, amplified the selling pressure as prices rapidly declined. A lack of adequate market safeguards and regulatory mechanisms further exacerbated the situation.
Role of Algorithmic Trading:
Algorithmic trading played a significant role in the Flash Crash. As the markets rapidly declined, certain algorithmic trading strategies failed to function as intended, exacerbating the sell-off. These algorithms, designed to capture small price discrepancies, ended up engaging in a "feedback loop" of selling, pushing prices even lower. The speed and automation of algorithmic trading made it difficult for human intervention to effectively mitigate the situation in real-time.
Market Reforms and Lessons Learned:
The Flash Crash of 2010 prompted significant regulatory and technological reforms aimed at preventing similar events in the future. Measures included the implementation of circuit breakers, which temporarily halt trading during extreme price movements, and revisions to market-wide circuit breaker rules. Market surveillance and coordination between exchanges and regulators were also enhanced to better monitor and respond to unusual trading activity. Additionally, the incident highlighted the need for greater transparency and scrutiny of algorithmic trading practices.
Implications for Market Stability:
The Flash Crash served as a wake-up call to market participants and regulators, underscoring the potential risks associated with high-frequency and algorithmic trading. It highlighted the importance of ensuring that market infrastructure and regulations keep pace with technological advancements. The incident also emphasized the need for market participants to understand the intricacies of the trading systems they employ, and for regulators to continually evaluate and adapt regulatory frameworks to address emerging risks.
The Flash Crash of 2010 stands as a pivotal moment in financial market history, exposing vulnerabilities in the increasingly complex and interconnected world of electronic trading. The event triggered significant reforms and led to a greater focus on market stability, transparency, and risk management. While strides have been made to enhance market safeguards and regulatory oversight, ongoing vigilance and continuous adaptation to technological advancements are necessary to maintain the integrity and stability of modern financial markets.
How Algorithmic Trading Thrives in Changing Markets?
Algorithmic trading (ALGO) can tackle changing market conditions through various techniques and strategies that allow algorithms to adapt and respond effectively. Here are some ways ALGO can address changing market conditions:
Real-Time Data Analysis: Algo systems continuously monitor market data, including price movements, volume, news feeds, and economic indicators, in real-time. By analyzing this data promptly, algorithms can identify changing market conditions and adjust trading strategies accordingly. This enables Algo to capture opportunities and react to market shifts more rapidly than human traders.
Dynamic Order Routing: Algo systems can dynamically route orders to different exchanges or liquidity pools based on prevailing market conditions. By assessing factors such as liquidity, order book depth, and execution costs, algorithms can adapt their order routing strategies to optimize trade execution. This flexibility ensures that algo takes advantage of the most favorable market conditions available at any given moment.
Adaptive Trading Strategies: Algo can utilize adaptive trading strategies that are designed to adjust their parameters or rules based on changing market conditions. These strategies often incorporate machine learning algorithms to continuously learn from historical data and adapt to evolving market dynamics. By dynamically modifying their rules and parameters, algo systems can optimize trading decisions and capture opportunities across different market environments.
Volatility Management: Changing market conditions often come with increased volatility. Algo systems can incorporate volatility management techniques to adjust risk exposure accordingly. For example, algorithms may dynamically adjust position sizes, set tighter stop-loss levels, or modify risk management parameters based on current market volatility. These measures help to control risk and protect capital during periods of heightened uncertainty.
Pattern Recognition and Statistical Analysis: Algo systems can employ advanced pattern recognition and statistical analysis techniques to identify recurring market patterns or anomalies. By recognizing these patterns, algorithms can make informed trading decisions and adjust strategies accordingly. This ability to identify and adapt to patterns helps algocapitalize on recurring market conditions while also remaining adaptable to changes in market behavior.
Backtesting and Simulation: Algo systems can be extensively backtested and simulated using historical market data. By subjecting algorithms to various market scenarios and historical data sets, traders can evaluate their performance and robustness under different market conditions. This process allows for fine-tuning and optimization of algo strategies to better handle changing market dynamics.
In summary, algo tackles changing market conditions through real-time data analysis, dynamic order routing, adaptive trading strategies, volatility management, pattern recognition, statistical analysis, and rigorous backtesting. By leveraging these capabilities, algo can effectively adapt to evolving market conditions and capitalize on opportunities while managing risks more efficiently than traditional trading approaches
The Rise of Algo Traders: Is Technical Analysis Losing Ground?
Although algorithmic trading (algo trading) can automate and optimize certain elements
of technical analysis, it is improbable that it will fully substitute it. Technical analysis is a financial discipline that encompasses the examination of historical price and volume data, chart patterns, indicators, and other market variables to inform trading strategies. There are several reasons why algo traders cannot entirely supplant technical analysis:
Interpretation of Market Psychology: Technical analysis incorporates the understanding of market psychology, which is based on the belief that historical price patterns repeat themselves due to human behavior. It involves analyzing investor sentiment, trends, support and resistance levels, and other factors that can influence market movements. Algo traders may use technical indicators to identify these patterns, but they may not fully capture the nuances of market sentiment and psychological factors.
Subjectivity in Analysis: Technical analysis often involves subjective interpretation by traders, as different individuals may analyze the same chart or indicator differently. Algo traders rely on predefined rules and algorithms that may not encompass all the subjective elements of technical analysis. Human traders can incorporate their experience, intuition, and judgment to make nuanced decisions that may not be easily captured by algorithms.
Market Adaptability: Technical analysis requires the ability to adapt to changing market conditions and adjust strategies accordingly. While algorithms can be programmed to adjust certain parameters based on market data, they may not possess the same adaptability as human traders who can dynamically interpret and respond to evolving market conditions in real-time.
Unpredictable Events: Technical analysis is often challenged by unexpected events, such as geopolitical developments, economic announcements, or corporate news, which can cause significant market disruptions. Human traders may have the ability to interpret and react to these events based on their knowledge and understanding, while algo traders may struggle to respond effectively to unforeseen circumstances.
Fundamental Analysis: Technical analysis primarily focuses on price and volume data, while fundamental analysis considers broader factors such as company financials, macroeconomic indicators, industry trends, and news events. Algo traders may not have the capacity to analyze fundamental factors and incorporate them into their decision-making process, which can limit their ability to fully replace technical analysis.
In conclusion, while algo trading can automate certain elements of technical analysis, it is unlikely to replace it entirely. Technical analysis incorporates subjective interpretation, market psychology, adaptability, and fundamental factors that may be challenging for algorithms to fully replicate. Human traders with expertise in technical analysis and the ability to interpret market dynamics will continue to play a significant role in making informed trading decisions.
The Ultimate Winner - Algo Trading or Manual Trading?
Determining whether algo trading or manual trading is best depends on various factors, including individual preferences, trading goals, and skill sets. Both approaches have their advantages and limitations, and what works best for one person may not be the same for another. Let's compare the two:
Speed and Efficiency: Algo trading excels in speed and efficiency, as computer algorithms can analyze data and execute trades within milliseconds. Manual trading involves human decision-making, which may be subject to cognitive biases and emotional factors, potentially leading to slower execution or missed opportunities.
Emotion and Discipline: Algo trading eliminates emotional biases from trading decisions, as algorithms follow predefined rules without being influenced by fear or greed. Manual trading requires discipline and emotional control to make objective decisions, which can be challenging for some traders.
Adaptability: Algo trading can quickly adapt to changing market conditions and execute trades based on pre-programmed rules. Manual traders can adapt their strategies as well, but it may require more time and effort to monitor and adjust to rapidly evolving market dynamics.
Complexity and Technical Knowledge: Algo trading requires programming skills or the use of algorithmic platforms, which can be challenging for traders without a technical background. Manual trading, on the other hand, relies on an understanding of fundamental and technical analysis, which requires continuous learning and analysis of market trends.
Strategy Development: Algo trading allows for systematic and precise strategy development based on historical data analysis and backtesting. Manual traders can develop their strategies as well, but it may involve more subjective interpretations of charts, patterns, and indicators.
Risk Management: Both algo trading and manual trading require effective risk management. Algo trading can incorporate predetermined risk management parameters into algorithms, whereas manual traders need to actively monitor and manage risk based on their judgment.
Ultimately, the best approach depends on individual circumstances. Some traders may prefer algo trading for its speed, efficiency, and objective decision-making, while others may enjoy the flexibility and adaptability of manual trading. It is worth noting that many traders use a combination of both approaches, utilizing algo trading for certain strategies and manual trading for others.
In conclusion, algorithmic trading offers benefits such as speed, efficiency, and risk management, while manual trading provides adaptability and human intuition. AI enhances algorithmic trading by processing data, recognizing patterns, and providing decision support. Algos excel in automated news monitoring and event-driven strategies. However, the Flash Crash of 2010 exposed vulnerabilities in the interconnected trading landscape, with algorithmic trading exacerbating the market decline. It serves as a reminder to implement appropriate safeguards and risk management measures. Overall, a balanced approach that combines the strengths of both algorithmic and manual trading can lead to more effective and resilient trading strategies.

$ALGO in uptrendPatience is going to take your sleep away as you see it slowly moving up. It's already invalidated the downtrend, so even if it goes down a bit, that won't be a concern. Just try not to take a leverage position (not even 2x) as this doesn't have much volume and you will have to suffer in liquidation where the operator can easily play 10-20% up/down with low volume. You can take a Spot entry and leave it as a safe money for later.
When I emphasized on patience , I meant that you will see this coin go up or down like 5-30% in a week and that will make a pressure on you to exit with profit. Only those who remain for few months, will be the real hero!
Till then Al-goat your ALGO fam! I will be back soon.

ALGO/USDT A Bullish Horizon Beckons? 👀 🚀 Algo Today analysis💎Paradisers, ALGOUSDT is currently on the radar with its intriguing behavior, having faced rejection at a resistance level but showing signs that it might surge past it in a bullish manner soon.
💎 Historical patterns have shown that when supply zones transform into demand zones, ALGOUSDT tends to ascend. Although it faced a setback at the resistance level of .11563, the momentum seems to be regaining, hinting at a heightened likelihood of breaching the resistance.
💎 Notably, the price has maintained a stance above the previous low, which supports the bullish outlook. Another scenario to consider is a potential bullish push from the demand zone at .10594. However, a drop below this zone could signal a bearish turn.
💎 While some traders, particularly newcomers, may be initiating long positions, it's crucial to maintain a strategic edge and remain alert to all market movements.
