Back in ALGOGot back in ALGO this AM. Same as XTZ.
Unless BTC dumps, ALGO is still in the up trend. I like all Mls and price respecting support and resistance noted on the chart.
Yolo
ALGOBTC

ALGO AnalysisRight now algo at the bottom and have potential for testing resistance
keep your eyes on it and get ready for long

ALGOHi 🙋🏼♀️
This is my idea about ALGO.
Targets and stoploss are mentioned in the chart.
Thanks for taking the time 🥰

ALGO/BTC bullish breakoutALGO finally broke out of the descending trendline, we are looking for a potential x2 midterm. Patience is a virtue. A retest of the trend might be expected. This will remain positive as long as we don't have any dump on BTC side.
Please do your own research and analysis, this is not a financial advice.


ALGOUSDT_Daily***********************************
Price :1.89 USDT
Resistance: 1.9- 1.95
TP_LVL I: 2.06- 2.15 USDT
TP_LVL II: 2.36- 2.5 USDT
TP_LVL II: 3- 3.1 USDT
SL: 1.5 USDT
***********************************

Sometimes you get poop on your dickAlgo will be alright, just adding comedy since my projection was wrong. This might be the dip to buy, it hit my buy dip target of 1.60 earlier today. It could bleed more so i am watching it throughout today and the beginning of the week here. Everything is red today, so just be patient and DCA when you think its time.

ALGO is a buyI am buying the dip since this morning with only 30% with idea of adding more once bottoming is confirmed.
All eyes on SPY, nothing else matter. If SPY dip is bought, everything else will be bought.
Right now, SPY broke an important trend line so very cautious going forward but also letting my FOMO make some of the decisions.
I do like ALGO here though as long as i get my bottoming confirmation.

Algo is Bullish to the bonesALGO IS SO BULLISH, it's forming not one falling wedge but two wedges (technically bullish patterns) 😀...No matter how you look at it it's bullish, with expectations to reach $2.80 min or $3.00 after the breakouts upwards.
Algorand has been on an uptrend lately and topped charts as the best performer coin multiple times. With the price climbing to heights not seen since early April, showing significant volatility over the last week. As a project algorand is very good and of course you can hold for long term. (better days are coming for sure)!
Good luck 🤞

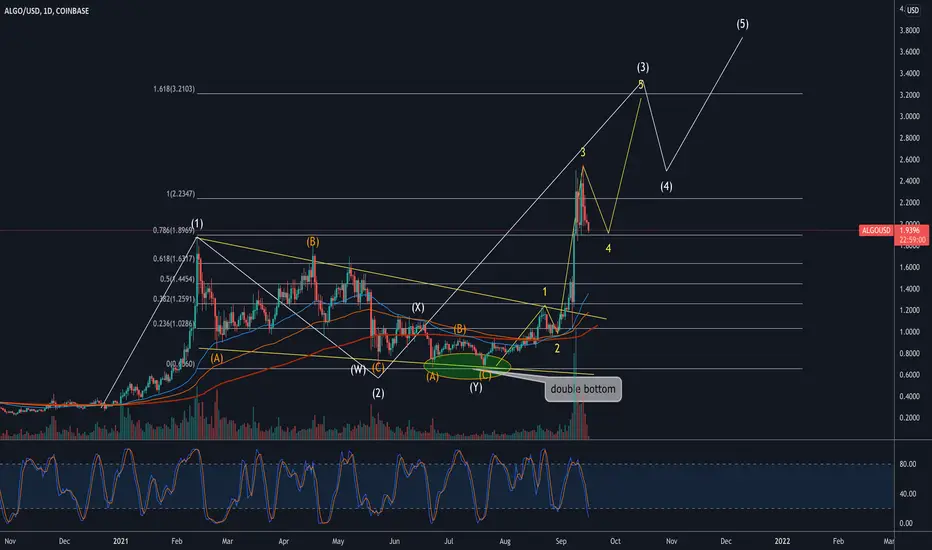
ALGO , 5th elliott wave about to end , 65% gain ahead.so guys as you see , it's the end of the 5th wave for ALGO , our target is between 3.35 - 3.55.
after that we are gonna have a correction which Imma keep y'all updated .
don't forget the 3 important things , like , comment , follow.
see y'all in the next idea.

So its back in, its back onLets go. Update to earlier algo analysis. Dropped down to support and made a recovery back to the wedge and above support trend line, shit it lookin good

ALGOUSDT Technical Analysis
⏳ Spot
💎 ALGOUSDT has been moving in the ranging channel. It has also formed a descending triangle. I expect that the price soon will break above the triangle and continues to go higher.
🏁 Short Term
💵 Invest Only 5% of your Portfolio
🎳 Entry at market or 2.0000
☕️ TP1 2.4000
🍺 TP2 3.4000
🍻 TP3 ______
🍾 TP4 ______
🍷 TP5 ______
🍸 TP6 ______
🍹 TP7 ______
🎁 TP8 ______
🚫 SL 1.8000
Good Luck 🎲
Check the Links in Description and If you LIKE this analysis, Please support our page and Ideas by hitting the LIKE 👍 button. ❤️ Your Support is really appreciated! ❤️
Traders, if you have your own opinion about it, please write your own in the comment box. We will be glad for this.
Feel free to request any pair/instrument analysis or ask any questions in the comment section below.
We will have more FREE forecasts in TradingView soon
Have a Profitable Day

ALGO - Potential Rising Three Methods Candlestick PatternWhat is the Rising Three Methods Pattern?
"Rising three methods" is a bullish continuation candlestick pattern that occurs in an uptrend and whose conclusion sees a resumption of that trend.
Read more: www.investopedia.com
As Bitcoin recovers from the previous consolidation rage, I'm convinced that the Rising Three Methods could play out.

Possible Breakout upwardAlgo is very bullish now with possible breakout to $2.20. Algo is forming a huge rising wedge witch could take it to $2.80-$3.00

ALGOI have ALGO breaking up in a minor W5 as a sub wave of the Intermediate W3 heading towards $3.21. We just took a long leverage trade in my group. GL guys. Big Mike loves all of you.
ALGO HAS A SETTING FOR BIG PRICE UPHi all
ALGO
A big base is broken and volume breackout is big, so we are looking for the target
of $3.5, I think it is not difficult to get there.
Happy trading.

Algo turning point8 percent pump from here is possibl e.. target 2.222usdt
it depends if it leaves a wick from here and turns green coming in 4 hour candle that only way of 5 minutes.
support at 1.95usdt
investment carreis high risk, play wisely.
thank you!

algo long + tips to reduce lossall the major details in chart . it can be bull or bear pattern but if it break then it will pumb
follow me , like : )

ALGOBTC Update (rejected from upper bound)ALGOBTC is rejected from the upper bound of the channel. In my opinion it will retry to break it.
See also:

AGLOUSDT - Update (retesting the broken level)It seems that ALGOUSDT is retesting its broken level and I expect it to continue its bullish move.
See also:

Algorand (ALGO) - September 10Hello?
Welcome, traders.
By "following", you can always get new information quickly.
Please also click "Like".
Have a nice day.
-------------------------------------
(ALGOUSD 1W Chart)
If the price holds above the 0.50221395-0.76754798 range, we expect the uptrend to continue.
(1D chart)
Support is found at 1.90329264 and is breaking above the 2.11836146-2.25112275 section.
In the 2.25112275-2.51664536 section, you need to maintain your momentum to see if you can continue with further climbs.
If they do, they should check to see if they find support at the 2.11836146-2.25112275 area.
If it falls in the 1.72007755-1.90329264 section, a short-term stop loss is required.
The next volatility period is around September 28th.
-------------------------------------
(ALGOBTC 1W chart)
It is rising in the 1075 Satoshi-4309 Satoshi section, which is a sideways section.
If it rises above the 6469 Satoshi point and maintains the price, it is expected to create a new wave.
(1D chart)
It remains to be seen if the 4309 satoshi-5422 satoshi section can find support and rise above the 6469 satoshi point.
------------------------------------------
We recommend that you trade with your average unit price.
This is because, if the price is below your average unit price, whether it is in an uptrend or in a downtrend, there is a high possibility that you will not be able to get a big profit due to the psychological burden.
The center of all trading starts with the average unit price at which you start trading.
If you ignore this, you may be trading in the wrong direction.
Therefore, it is important to find a way to lower the average unit price and adjust the proportion of the investment, ultimately allowing the funds corresponding to the profits to regenerate themselves.
------------------------------------------------------------ -----------------------------------------------------
** All indicators are lagging indicators.
Therefore, it is important to be aware that the indicator moves accordingly with the movement of price and volume.
However, for the sake of convenience, we are talking in reverse for the interpretation of the indicator.
** The wRSI_SR indicator is an indicator created by adding settings and options to the existing Stochastic RSI indicator.
Therefore, the interpretation is the same as the traditional Stochastic RSI indicator. (K, D line -> R, S line)
** The OBV indicator was re-created by applying a formula to the DepthHouse Trading indicator, an indicator disclosed by oh92. (Thanks for this.)
** See support, resistance, and abbreviation points.
** Support or resistance is based on the closing price of the 1D chart.
** All descriptions are for reference only and do not guarantee a profit or loss in investment.
Explanation of abbreviations displayed in the chart
R: A point or section of resistance that requires a response to preserve profits.
S-L: Stop Loss point or section
S: A point or section where you can buy to make a profit as a support point or section.
(Short-term Stop Loss can be said to be a point where profit and loss can be preserved or additional entry can be made through split trading. It is a short-term investment perspective.)
GAP refers to the difference in prices that occurred when the stock market, CME, and BAKKT exchanges were closed because they are not traded 24 hours a day.
G1 : Closing price when closed
G2: Opening price
(Example) Gap (G1-G2)

ALGO is ready for next swing upalgo is looking good for a swing trade,
you can enter after the breakout of previous ATH is confirmed. Best entry would the retest of ATH as a support
Cheers 🥂

