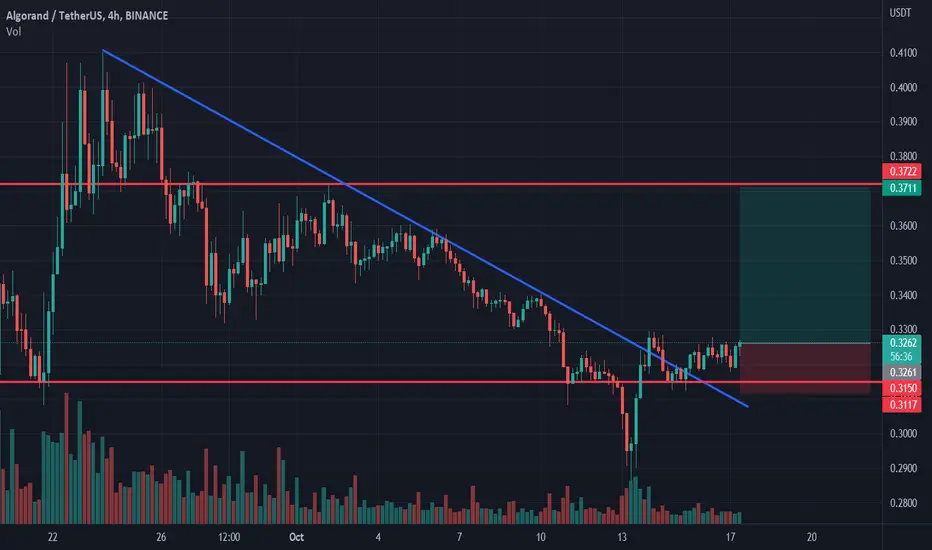
Algorand longAlgorand bounced off the support level. Asset broke trough off the descending trendline. Bullish movement to resistance level at 0.371 is possible.
Algorand
ALGOPrice made a swing low on the Weekly Time Frame. Price came all the way back to the origin of that impulse move and is finding support. This might be a nice buy in the upcoming World Cup Football as they are partnered up with FIFA.

Algorand (ALGO) formed bullish Gartley for upto 34.50% rallyHi dear friends, hope you are well and welcome to the new trade setup of Algorand (ALGO) with US Dollar pair.
Previously we had a nice trade of ALGO:
Now on a daily time frame, ALGO has formed a bullish Gartley pattern.
Note: Above idea is for educational purpose only. It is advised to diversify and strictly follow the stop loss, and don't get stuck with trade

$ALGO | Potential Move Up To Previous ResistanceALGOUSD was at mid-September levels of being oversold and broke the lower Bollinger Band. I waited on confirmation for this potential reversal to the upside because of this. We had a green candle closing fully above the bottom band and above the most resistant near term support levels. Got in a buy highlighted by LONG POSITION graph with the mindset of taking profit slightly above the 200 EMA which hasn't been respected most recently but BELOW the nearest resistance which has. Will need a decent sized green candle to push through. Stop loss placed below BOTH the lower band and support levels.

Algorand (ALGO) - October 8Hello?
Welcome, traders.
By "following", you can always get new information quickly.
Please also click "Boost".
Have a good day.
-------------------------------------
(ALGOUSDT 1W Chart)
Whether or not it can move higher than 0.6704 is key.
To do this, it is necessary to check whether it is supported and ascends in the 0.3310-0.4253 section.
(1D chart)
We need to see if we can keep the price above 0.3310.
If it falls below the 0.2865-0.3091 range, there is a possibility that it will fall to around 0.2140.
------------------------------------------------------------ -------------------------------------------
** All descriptions are for reference only and do not guarantee a profit or loss in investment.
** If you share this chart, you can use the indicators normally.
** The MRHAB-T indicator contains indicators that indicate support and resistance points.
** SR_R_C indicators are displayed as StochRSI(line), RSI(columns), CCI(bgcolor).
** CCI indicator is expressed as overbought range (CCI > +100) and oversold range (CCI < -100).
(Short-term Stop Loss can be said to be a point where profit and loss can be preserved or additional entry can be made through split trading. It is a short-term investment perspective.)
---------------------------------

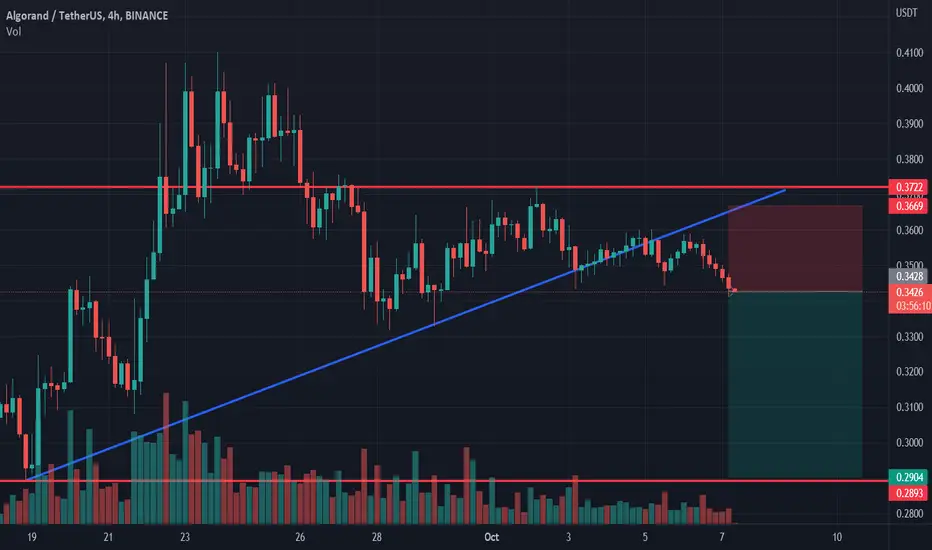
Algorand shortAlgorand bounced off the resistance level. Asset broke trough the ascending trendline. Bearish movement to support level at 0.29 is possible.
$Algo golden cross formation is about to begin don't miss!$$$Algo golden cross formation is about to begin. I recommend you all to watch this coin, which has a potential of 600 percent and more, the first stop is 0.4 cents. don't miss it. Good trades, not investment advice.

ALGORAND `` RR/9xCorrelation, and it's technical analysis.
I look forward to Algorand doing a deep SHORT.
Partials will of course be taken along.
Careful.

Algorand longAlgorand bounced off the lower boundary of ascending channel. Bullish movement to resistance level at 0.372 is possible.


Algorand Last Resistance at 40 centsAlgorand huge upside considering we keep up the same rate of growth from before. We should see $1.50 easy then $4 and beyond.
They're just handing out free shares so we can have a good flow of shares for when it goes up.
Market pushes up more when shorters take profit that's why it dips first then shoots up and also goes to resistance at the last second and then dips...
What's the difference between breaking out at 25 cents or 35 cents if both times is moon.
Ethereum only went up $100, what is this weakness.

Another potential $ALGO short play...BINANCE:ALGOUSDTPERP - Has bounced at support -
moving up towards heavy resistance (blue zone) which given rapidly declining OI and Binance crowd aping into linear "line-break" from recent high -
Not a continuation traded - aim for reversion
SL would be at prior high or narrative switch.
Otherwise. Goblin time.

Too Good To Be True? Staking Rewards and the RecessionAs some analysts have predicted, the public's interest in crypto/Web3 projects have shifted from proof-of-work over to proof-of-stake, following Ethereum's "merge" a few weeks ago. ATOM and ALGO in particular did very well this week (though it did level off eventually) as what seems to be a partial migration of crypto money flowing from one area to the next.
The pattern is just starting now so time will tell if it's a trend or a blip, but as we head further into a global recession, the idea of people "abandoning" stocks and other traditional fiat assets becomes more a possibility over time. We can look at some of the predictions being made right now in the industry, and its pros and cons.
1. Crypto Will Go Down With Fiat
Given that crypto and the stock market have traditionally moved in parallel for the most part, it will continue to do the same during the downturn. This assumes that the low-interest rates of 2008+ onwards was also fueling the crypto hype and will follow the same pattern of prices plunging as cheap borrowing falls to the wayside. While there's certainly a case there, this assumes that the economy will behave "as normal" during the next downturn - which may bring a different type of risk to the table.
2. Money Will Flow into Bitcoin/Ethereum
This is the main mantra of the "maxis" out there - they assume that people will lose faith in fiat as a whole, and convert their stocks/cash into a "reliable deflationary asset" like Bitcoin or (now) Ethereum. Deflationary assets - while some will call "ponzi-like" in its modeling - do objectively favor existing holders over newer ones, and can often cause problems with onboarding and long-term growth since it makes it more difficult for new money to come in. Given the two projects massive media/marketing presence last year, are there any more people out there to onboard? Probably not - but they are holding out for the idea that they will be proven right, one day.
3. Money Will Flow into "Cash-Like" Assets Like Dogecoin
Traditional financial wisdom says that during recessions, "cash is king" - and we have seen some indication that money is starting to flow back into cash, especially the USD. (The USD is traditionally seen as the most "stable" and is typically where fiat assets flow into during recessions.) What does this mean for crypto? Well, up until now the narrative has been that out of the well-known coins out there, Dogecoin is the most "cash-like" since it's been actually used to buy and sell things at low costs. While the idea is interesting, DOGE has a few problems associated with it - that it still runs on proof-of-work (which is losing favor over time) and that being a fork of Bitcoin, it's technology is also being rapidly obsolete. (It cannot support NFT minting, for example.) There are plans for DOGE to move over to proof-of-stake eventually, but the timeline is TBD.
4. Money Will Flow into Staking Rewards
As with ATOM/ALGO this past week, some lesser-known proof-of-stake coins have made its move - currently coins that offer competitive staking rewards are beating both the banks and the major proof-of-work coins, whom are simply unable to offer those types of rewards. ETH2 is now technically proof-of-stake, but its staking mechanisms aren't "liquid" - i.e. you don't know when you can get your money out. Some coins offer very high rewards (13%+) but is that too good to be true? Time will tell whether or not this model is sustainable or not.
5. Money Will Flow into Coins that Have Utility
Arguably crypto's least talked about topic in public - coins that have real-life use-cases and actual products may start to see some gains as utility creates new converts over to particular projects. As the money for hype marketing strategies start to run low, many of the coins that have been running on it will start to drop out, making it easier for coins with real customers and revenue to stand out. Some coins have no value other than "store of value" - some coins have robust DeFi options but basically operates like an accounting firm - but there are a few projects out there that are attempting to expand into the worlds of direct applications. This is probably the most optimistic take on Web3's future as a whole, but the path of getting there isn't likely to be smooth - they don't call it "creative destruction" for nothing, after all.
Of the projects out there, Tezos (XTZ) stands out as one of the few projects that have their hands in "everything" - with a diverse portfolio of projects in many sectors and brands across the world. (ETH does too, but their gas-fee problem has slowed technical and partnership development to a halt.)
--
The actual outcome will probably some combination of the trends above, and is likely to get very complicated as time goes on, but I do think that it's important to keep an eye out for how key factions and ideas are circulating in the space right now since a lot of things are likely to change very quickly in the near future as we head further into what could potentially be the biggest global recession ever recorded in human history. "Higher numbers = good" has been the main focus of the crypto industry up until now but as time goes on we're likely to see more complex and nuanced takes on how the economy works and how Web3 fits into it as a whole.
There might be some growing pains involved but this is how our understanding of economics matures, imo.

ALGO - Buying SignalBYBIT:ALGOUSDT
4H time frame
-
ALGO is in a descending channel, and it started to form this channel since increased by 41%.
The price stops making lower lows and hit Fib 0.382 smoothly for support confirmation.
We can long it at 0.34 and add more position at 0.335(Fib retracement level_0.382)
-
Entry: 0.34
Add: 0.335
TP: 0.3565, 0.3735
SL: 0.33

Algorand (ALGO) - September 29Hello?
Welcome, traders.
By "following", you can always get new information quickly.
Please also click "Like".
Have a good day.
-------------------------------------
(ALGOUSDT 1W Chart)
The key is whether you can support and move up in the 0.3310-0.4253 zone.
(1D chart)
0.4253 : volume profile point
0.3310: boundary point of the floor section
0.3091 : volume profile point
Therefore, it is important to be able to support and move up in the 0.3091-0.4253 zone.
As it has moved out of the mid- to long-term downtrend channel, if it finds support in the above area, I would expect a sharp move.
However, if it fails to find support and falls below 0.3091, I would expect it to fall below 0.2140.
However, as I mentioned in the description of the BTC chart, I think it is time for altcoins to gain support by increasing the BTC price by at least 20.7K.
Therefore, before that, it is recommended to trade conservatively when trading altcoins.
------------------------------------------------------------ -----------------------------------------------------
** All descriptions are for reference only and do not guarantee a profit or loss in investment.
** If you share this chart, you can use the indicators normally.
** The MRHAB-T indicator contains indicators that indicate support and resistance points.
** SR_R_C indicators are displayed as StochRSI(line), RSI(columns), CCI(bgcolor).
** CCI indicator is expressed as overbought range (CCI > +100) and oversold range (CCI < -100).
(Short-term Stop Loss can be said to be a point where profit and loss can be preserved or additional entry can be made through split trading. It is a short-term investment perspective.)
---------------------------------

💰ALGORAND analysis in One-hour time🔥🔰You can see Algorand's cryptocurrency analysis in a one-hour time frame (ALGOUSDT_ 1H)🔍💣
💥The price behavior is clear in the picture🧐 If the price can reach the DEMAND zone, it can experience an upward trend up to the Downward trend line🖤, and if it can break the Downward trend line🖤 upwards and stabilize❗ above it, it can have an upward trend up to the SUPPLY zone 🚀🔺
Do you think this analysis can be profitable❓
I hope the analysis was useful for you🤍🌹
📌Please introduce the channel to your friends 🙏🏻
__________📈TRADER STREET📉___________


algoStill thinking bottoms in as I alerted to my group back in early Sept like XRP back did bottom at .30c but if BTC nukes we could overthrow to that cluster of
support & resistance I marketed off in my highlighted circle for a capitulation event.

ALGOUSDT | Wave Projection | 4.4 Wave Expanding DiagonalPrice action and chart pattern trading setup
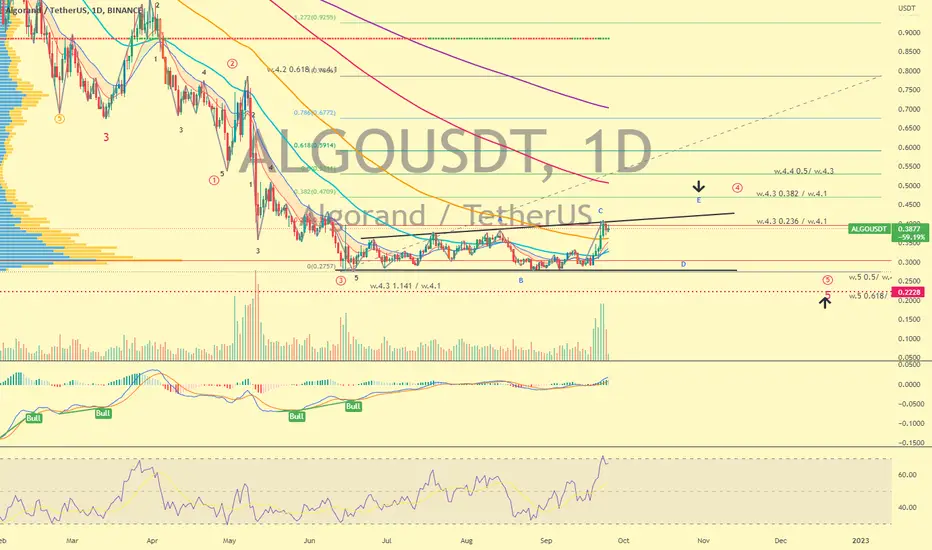
> A possible uptrend 4 wave with expanding triangle pattern ABCDE
> Target take profit zone at 4.4-wave @ 0.382 - 0.5 retracement zone of previous wave 4.2-wave
> The final downtrend 5 wave zone could be projected at 0.5 - 0.618 retracement zone between the recent lowest zone and original major 2-wave - dump & pump pattern is expected.
> Indicator: MACD squeezed and gold cross the baseline with wider uptrend ribbon, most likely to continue rising for now.
Always trade with affordable risk and respect your stoploss - nothing is 100%
ALGO CAN MAKE A CORRECTIONIt has the potential to make a correction, it can be entered as a scalpel. Always follow stop and capital management

ALGOUSD - Strong Bottoms ALGO has formed a large falling wedge which is common among many crypto coins currently
The green horizontal is a strong support line, using the curved line to show the kind of cup structure price is forming once hitting this green line
It is a very bullish structure
Lets see how it plays out

$ALGO - Time to GOAL Hello my Fellow Traderz,
With the arrival of the FIFA World Cup, keep your targets on the tokens which are directly or indirectly linked to the Championship.
I have already made an analysis on one such token in one of my previous ANALYSIS.
Today I've come up with $ALGO. #ALGORAND is officially the blockchain partner of FIFA WORLD CUP. So it is quite obvious MMs are burning the fuel for the leg up as the tournament is about to start.
$ALGO ha already broke the Trendline Resistance 1 with solid amount of VOLUME which indicates that this Breakout is Valid. Now approaching towards Trendline R2. Also the Horizontal Resistance of $0.42 lies there.
Break above $0.49 we do not have any resitances meanwhile and we could easily reach the next Major RESISTANCE Area of $0.70-$0.75.
Happy Trading my FAM....CHEERS!!!

The Proof-of-Stake Era is Here. Can ETH Survive the Winter?After Ethereum's "merge" this week, the crypto market continues to sag as a whole, unimpressed. One pattern we see emerging is that coins that have been proof-of-stake since the very beginning (especially ATOM and ALGO this week) have been performing very well relative to the rest of the market. (Coins to keep an eye on in the near future: XTZ, ADA, TRON, MATIC, etc.) As we head further into the recession we're going to start to see some of these patterns get more aggressive.
The reason why this is happening should be pretty obvious at this point: people's attentions are switching over to proof-of-stake, and the coins that offer competitive staking rewards (aka interest rates) are starting to attract new customers. Flipping NFTs is too confusing to most people but most people can tell when one rate is higher than another. (Especially since most banks are still stuck in 0-interest rate savings mode at the moment.)
The crypto community has largely been down on Ethereum lately as the realization that they've fallen behind the curve starts to settle in. But they're certainly not out of the race yet - the roadmap to make ETH competitive in the proof-of-stake race is pretty clear:
1) Make staking liquid - the fact that it's locked up for an indefinite period of time is pretty ridiculous, possibly illegal. (Probably in their own interest to do so quickly before it turns into a lawsuit, tbh.) As it stands now ETH's staking rewards are too cumbersome and not competitive enough for people to consider.
2) Adopting on-chain governance would make skeptics feel at ease and would quell some of the criticisms coming from the Bitcoin maxis too. The real problem is transparency, not centralization.
3) Fix the issues with scaling to bring gas fees down, finally. They can probably consult people from other chains who have already figured it out. (If they can get over themselves, that is, lol.)
They definitely have the resources to do so - that was never in question. Whether they're actually gonna do it, though, that's another story. I didn't exit completely but as a disclaimer I did sell off a pretty big portion of my ETH holdings this year because of concerns over its long-term prospects. Ethereum may be well on its way to becoming Bitcoin 2.0, given that it's now become a deflationary asset.
If you're an ETH holder you'll probably be OK since they'll probably continue to burn their supply to make sure that the price doesn't go down too much. Silicon Valley is known for their appeasement of the investor class and we're likely to see the same pattern play out again. But keep in mind that each coin burned just makes it harder for new people to come in - what they've done is basically put an expiration date on their own project since they're actively restricting the platform's growth now. (Crypto NIMBYism, as I like to call it.)
Coin supply is a controversial topic in the industry but can be understood in a fairly straight-forward way: The higher the supply, the better it is for newcomers; the lower the supply, the better it is for existing holders. Maxis will repeat whatever marketing slogans they were fed but at the end of the day, it's about who's back you're willing to scratch. Getting returns on your investment requires you to see things as they are and read between the lines of what's being said - are they using that wealth to make genuine improvements on the protocol itself, or are they just hoarding it and promoting the scarcity model behind your backs?
More coin supply to attract new talent/investors? Sure, good idea in theory. Just not here - "Not In My Back Yard". NIMBYism is a thing you see in the real-estate markets, and we start to see its ugly head rear in the crypto space, too.
I do owe a lot to ETH - it stabilized my finances, paid off my student loans, and gave me the time to do the things I wanted to do, rather than had to do. But it's probably time for me to move on - I'm here for the dream, not just the money. 🔥
