Algorand looks ready to trigger its inv h&s patternAfter doing a fakeout above the yellow neckline we now have price action for king above the white neckline….not sure which one will be the most valid but if the white neckline reaches its target they both do. I imagine it will be retesting the 1day 200ma before too long. *not financial advice*
Algorand

Make it or break itIf ALGO doens't start going up again it'll drop another 26% before finding a decent support. R/R is good at this point, I suggest you to keep an eye on it e check it after the weekend.
DISCLAIMER: I'm still bearish on BTC which means that if that dumps also alts will dump so this signal will be invalidated if BTC starts going down to 14K as I'd expect. In any case you can start DCA because this is definitely a good position where to start it.
Good luck
ALGO watch the daily close, may break out from 2022 downtrendThis is worth watching, as we may be in the process of breaking the downtrend going back to december 2021. On the 4hr time-frame there also appears to have been a breakout of the range that has held for the last month or so.

Algorand #ALGO - better not lose FIB golden pocketAlgorand currently at FIB golden pocket between $0.3118 - $0.3487
Next lower volume profile support at $0.2271 - losing that FIB 78.6% at $0.1939 is the typical last Crypto support
A bullish divergence on RSI might help ALGO for a recovery soon IMO
COMMENTS & FOLLOW appreciated
*not financial advice
do your own research before investing

Algorand (ALGO) - September 20Hello?
Welcome, traders.
By "following", you can always get new information quickly.
Please also click "Like".
Have a good day.
-------------------------------------
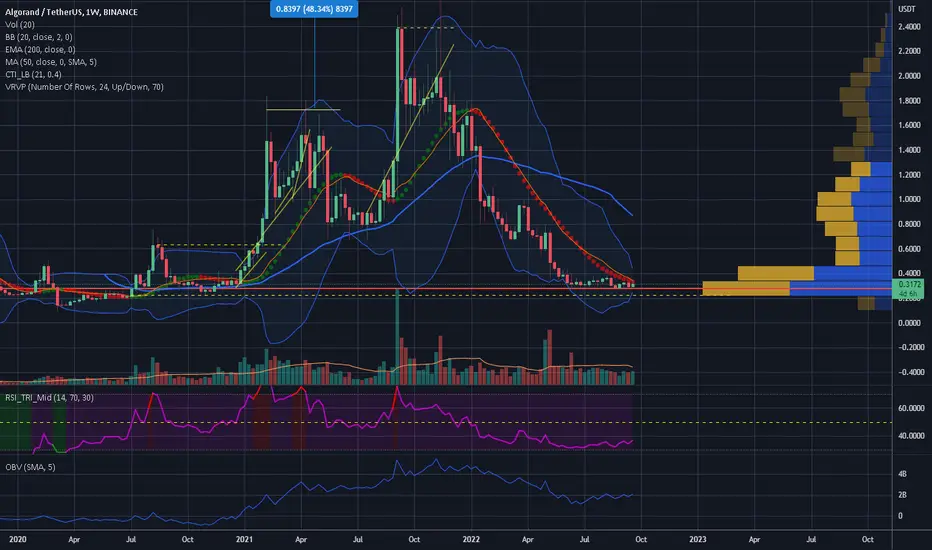
(ALGOUSDT 1W Chart)
The key is whether it can rise above the 0.3310-0.4478 section.
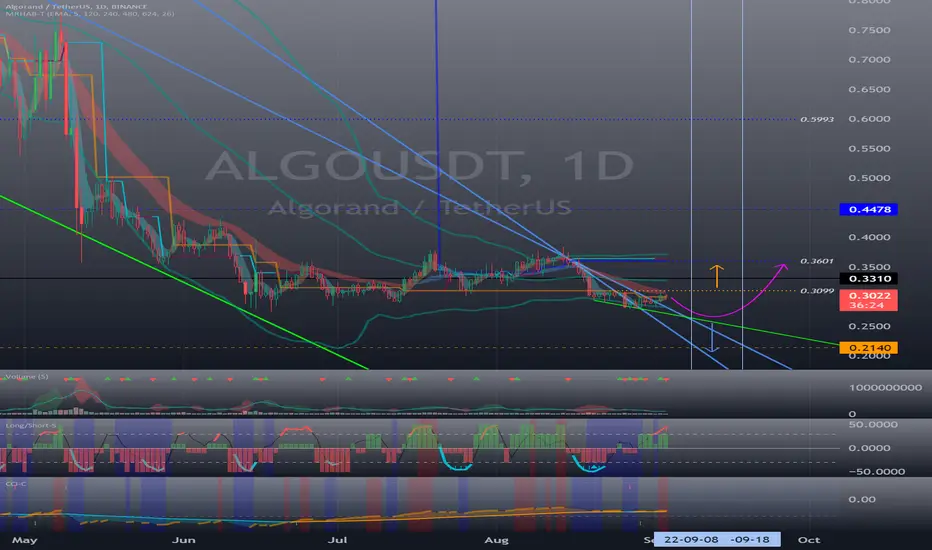
(1D chart)
The price needs to remain above 0.3099 to transition into an uptrend.
In order to continue the uptrend, it must rise above the 0.3642-0.3872 section.
If not, there is a possibility that it will fall to around 0.2140.
------------------------------------------------------------ -------------------------------------------
** All descriptions are for reference only and do not guarantee a profit or loss in investment.
** The MRHAB-T indicator, which is inactive on the chart, contains indicators that indicate support and resistance points.
** Background color of Long/Short-S indicator: RSI oversold and overbought sections
** Background color of CCI-C indicator: When the short-term CCI line is below -100 and above +100, oversold and overbought sections are displayed.
** The OBV indicator was re-created by applying a formula to the DepthHouse Trading indicator, an indicator disclosed by oh92. (Thanks for this.)
(Short-term Stop Loss can be said to be a point where profit and loss can be preserved or additional entry can be made through split trading. It is a short-term investment perspective.)
---------------------------------

ALGORAND- Time for the World Cup Trade?We live in the age of marketing amongst other things... including Blockchain.
I like to buy the news at the right level, based on my chart. ALGORAND chart today looks like this could be the time. After all i was short when most were buying those Fifa news earlier than they should had:
FIFA WORLD CUP:
As you probably already know FIFA has teamed up with blockchain technology company Algorand to agree a sponsorship and technical partnership deal.
The agreement means Algorand will become the official blockchain platform of FIFA and provide the official blockchain-supported wallet solution. As per the sponsorship agreement, Algorand will be a FIFA World Cup Qatar 2022™ Regional Supporter in North America and Europe, and a FIFA Women’s World Cup Australia and New Zealand 2023™ Official Sponsor.
Blockchains allow non-editable data to be permanently recorded and distributed on digital networks, while also facilitating innovations and ensuring safe, untampered exchange of value and assets such as non-fungible tokens (NFTs), and through blockchain-enabled wallets holding digital assets.
As part of the agreement, Algorand will also assist FIFA in further developing its digital assets strategy, while FIFA will provide sponsorship assets including advertising, media exposure and promotional opportunities.
On the occasion of the announcement, FIFA President Gianni Infantino said: “We are delighted to announce this partnership with Algorand. The collaboration is a clear indication of FIFA’s commitment to continually seeking innovative channels for sustainable revenue growth for further reinvestment back into football ensuring transparency to our stakeholders and world-wide football fans – a key element of our Vision to make football truly global. I look forward to a long and fruitful partnership with Algorand.”
Take it easy but watch out for the potential breakout.
One Love,
The FXPROFESSOR
PS. Don't forget about this: and also remember to always take profit on time...

📉FIFA Launches NFTs on Algorand 🏆 (ALGO/USDT analysis 🚀 ) 📈FIFA Launches NFT Platform on Algorand in Run-Up to World Cup!
With the 2022 World Cup just months away, FIFA, soccer’s global governing body, has announced it will launch an NFT platform for soccer-themed digital collectibles.
“Just like sports memorabilia and stickers, this is an accessible opportunity for fans around the world to engage with their favourite players, moments and more on new platforms,” said FIFA’s Chief Business Officer Romy Gai, in a statement.
so funda says, Algorand is now an apt option for possible growth ,even in this bearish market for couple month ahead !
📊Technical POV:
Although I've already analyzed Algorund on the weekly timeframe before ,but also in the daily perspective ,we can see more obviously , ALGOUSDT is trading on a support zone and struggling with a descending trendline ,so if holds this current lvl and breaks out this line then can see higher prices and Resistance zones !
✌️ Good luck with your trading and investing and remember: Trade smart…OR JUST DON’T TRADE!
--------------------------------------------------------------------------------------------------------------------
👉This analysis is my personal opinion ,not a financial advice ,so do your own research.
💚 if you're fan of my analyses please follow me , drop a comment 🗯 and Boost me 🚀🚀

Algorand ALGO Key ResistanceI've noticed a key area here on ALGO. Great performing coin in the past and we have been consolidating at this double bottom for a while now. Keep in mind we may crash tomorrow

Algorand shortAlgorand bounced off the resistance level. Asset bounced off the descending trendline. Bearish movement to support level at 0.281 is possible.

ALGOHello guys this is my trading analysis about ALGO thank you
IF you like my work please like share and follow thanks
TURTLE TRADER 🐢

Algorand (ALGO) - September 4Hello?
Welcome, traders.
By "following", you can always get new information quickly.
Please also click "Like".
Have a good day.
-------------------------------------
(ALGOUSDT 1W Chart)
The 0.3310 point is an important support and resistance point, and whether we can move higher than 0.3310 is crucial.
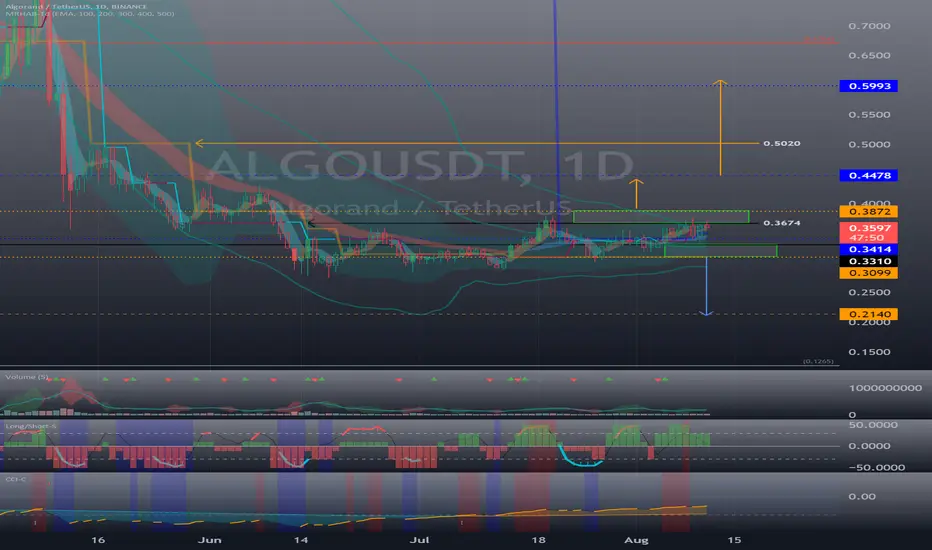
(1D chart)
It is mixed, so you need to be careful with your trade.
Therefore, it is necessary to confirm whether it can be supported by rising above the 0.3310 point.
- In order to continue the upward trend from the current position, it must rise above 0.3601.
- For those who are investing in ALGO, we recommend that you take the time to trade to increase the number of coins (tokens) you have.
From a mid- to long-term perspective (at least 6 months to 1 year or more), a large uptrend is expected.
------------------------------------------------------------ -------------------------------------------
** All descriptions are for reference only and do not guarantee a profit or loss in investment.
** The MRHAB-T indicator, which is inactive on the chart, contains indicators that indicate support and resistance points.
** Background color of Long/Short-S indicator: RSI oversold and overbought sections
** Background color of CCI-C indicator: When the short-term CCI line is below -100 and above +100, oversold and overbought sections are displayed.
** The OBV indicator was re-created by applying a formula to the DepthHouse Trading indicator, an indicator disclosed by oh92. (Thanks for this.)
(Short-term Stop Loss can be said to be a point where profit and loss can be preserved or additional entry can be made through split trading. It is a short-term investment perspective.)
---------------------------------
Algorand Bullish Broadening Bottom 2022Same idea, from 2021. Algorand is still forming a broadening bottom pattern, prefectly according to the textbook.

AlgorandusdtA strong downtrend, then a stop, without a significant pullback, a descending rectangle was formed.
The tool will go below. The entry point is a breakdown of 0.28 then the entrance to the retest of this level

Algorand (ALGO) - August 23Hello?
Welcome, traders.
By "following", you can always get new information quickly.
Please also click "Like".
Have a good day.
-------------------------------------
(ALGOUSDT 1W Chart)
The key is whether it can rise above 0.3310 and find support.
(1D chart)
If it does not rise above the 0.3099-0.3310 section, there is a possibility that it will fall to around 0.2140.
- Since the RSI, Stoch RSI, and CCI(9) indicators have all entered the oversold zone, if they start to break out of the oversold zone, it is likely to lead to a big rise.
To do that, you need to find support at or above the 0.3099-0.3310 range when you break out of the oversold zone.
If it doesn't and it's finding resistance as it is now, it's likely to lead to further declines.
------------------------------------------------------------ -------------------------------------------
** All descriptions are for reference only and do not guarantee a profit or loss in investment.
** The MRHAB-T indicator, which is inactive on the chart, contains indicators that indicate support and resistance points.
** Background color of Long/Short-S indicator: RSI oversold and overbought sections
** Background color of CCI-C indicator: When the short-term CCI line is below -100 and above +100, oversold and overbought sections are displayed.
** The OBV indicator was re-created by applying a formula to the DepthHouse Trading indicator, an indicator disclosed by oh92. (Thanks for this.)
(Short-term Stop Loss can be said to be a point where profit and loss can be preserved or additional entry can be made through split trading. It is a short-term investment perspective.)
---------------------------------

ALGORAND to $100 (£82) BY 2026?- IS20022 COMPLIANT crypto
- Fast and cheap to move money!
- Partnering up with FIFA 2022!

Algorand - Uptrend Continues!As long as it keeps the trend line intact, it can easily go and tap the range high at $0.40 short term.

$ALGOUSDT - Reversal play with +30% upsideTechnical Analysis (TA)
We are seeing a breakout from the wedge and early reversal signs on the weekly chart.
We should expect price to reach between 0.42 and 0.50.
Price Target
Entry: 0.38
Target 1: 0.42
Target 2: 0.50

ALGO higher prices are not too far to touch#ALGO/USDT
$ALGO is inside uptrend channel and price is above the middle line.
🐮 so there is a high probability that price extends its upward move to touch upper line of the channel that is the same with resistance zone above $0.4.
🐮🐮 In the long-term, a break out from the weekly resistance zone will increase price toward $0.56.

ONLY NEEDED GRAPH FOR NEXT 4 MONTHS *ALGO / USDT" *ALGORANT*On graph we see possible longer term price rebound.
White marks describes fakeouts out of 77MA on 1D and possible real breakout at this prices.
Then we see resistances marked by red line and target areas for next price movements.
Hoping and wishing you guys the best trades.
Share you opinion and boost the idea, Thanks.

Algorand (ALGO) - August 12hello?
Welcome, traders.
If you "follow", you can always get new information quickly.
Please also click "Like".
Have a good day.
-------------------------------------
(ALGOUSDT 1M Chart)
The key is whether the price can be maintained above 0.3310.
(1W chart)
The key is whether it can find support at the 0.3310-0.4478 zone and move higher than 0.6704.
- The RSI indicator is out of the oversold zone, but the Stoch RSI indicator is entering the overbought zone, so it is expected to show a mixed trend.
(1D chart)
It seems likely that a trend will form in a direction that deviates from the 0.3099-0.3872 range.
A move above 0.3872 is expected to rise above 0.4478.
However, holding the price above 0.3310 is expected to lead to an attempt to move higher above 0.3872.
If it falls below 0.3099, it is expected to decline to around 0.2140.
Therefore, if it falls below 0.3099 and resists, a stop loss is required to secure cash.
------------------------------------------------------------ -------------------------------------------
** All descriptions are for reference only and do not guarantee a profit or loss in investment.
** The MRHAB-T indicator, which is inactive on the chart, contains indicators that indicate support and resistance points.
** Background color of Long/Short-S indicator: RSI oversold and overbought sections
** Background color of CCI-C indicator: When the short-term CCI line is below -100 and above +100, oversold and overbought sections are displayed.
** The OBV indicator was re-created by applying a formula to the DepthHouse Trading indicator, an indicator disclosed by oh92. (Thanks for this.)
(Short-term Stop Loss can be said to be a point where profit and loss can be preserved or additional entry through split trading. It is a short-term investment perspective.)
---------------------------------

Algorand finally poking above the inv h&s neckline.For now we won’t know exactly where the measured move target will be until we know clearly where we officially break above the neckline as well as flip it to solid support. Will update this idea once it happens. *not financial advice*

ALGORAND - Potential to Explode UpwardsBITCOIN AND CRYPTO MIGHT PUMP ON GOOD USA DATA:
Weekends have been very weak the past months but this could change. After all, crypto adoption is a trend. Not convinced?
well here it is: Coinbase and BlackRock to create new access points for institutional crypto adoption by connecting Coinbase Prime and Aladdin
News:
Algorand Foundation announces global winners for its $50M blockchain research and education program
One Love,
the FXPROFESSOR
