Algo is supremely BULLISHALGO is ready to start, do not miss this extremely bullish move. Get ready for 300% returns.
Algorand

ALGO... seeing some love? I'm just throwing this out there because ALGO is a very underrated, and undervalued currency.
<₮0.75 is a good stop in general, and I feel as though 0.75 could finally provide some decent support.
ALGO still offers the least expensive, most-secure option of sending crypto from one place to another.
The ALGO blockchain has never crashed. Ever. I don't think any other chains can say the same thing.
🤷♂️ bullish IMO
♠️🤫🐿

AlgoUsd moonshootAlgoUSDT now is situated into a huge falling wedge which is a bullish pattern.
We need a nice weekly close here to make a beautiful double bottom with a strong bullish divergence between the price and RSI/Stoch indicators
Some weekly targets are :O.7956 $
0.842 $
1.13 $ -Target from wedge
Also the volume is still decreasing which means a huge reversal and volume boost will come
Be prepared for a shot

ALGOUSDT SETUPALGOUSDT:
Price is trying to regain some momentum after going through an accumulation phase. If bulls react and behave aggressively we can expect a good short-term recovery to upside resistance levels.

ALGORAND ALGO/USDT i see this coin is on Support Zone & Triple Bottom Pattern this coin is Very Bullish Now

Double Bottom with Bullish Divergence at PCZ of Bullish SharkThis is an Update to a previous ALGO setup of the same sort except the pattern has now further developed with the addition of a Double Bottom of the PCZ. The Bullish Targets and Stops remain the same as the previous setup

ALGO Rejected on RetestAlgorand has been moving in a descending channel since early February. Rejected at $0.76, ALGO looks to stay in the downward trending channel with a test of $0.68 in the coming days.

Opportunity brewing, but bearish break expectedKeeping an eye on ALGO/BTC. It doesn't look pretty, but there may be an opportunity developing in the next week or so. We're currently testing the Support of a large Descending Triangle. Descending Triangles are bearish and so a break down (at some point) is expected. Combined with the recent bearish momentum and overhead resistance, I'm inclined to think the break will happen sooner rather than later. However, there are some bullish signs that keep ALGO on my radar: We're seeing bullish divergence on the Daily chart and we're entering into another buy zone. A small buy here could be a high-risk, high-reward option for the adventurous--if support holds we could see a retest of the top of the Descending Triangle. However, I'm on the sidelines waiting for a more secure entry.
Patience is the least sexy of the superpowers.
----------------------------------------------------------------
These are my personal views and not financial advice. Please do your own research before investing.
I'd love to hear your thoughts, ideas and feedback. Feel free to Comment and I'll try and get back to you quickly.
If you appreciated this analysis, consider Liking or Following . Thanks!

ALGOUSD ReversalALGO traded down to its reversal zone. As price action approached the reversal zone, it began correcting to the upside, showing that it is ready for price to continue its uptrend. I expect ALGO to have a bright future as well to trade at higher prices!

ALGO - Top-Down Analysis!Hello TradingView Family / Fellow Traders. This is Richard, as known as theSignalyst.
WEEKLY: Left Chart
ALGO is overall bearish however, it is approaching a strong support zone in green so we will be looking for buy setups on lower timeframes.
DAILY: Right Chart
ALGO is forming a double bottom pattern but it is not ready to go yet.
Trigger => For the bulls to take over, we need a momentum candle close above the gray neckline.
Meanwhile, until the buy is activated, ALGO can still trade lower.
Always follow your trading plan regarding entry, risk management, and trade management.
Good luck!
All Strategies Are Good; If Managed Properly!
~Rich

ALGO Long term analysis ELLIOT WAVES this is a LONG term analysis.
I believe whatever 5 waves up we had is a LEADING DIAGONAL wave 1 of a bigger impulsive wave.
Looking for that wave 2 tripple three correction.
I believe ALGO is a must buy around the box area as It will be a money maker in the next 2 years.

Algorand (ALGO) count me in!Algorand is a token that I have not covered on this platform too much. It's a shame because ALGO is one of my favorites. In terms of the accessibility, speed, and efficiency- ALGO blockchain is top notch. I mean, heck- if you ever want to send cryptocurrencies anywhere for the cheapest possible price... what do you use? -- ALGO
The volume and number of wallets opened/holding ALGO has also steadily increased over the last several months with no real fall off...
♠️🤫🐿

$ALGO Inverted Cup & HandleBearish pattern forming on $ALGO
Invalidation w/ candle closing above $0.905
Target 1 Zone
$0.85 to $0.86
Target 2 Zone
$0.71 to $0.74

ALGO could make the move up after this trendline break.ALGO daily chart
This chart is still intact and once it gets the
push above the descending trendline, This
chart could really show whos boss...The ALGO
blockchain has been rated top 3 best blockchains
in this industry as well. Lets see what it can do here
in the next 1-8 weeks. RSI is literally Oversold
and on Deck to move up now.

ALGO breaking out on 4hr timeframe?It seems like ALGO has retested the previous supply zone and currently trying to flip it as a support.
Buying ALGO here can be a good move, if it holds here R:R is good.

Algorand ALGO Price Targets and Stop LossALGO/USDT short
Entry Range: $0.85 - 0.91
Take Profit 1: $0.81
Take Profit 2: $0.75
Take Profit 3: $0.67
Stop Loss: $0.06

Algorand Short Scenario $ALGO's last two local highs both saw spinning top candles on the daily chart. Each realizing approx 20% retracement that followed the daily candle close over about 1.5 weeks.
Today, ALGO is forming another spinning top. If the trend continues, this gives a short-term price target of $0.67 by end of March.

ALGO IN ZONEIn the bottom of the zone im happy to long from here and hope i don't get stopped out !
Lets go

Algo USDT ShortAlgo USDT 1D Time Frame looks bearish and it shows Hidden Bearish Divergence, It is POSSIBLE to hit the VWAP Line(0.618 Fib Line) or the 200 EMA(0.382 Fib Line) before going down.

Algorand (ALGO) Possible Breakout Idea.Possible breakout for both downtrend and fib wedge resistance. These are pros and cons of this setup
PROS
There is a Bullish Divergence in Volume Price Trend indicator. (by:AdonisWerther)
The wick of the last low didn't go below last lows wick.
Strong support at 0,8861 levels.
Price is still trying to break fib trend resistance.
CONS
Buyers volume is still low.
With low volume price could struggle to break 2 resistance at the same time.
Bitcoin could go below 45.000 (it can be seen as ALGO rejetcing from resistance).
New Higher Low.

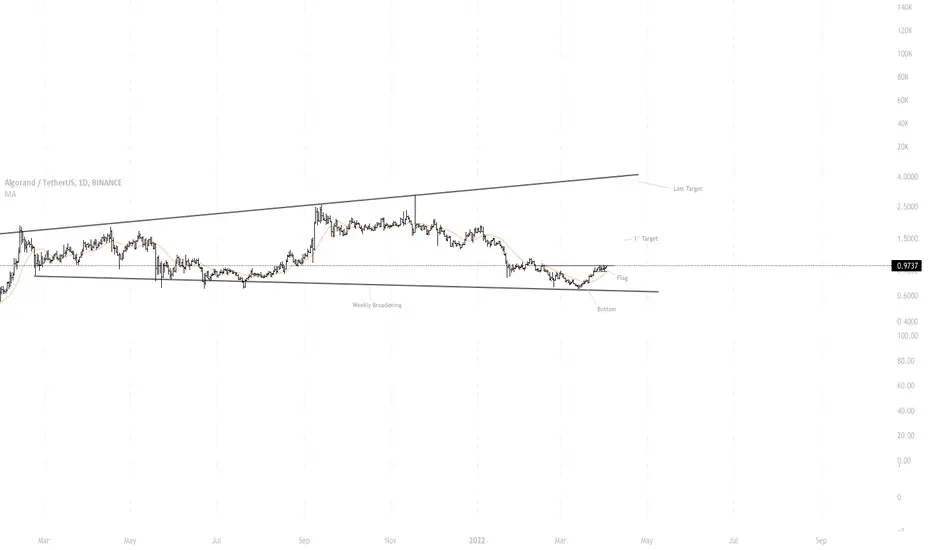
Algorand: Broadening + Bottom + Flagthe break above 1 could confirm the flag, and therefore the bottom with the bounce on the lower side of the weekly Broadening and therefore the first target of the Bottom and the last target the upper side of the Broadening
2022 Algorand comparison to XRP in 2017 based on btc.d & total2The more I look at it, the more my mind denies it and fixates itself into a disbelief stage. Big what if. Staying neutral for now. Best thing you can do is hold spot and avoid leverage at all costs.

ALGO - Wait For The Trigger!Hello everyone, if you like the idea, do not forget to support with a like and follow.
As per my last video analysis, we were waiting for the bulls to take over from a medium-term perspective by breaking above the inverse head and shoulders neckline.
ALGO broke above the neckline and traded higher. Now for the bulls to take over from a long-term perspective, we need a daily candle close above the last high in gray and above 1.0 round number.
Meanwhile, until the bulls take over from Daily, the bears can still kick in to form another low.
Always follow your trading plan regarding entry, risk management, and trade management.
Good luck!
All Strategies Are Good; If Managed Properly!
~Rich
