Just look at this wow trading zone! This is just proof that my strategy always works! Just look at this wow trading zone!
Algorand

Algorand : algousdt Everyone in crypto knows #Algorand: strong fundamentals, good community, high trading volume...
Now that we are talking #algousdt has broken a triangle upside.
If you go back and look at the chart, you see a huge cup&handle pattern which is also broken upside.
Everything suggest buy. I'm telling you; this is gonna be huge .
#full_send #algo #todamoon
REMEMBER: this is daily timeframe, I do NOT tell you where/when to buy. Make your decision based on the chart and provided patterns.
Always do your own research. #dyor
Good luck,
Median Eagle.

ALGOOO lowest you will ever be able to buy.I’m buying on the 1.59. Approx 1000 dollars and staking for 60 days with a 9.47% apr - I suggest you do the same. No analysis I’m just telling you what to do. Don’t take my word for it dyor

Algorand vs ICP dump and bounceBoth fundamentally strong projects that got overvalued at the top of a bull run. Both dumped more than 90% since launch. ICP seems to have much more strength as can be seen from the first bounce to 0.382 fib retracement.

ALGORAND LONGAlgorand is a blockchain Pure Proof of Stake based.
Entry price: 1.519
Take profit_1: 2.061
Take profit_2: 2.531
Stop loss: 1.138
Position: LONG
The RSI indicator is into oversold area.

#ALGO long !!!Multi-month support level on Algorand was held during today's dump. After the bears couldt broke through the level, bounce will likely continue and reach the resistance level at 2.4$

ALGO STANDS STRONGAlgorand was showing the strongest type of structure prior to the sell-off in crypto throughout todays Asian-Session.
Considering this neutral pennant has held, and that price does not fall below 1st support at 1.70 USD then ALGO looks clear to re-test the top of the wedge around 2.30USD, 2nd Resistance.
Bitcoin must hold above 60K USD for this trade idea to stay valid, should BTC/USD fail to do so then new lows are inbound on ALGO around 1.55USD
1ST SUPPORT: 1.70 USD
2ND SUPPORT: 1.55 USD
1ST RESISTANCE 2.00 USD
2ND RESISTANCE 2.30 USD
“Any opinions, news, research, analyses, prices, other information, or links to third-party sites contained on this website are provided on an "as-is" basis, are intended only to be informative, is not an advice nor a recommendation, nor research, or a record of our trading prices, or an offer of, or solicitation for a transaction in any financial instrument and thus should not be treated as such. The information provided does not involve any specific investment objectives, financial situation and needs of any specific person who may receive it. Please be aware, that past performance is not a reliable indicator of future performance and/or results. Past Performance or Forward-looking scenarios based upon the reasonable beliefs of the third-party provider are not a guarantee of future performance. Actual results may differ materially from those anticipated in forward-looking or past performance statements. easyMarkets makes no representation or warranty and assumes no liability as to the accuracy or completeness of the information provided, nor any loss arising from any investment based on a recommendation, forecast or any information supplied by any third-party."


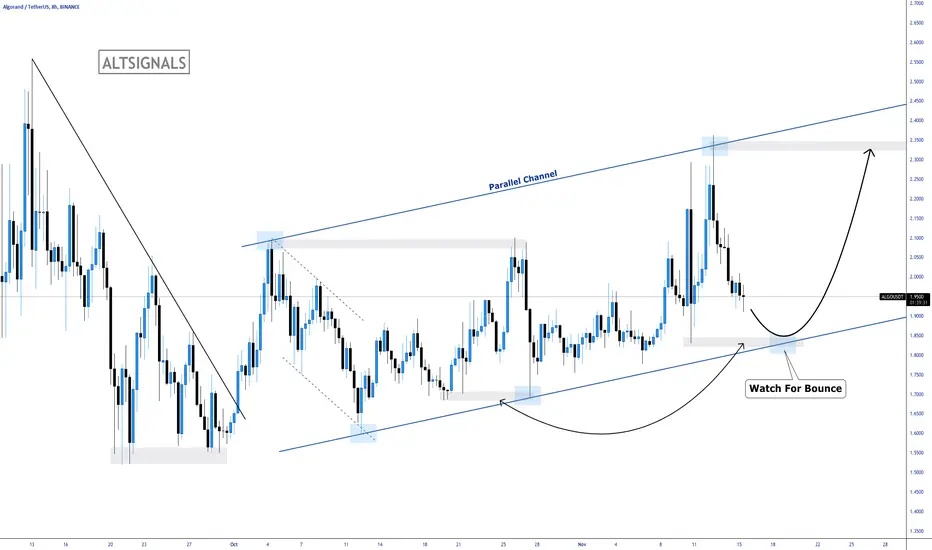
ALGO - Trade This Channel!Algo has been within a channel since the start of October and every time it reaches either extremes of the channel, we get a really nice reaction.
We are looking for a similar reaction this time round.
Trade Idea:
- Watch for price to come back to the channel support and show bullish momentum
- Enter with stops below the channel
- Target the recent highs as first target and channel resistance for second targets
Algorand (ALGO) - November 15Hello?
Welcome, traders.
By "following", you can always get new information quickly.
Please also click "Like".
Have a nice day.
-------------------------------------
(ALGOUSD 1W Chart) - Mid-Long-Term Perspective
Above 0.76754798 point: uptrend expected to continue
(1D chart)
First resistance section: near point 2.30117362
Second resistance section: 2.84473154-3.02591751
Support section: 1.57642973-1.75761570
We need to see if we can sustain the price above the 1.90329264-1.97455023 segment.
If it goes down, you should check to see if you find support in the support zone.
If the price holds above the 1.90329264-1.97455023 range, I would expect a move to move above the first resistance level.
------------------------------------------
(ALGOBTC 1W chart)
4309 Satoshi-6469 Satoshi section or more: Expected to create a new wave.
Above the 2886 Satoshi point: Expected to turn to an uptrend.
Currently, it is forming a box section below the 4309 Satoshi point and walking sideways.
------------------------------------------
We recommend that you trade with your average unit price.
This is because, if the price is below your average unit price, whether it is in an uptrend or in a downtrend, there is a high possibility that you will not be able to get a big profit due to the psychological burden.
The center of all trading starts with the average unit price at which you start trading.
If you ignore this, you may be trading in the wrong direction.
Therefore, it is important to find a way to lower the average unit price and adjust the proportion of the investment, ultimately allowing the funds corresponding to the profits to regenerate themselves.
------------------------------------------------------------ -----------------------------------------------------
** All indicators are lagging indicators.
Therefore, it is important to be aware that the indicator moves accordingly with the movement of price and volume.
However, for the sake of convenience, we are talking in reverse for the interpretation of the indicator.
** The MRHAB-O and MRHAB-B indicators used in the chart are indicators of our channel that have not yet been released.
(Since it is not publicly available, you can use this chart without any restrictions by sharing this chart and copying and pasting the indicators.)
** The wRSI_SR indicator is an indicator created by adding settings and options to the existing Stochastic RSI indicator.
Therefore, the interpretation is the same as the traditional Stochastic RSI indicator. (K, D line -> R, S line)
** The OBV indicator was re-created by applying the formula to the DepthHouse Trading indicator, an indicator disclosed by oh92. (Thanks for this.)
** Support or resistance is based on the closing price of the 1D chart.
** All descriptions are for reference only and do not guarantee a profit or loss in investment.
(Short-term Stop Loss can be said to be a point where profit and loss can be preserved or additional entry can be made through split trading. It is a short-term investment perspective.)
---------------------------------

$ALGO could test previous ATHIf it does test the ATH it may not break through it on the first try, it will probably be the second unless it comes in with incredible volume and velocity. If it doesn't break out it could break down to the 1.87 level, the lower bound of the pennant/triangle.
My money's on Algorand breaking out and flipping ADA then ETH.


ALGOUSDT (Algorand) - Coin of the WeekAlgorand is a self-sustaining, decentralized, blockchain-based network that supports a wide range of applications. These systems are secure, scalable and efficient, all critical properties for effective applications in the real world. Algorand will support computations that require reliable performance guarantees to create new forms of trust. The Algorand mainnet became live in June 2019, and was able to handle almost 1 million transactions per day as of December 2020. Algorand initial coin offering (ICO) was held in June 2019, with the Algorand price of $2.4 per token.
Technically, for this coin we see 2 major scenarios playing out right now. The first one is a retracement to the blue channel low and then a continuation to the upside and the second one is a break of the channel with a consolidation below and a move to the downside that will reach at least the first support area marked on the chart at 1.2 USDT.
Trade with care.
Best regards,
Financial Flagship
Disclaimer: The analysis provided is purely informative and it should not be used as financial advice. Remember that you need a plan before you start trading; so, take this knowledge and use it as a guidebook that will ultimately help you understand the market and easily predict your next move.

ALGO cup and handle and trend lines#ALGOUSDT
$ALGO shaped cup and handle pattern that the targets is around $3.
there are trend lines that price is trading below a line, breaking out from the current line will lead price to $3 in mid term.
but if price stay below this ascending line, possible to drop to support zone and even lower.
ALGOUSDT TECHNICAL ANALYSIS 13112021What Are Fibonacci Retracement Levels?
Fibonacci retracement levels are horizontal lines that indicate where support and resistance are likely to occur. They stem from Fibonacci’s sequence, a mathematical formula that originated in the 13th century.
Each level is associated with a percentage. The percentage is how much of a prior move the price has retraced. The Fibonacci retracement levels are 23.6%, 38.2%, 61.8%, and 78.6%. While not officially a Fibonacci ratio, 50% is also used.
from investopedia.
No investment advice...

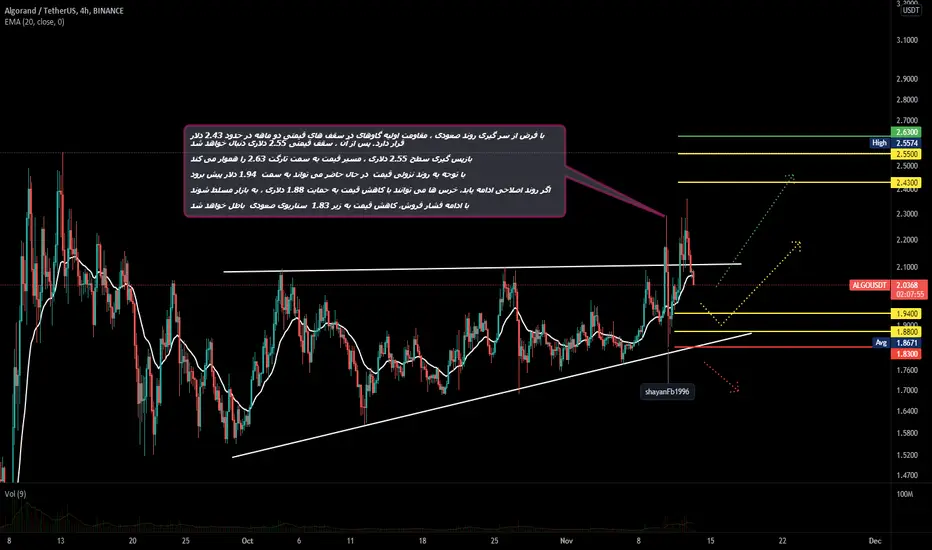
ALGOUSDT 4HHi everyone
Assuming a resumption of the uptrend, the initial resistance of cows in the two-month price range is around $ 2.43. After that, the $ 2.55 price cap will follow
Returning to the $ 2.55 level paves the way for the 2.63 target
Due to the downtrend, the price can now move towards $ 1.94
If the bearish trend continues, the bears could dominate the market by lowering the price to $ 1.88
As the selling pressure continues, the price reduction below 1.83 will invalidate the uptrend scenario
Thankful
algorand algo algousd#1
algorand algo algousd
algorand algo algousd
algorand algo algousd
algorand algo algousd

ALGO going for ATH??If ALGO finally breaks its resistance at $2.26 we are probably going to see ALGO at its ATH again. But if it gets rejected again we're going to have a triple top and in result of that ALGO will fall to about $1.90 or below. Just keep an eye on ALGO!!!!!


Algorand (Breakout)Algorand has finally broken out of the sideways trading it's been tracking on.
Algo is now tracking on an ascending channel, leading back to $2.39.
Price $2.49-$2.60 within range by Mid-December.
Algorand is also trading nicely within the top bounders of a Fibonacci retracement pattern at the moment.
support at $1.94-$2.00.
related published ALGO idea linked below:

ALGO - almost ATH!Top of the Morning!
Algo had a good run, it's hit almost ATH but it shows rejection on going further up for now. My DCA levels are:
$2.08
$1.91
$1.72
$1.54
Cheers!

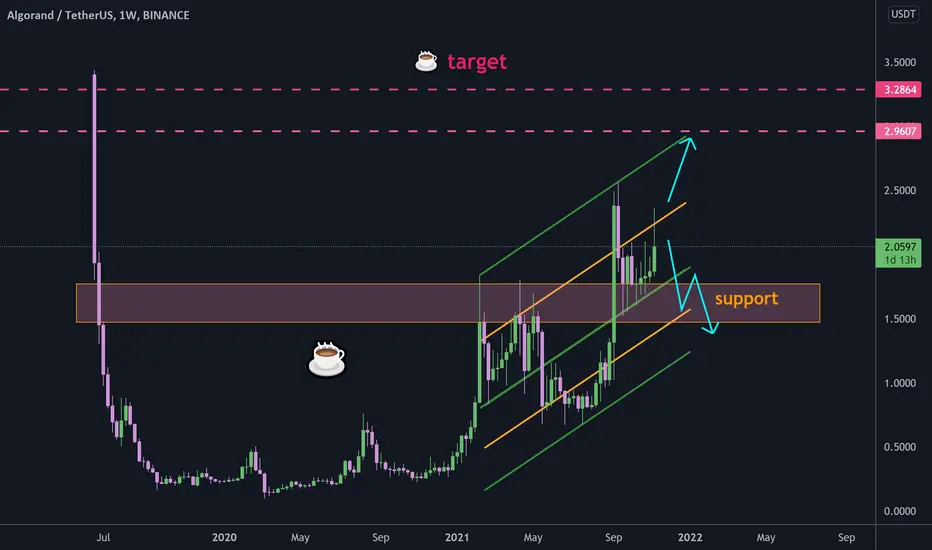
ALGORAND 1 possible long term scenarioFirst things first, monthly chart looks very bullish. Very obvious higher highs and high lows, market structure break leaving monthly demand zones. Using the fib trend tool, we can guess at AlGOs next target which would be 3.3057 which is our 1.618 fib target.
Judging by the current swings in the market, if there is some sort of major correction, I'd expect price to go down either to the 0.5 fib level or below it to fill that imbalance zone it left behind and maybe bounce from there. Though at the moment, we are still in a bull market so I don't expect such a major correction.
But if we do get one, it wouldn't be a bad thing because at 0.5 or below it, we could potentially find amazing long term entries.
So if you do see ALGO going way down for some reason, look at the monthly.
Cheers.
