Algorand disjointed channel
I'm still bearish watching the paint dry but I have missed some good trading opportunities. If the price goes back down, I will probably play this bottom of the disjointed channel and hope for a breakout hire. I'm not 100% at that level, just in case it breaks to the .20 level.
Algorand

ALGOUSDT %150 HUGE VOLUME SPIKE!Green Line and Blue Box: Excellent Buy Zones
Both the green line and the blue box are thoroughly analyzed and show tremendous potential.
Highlights:
Green Line: A critical support level—simple yet effective. Buyers are likely to step in here.
Blue Box: Carefully selected using the best tools: volume footprint, volume profile, CDV, and liquidity heatmap. It’s a high-probability zone.
Buyer Confirmation: Early signs of buyer activity make these levels even more compelling.
Key Observations:
"The blue box is very carefully picked using volume footprint, volume profile, cumulative delta volume, and liquidity heatmap. When trading this zone, I will look for buyers and upward market structure breaks in lower time frames for confirmation."
This setup looks promising, and I’m optimistic about its potential. Let’s watch for confirmation before acting! 🚀
Let me tell you, this is something special. These insights, these setups—they’re not just good; they’re game-changers. I've spent years refining my approach, and the results speak for themselves. People are always asking, "How do you spot these opportunities?" It’s simple: experience, clarity, and a focus on high-probability moves.
Want to know how I use heatmaps, cumulative volume delta, and volume footprint techniques to find demand zones with precision? I’m happy to share—just send me a message. No cost, no catch. I believe in helping people make smarter decisions.
Here are some of my recent analyses. Each one highlights key opportunities:
🚀 RENDERUSDT: Strategic Support Zones at the Blue Boxes +%45 Reaction
🎯 PUNDIXUSDT: Huge Opportunity | 250% Volume Spike - %60 Reaction Sniper Entry
🌐 CryptoMarkets TOTAL2: Support Zone
🚀 GMTUSDT: %35 FAST REJECTION FROM THE RED BOX
🎯 ZENUSDT.P: Patience & Profitability | %230 Reaction from the Sniper Entry
🎯 DEXEUSDT %180 Reaction with %9 Stop
🐶 DOGEUSDT.P: Next Move
🎨 RENDERUSDT.P: Opportunity of the Month
💎 ETHUSDT.P: Where to Retrace
🟢 BNBUSDT.P: Potential Surge
📊 BTC Dominance: Reaction Zone
🌊 WAVESUSDT.P: Demand Zone Potential
🟣 UNIUSDT.P: Long-Term Trade
🔵 XRPUSDT.P: Entry Zones
🔗 LINKUSDT.P: Follow The River
📈 BTCUSDT.P: Two Key Demand Zones
🟩 POLUSDT: Bullish Momentum
🌟 PENDLEUSDT.P: Where Opportunity Meets Precision
🔥 BTCUSDT.P: Liquidation of Highly Leveraged Longs
🌊 SOLUSDT.P: SOL's Dip - Your Opportunity
🐸 1000PEPEUSDT.P: Prime Bounce Zone Unlocked
🚀 ETHUSDT.P: Set to Explode - Don't Miss This Game Changer
🤖 IQUSDT: Smart Plan
⚡️ PONDUSDT: A Trade Not Taken Is Better Than a Losing One
💼 STMXUSDT: 2 Buying Areas
🐢 TURBOUSDT: Buy Zones and Buyer Presence
🌍 ICPUSDT.P: Massive Upside Potential | Check the Trade Update For Seeing Results
🟠 IDEXUSDT: Spot Buy Area | %26 Profit if You Trade with MSB
📌 USUALUSDT: Buyers Are Active + %70 Profit in Total
🌟 FORTHUSDT: Sniper Entry +%26 Reaction
🐳 QKCUSDT: Sniper Entry +%57 Reaction
📊 BTC.D: Retest of Key Area Highly Likely
This list? It’s just a small piece of what I’ve been working on. There’s so much more. Go check my profile, see the results for yourself. My goal is simple: provide value and help you win. If you’ve got questions, I’ve got answers. Let’s get to work!

TradeCityPro | ALGO Unraveling Trends and Forecasting the Next👋 Welcome to TradeCity Pro! In this analysis, I want to examine the ALGO coin for you. Algorand blockchain is one of the layer 1 networks.
📅 Daily Timeframe: Correction and Rest After 375% Growth
In the daily timeframe, we have seen a significant price increase from $0.1085 to $0.5138. After bottoming out at $0.1085, coinciding with the breakout of Bitcoin's ATH, it started its movement and after breaking $0.1602, it began its main movement and reached the resistance at $0.5138.
📈 During this movement, due to high momentum and very high buying volume, it easily broke through the very important resistance at $0.3220. Now, after reaching $0.5138, we have entered a market correction phase.
🔍 Currently, after exiting Overbuy, its momentum has decreased and it has corrected to the 0.382 Fibonacci level, which overlaps with $0.3220. It has hit this area several times and each time it has managed to stay above this area, and this support has not yet been broken.
🔽 If $0.3220 breaks, the next areas are the 0.5, 0.618, and 0.786 Fibonacci levels, which we will see how the price reacts to. After these areas, the next supports are $0.1602 and the last support at $0.1085. A break of 41.63 in the RSI increases the likelihood of a correction occurring.
📊 If the resistance at $0.5138 is broken, the next resistance will be $0.7414. Entry of buying volume and a break of 70 in the RSI can help break $0.7414.
📝 Final Thoughts
This analysis reflects our opinions and is not financial advice.
Share your thoughts in the comments, and don’t forget to share this analysis with your friends! ❤️

ALGO / USDT Breakout Follow UpLooking for a Breakout for This Pair
This pair has been consolidating within the $0.43–$0.32 range , and a breakout appears imminent. The direction of the next swing trade will hinge entirely on whether the breakout occurs to the upside or downside.
Patience is key — let’s see where the momentum takes us! 📈📉

Missed the First Move on $ALGO – Still Eyeing Big Upside!Completely missed this one, same as CRYPTOCAP:HBAR , and now I’m looking to get in. Hate missing the first move when it’s right there, especially with the monthly blocks showing the setup.
The plan is to enter closer to 33c, though I’m not sure if it’ll give that opportunity. My target is $2.30, just below ATHs.
CRYPTOCAP:ALGO still has plenty of upside.

Algorand Bullish Divergence
Two drives of bullish divergence are playing out on the daily chart for Algorand. This looks like a Higher Low being formed to test the Lower High. The bullish trend is waiting for the trendline to break to one side and is leaning toward the upside.

ALGORAND Bearish Divergence
A bearish divergence is forming with Algorand, requiring Algo to close above the lower high "wick". This is a strong move, but with Bitcoin testing the head and shoulders trendline and Ethereum forming a bear flag, it seems like a trap. Indicators suggest a downward trend.

Algorand "ALGO" Price Target
The ALGO price target is projected to be in the range of approximately .13 .16. I derive this from the breakdown area to the high point, resulting in a measured move that aligns with other crypto retracements having measured H&S targets. Everything will revert to their pre-election levels, implying that Bitcoin will reach 73-76K. This is using a 4hour chart so take that into account.

ALGO Going Lower
ALGO experienced a dead cat bounce back to the .35-.37 area and is expected to test the 22-.25 area before rising again.

Can ALGO Break Free? Bulls Eye $0.531, but First $0.453!
Algorand ALGO is tiptoeing around $0.4288, the mid of the range zone with slow and choppy price action.
1 A decisive break above $0.453 could give the bulls a reason to celebrate, clearing the path for a run toward the next resistance at $0.531. If momentum builds, we could see ALGO stretching its legs and aiming even higher (Green Projections).
2. On the flip side, if $0.398 fails to act as a safety net, things could get bearish short-term. Bears might take charge, dragging the price toward the next support at $0.32. That’s where traders may want to look for potential signs of life and opportunity to DCA (Red Projection).
To sum it up: $0.453 is the hurdle bulls need to clear for upside excitement, while $0.398 is the line in the sand for buyers. It’s ALGO’s time to decide—will it climb higher or hit the floor? Stay tuned!

ALGOUSD Bull Flag giving a new opportunity to buy.Algorand (ALGOUSD) posted last week its first red 1W candle after an impressive rally of 5 straight green weeks since the U.S. elections. This rally technically stopped on the 1W MA200 (orange trend-line), as although it crossed it, it failed to close the 1W candle above it, which resulted in last week's rejection and red candle.
The 1W RSI turned from extremely overbought (+85.00) to about turn just bullish below the 70.00 barrier. The last time we saw a similar price/ 1W RSI behavior was during the November 2020 - February 2021 rally. As you can see, both started on Bull Flag formations that initiated those impressive rallies that were supported by the 1W MA50 (blue trend-line).
When the February 08 2021 1W RSI hit 85.00 and got rejected, the price started a new Bull Flag pattern that by June 21 2021 hit the 1W MA50 and after forming a multi-week Support base, it rebounded again aggressively. The whole sequence from the November 2020 rally to the November 2021 Top was a +1200 rise.
We expect a similar development and as the dominant historic pattern of Algo seems to be a Channel Down, the next rally can complete a +1200% rally just below the pattern's top (Lower Highs trend-line) at $1.200.
-------------------------------------------------------------------------------
** Please LIKE 👍, FOLLOW ✅, SHARE 🙌 and COMMENT ✍ if you enjoy this idea! Also share your ideas and charts in the comments section below! This is best way to keep it relevant, support us, keep the content here free and allow the idea to reach as many people as possible. **
-------------------------------------------------------------------------------
💸💸💸💸💸💸
👇 👇 👇 👇 👇 👇

Algorand ALGO price is trying to come to lifeAfter a 3-year decline, CRYPTOCAP:ALGO price managed to “grow back” a bit)
Now, buyers of OKX:ALGOUSDT need to keep the price above $0.275-0.32 if they want to continue growing.
If this condition will meets, then it will be possible to aim for $1.25-1.35 per #Algorand token
_____________________
Did you like our analysis? Leave a comment, like, and follow to get more

My point of view for ALGODear Follower
I got a multi request to analyze ALGO
I see ALGO most likely will hit $17 as a final target
I recommend liquidate 50% of your fund at that price then start use a trilling stop under each last new bottom for the rest of the fund

Algorand (algo)Algo usdt Daily analysis
Time frame 4hours
Risk rewards ratio >1.3 👈
Algorand rank is 40 and market cap 4.21 NYSE:B
It's all time high is 3.28 $ and you can see , good growth for this in altseason
Algorand is a self sustaining decentralized, blockchain base network that supports a wide range of applications.
This system is secure, scalable and efficient
All critical properties for effective applications in the world.
Algorand will support computation that requires reliable performance guarantees to create a new formes of trust.
Technically we have no resistance in the way of my first target. Just a weak resistance in 0.69$ area.

Algorand (ALGO/USD) 4-Hour Chart: Price Action Analysis
Title: Algorand (ALGO/USD) 4-Hour Chart: Price Action Analysis and Key Structural Shifts
Post:
A thorough analysis of Algorand's 4-hour chart reveals a significant transformation in market sentiment, marked by key structural changes at pivotal price levels. Here's an in-depth exploration of the price action structure theory about this chart:
Trend Transition: Initially, Algorand was on an upward trajectory, as evidenced by a series of ascending highs and lows. However, a critical level of around 0.4670 USD emerged as a decisive point, where the sentiment shifted from bullish to bearish. This level's repeated testing highlights its role as a crucial psychological and technical barrier.
Change of Character (CHoCH): The chart highlights a significant "Change of Character" moment, labeled as "CHoCH". This event signifies when the price forcefully broke below-established support levels, marking a clear transition of control from buyers to sellers.
Formation of a Downward Channel: After experiencing the CHoCH, Algorand's price action subsequently formed a descending channel, marked by two parallel trendlines. This structure represents a bearish phase, characterized by the consistent formation of lower highs and lows, reflecting ongoing selling pressure.
Retesting Key Levels: The price has recently retested the level around 0.4667 USD, which it had broken through previously. Now serving as resistance, this level reminds the market of its former role as support. The inability to surpass this point, followed by a decline, solidifies the current bearish sentiment within the channel.
Current Market Dynamics: Post-test, the price has resumed its downward path, sticking closely to the upper boundary of the channel. This behavior indicates that sellers are still dominant, potentially guiding the price towards or even beyond the channel's lower boundary, depending on broader market dynamics.
Key Level Insight: An essential level to watch is approximately 0.4703 USD, the 4-hour RSI high, acting as a significant resistance during recent price actions. Additionally, the 4-hour "closed" low at 0.3858 USD and the "low" at 0.35 USD, which was a 50% retracement from the local top, along with some support around 0.4230 USD.
Future Market Outlook: Traders should stay alert for signs of either a continuation of the current downtrend or a potential breakout. A break above the channel's upper boundary could signal a shift back to bullish conditions, while a move below the lower boundary might indicate a deepening of the bearish trend. Notably, the RSI has reset and confirmed a new low, suggesting watching for a break from the established lower high or low structure.

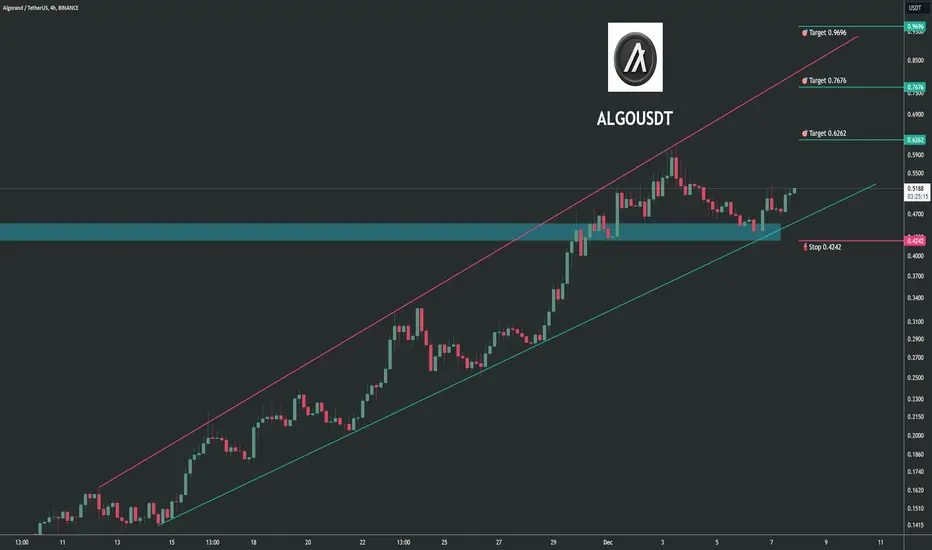
Trading opportunity for ALGOUSDTBased on technical factors there is a Buy position in :
📊 ALGOUSDT
🔵 Buy Now
🪫Stop loss 0.4242
🔋Target 1 0.6262
🔋Target 2 0.7676
🔋Target 3 0.9696
💸RISK : 1%
We hope it is profitable for you ❤️
Please support our activity with your likes👍 and comments📝
Algorand Nears $0.45 Resistance: Breakout Targets $0.70 Algorand (ALGO) is experiencing a significant upward trend, with a 25% surge in its price over the past 24 hours. However, resistance levels around $0.45 and beyond may need to be breached for ALGO to maintain its bullish trajectory
Waiting to test the key resistance at $0.45, a breakout above this level could confirm entry opportunities. Targeting the resistance zone around $0.70.

Algorand almost already to full invh&s breakout targetThe golden cross strikes again with an immediate blast off in algorand price as it is already getting very close to hitting the full inverse head and shoulder breakout target here. Zooming in here we ca more clearly see how the golden cross coincided with this blast off: *not financial advice*

Goldencross Once Again Having Immediate Impact;On Algo This TimeSo far my hypothesis that the golden cross responds immediately in the parabolic phase of the bull run is continuing to be proven correct as we see it happening again here now with algorand. Sending price already skyrocketing almost to the full inverse head and shoulders breakout target at .5050 *not financial advice*

ALGOUSDT (Algorand) Updated till 29-11-24ALGOUSDT (Algorand) Daily timeframe range. its working like absolute beast here. with this volume outperforming many alts out there. pin point close to break 0.4562. a clean close above can push it to 0.6156 and beyond. recent support at 0.3328.

ALGO | RoadmapHere I give the possible levels that may occur in case of a dump.
If there is no dump and the order flow continues in a positive direction, the highest level you can enter is the green box. It would be wise to risk a total of 2R, evenly distributed across the three areas.
I don't overcomplicate things and add a ton of dirty crap to my charts, but you can check out the success of my analysis below.
I approach trading with confidence backed by experience and past success in identifying high-probability setups.
While I don’t claim to be the best, my track record speaks for itself, and I strive to let my analysis and results do the talking. Watch these levels closely—markets can confirm what charts already whisper. Let’s see how this plays out together.
My Previous Ideas
DOGEUSDT.P | 4 Reward for 1 Risk much more if you hold it.
RENDERUSDT.P | HTF Accuracy
ETHUSDT.P | Accurate Buyer Zone Identification | High Risk Reward if you hold it.
BNBUSDT.P | Accurate Buyer Zone Identification | High Risk Reward if you hold it.
Bitcoin Dominance | Great Characteristic Detection and Accurate Analysis

Algo strong possibility of continuation sooner than expectedStop loss: Any M15 close below the entry candle at 0.2833

ALGOUSD Macro BreakoutMacro Breakout, with long time frames taking over. I'm pretty bullish, and Algrand's tech is some of the best out there! If we get a week closing .33, that's confirmation on the upside.
