$ALGO 1H EMAs crossing + new channel drawnupdate from entry earlier
testing this chart channel
could see upside imo
Algorand

ALGOUSDT S&R and TrendlinesALGOUSDT current support and resistance areas and trend lines. Looks like it is in uptrend channel on a daily chart.

Algorand Cup & Handle (Monthly Chart)Check out the 5 Minute Chart for a more detailed view. But the Handle on the Monthly chart is looking extremely bullish overall which make this a good area to load up and scalp a profit on the anticipated breakout to the upside of the Handle. Question is will the ceiling become the floor or will it rally and then retrace the breakout level...?

Algorand (Sideways Trading)Algorand is stuck in a sideways trading pattern (orange rectangle) after forming a large bull flag pattern (blue triangle), which formed after a rise of 187%.
Support at $1.70, which is also the retracement line 78% (if fib. was started from $1.56).
expected touch on the bottom of the orange rectangle, with price breaking out of the sideways trading unknown.
Most likely scenario is a downtrend, followed by the relative strength index hitting the 30% marker, allowing an upward breaking after.
Possibly touch to $1.70, with resistance at $1.93-$2.00.
Ceiling at $2.00 (high level of resistance).
Floor at $1.50 (high level of support).

ALGO Looks Ready I don't know if ALGO will hold within this corridor or not, but I do know that ALGO is just getting started and is showing a ton of support signs. Currently, ALGO looks like it's forming a bullish pennant on the daily charts.

#Algorand : The Bull Run of Q4 (3X)Algorand : The Bull Run of Q4 (3X)
Target Price EoY: 4.5-6.5$
Resistance R: 2, 2.56(ATH)

ALGO fake breakoutALGO has given a fake break out signal over the last days, as stated in my previous idea this was a possibility, since markets never gives you what you want straight away.
Plan doesn't change, I'm adjusting the possible timeline for ALGO to remain in it's triangle while BTC will be consolidating.
I would see anything at or under 1.65$ to be a big buy opportunity going into the end of the year.
No panic, let the market do what he wants.

Algorand (ALGO) - October 27Hello?
Welcome, traders.
By "following", you can always get new information quickly.
Please also click "Like".
Have a nice day.
-------------------------------------
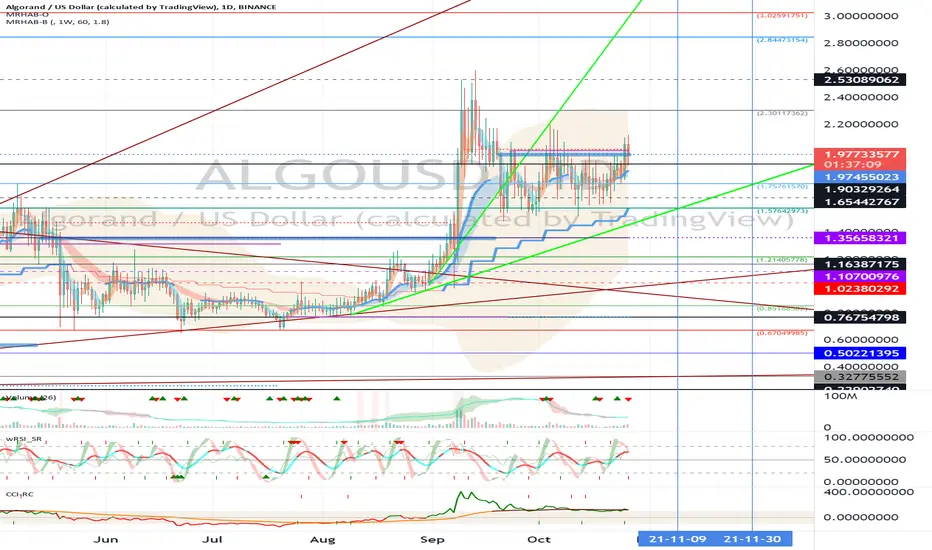
(ALGOUSD 1W Chart) - Mid-Long-Term Perspective
Above 0.76754798 point: uptrend expected to continue
(1D chart)
First resistance section: near point 2.30117362
Second resistance section: 2.84473154-3.02591751
Support section: 1.57642973-1.75761570
If the price holds above the 1.97455023 point, I would expect a move to break above the first resistance level.
If the price declines from the 1.65442767 point, it may touch the support zone, so trade cautiously.
A move from the support area could lead to a move near the 1.21405778 point, requiring a short-term Stop Loss.
However, if support is found near the 1.35658321 point, it is expected to rise to the support section, so countermeasures should be considered.
------------------------------------------
(ALGOBTC 1W Chart) - Mid- to long-term perspective
6469 Satoshi point or higher: Expected to create a new wave.
(1D chart)
First resistance section: near the 4309 Satoshi point
Second resistance section: near the 6469 Satoshi point
Support section: 2452 Satoshi-2886 Satoshi section
We need to see if we can find support in the support zone and move up to the first resistance zone.
In the medium to long term and in the short term, the 2886 Satoshi point or higher is considered to be a jumping-off section for rising.
------------------------------------------
We recommend that you trade with your average unit price.
This is because, if the price is below your average unit price, whether it is in an uptrend or in a downtrend, there is a high possibility that you will not be able to get a big profit due to the psychological burden.
The center of all trading starts with the average unit price at which you start trading.
If you ignore this, you may be trading in the wrong direction.
Therefore, it is important to find a way to lower the average unit price and adjust the proportion of the investment, ultimately allowing the funds corresponding to the profits to regenerate themselves.
------------------------------------------------------------ -----------------------------------------------------
** All indicators are lagging indicators.
Therefore, it is important to be aware that the indicator moves accordingly as price and volume move.
However, for the sake of convenience, we are talking in reverse for the interpretation of the indicator.
** The MRHAB-O and MRHAB-B indicators used in the chart are indicators of our channel that have not yet been released.
(Because it is not public, you can use this chart without any restrictions by sharing this chart and copying and pasting the indicators.)
** The wRSI_SR indicator is an indicator created by adding settings and options to the existing Stochastic RSI indicator.
Therefore, the interpretation is the same as the traditional Stochastic RSI indicator. (K, D line -> R, S line)
** The OBV indicator was re-created by applying a formula to the DepthHouse Trading indicator, an indicator disclosed by oh92. (Thanks for this.)
** Support or resistance is based on the closing price of the 1D chart.
** All descriptions are for reference only and do not guarantee a profit or loss in investment.
(Short-term Stop Loss can be said to be a point where profit and loss can be preserved or additional entry through split trading. It is a short-term investment perspective.)
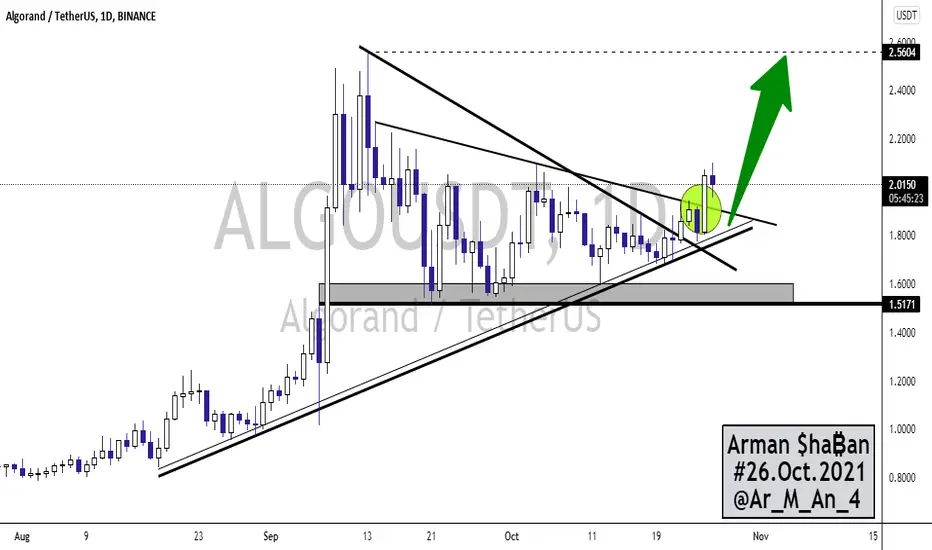
₿ ALGOUSDT 1D ₿ : 26.Oct.2021This analysis is a check of the chart in a Daily time frame and everything is clear on the chart and does not need additional explanation ... However, if you have any questions, feel free to ask .
⚠️ This Analysis will be updated ...
👤 Arman Shaban : @Ar_M_An_4
📅 26.Oct.2021
⚠️(DYOR)
Algo Chart Analysis #ALGOUSDT 4H Chart SIGNAL by CryptolernersBD
♻️ HEY, Guy's. Algo Creating A Triangle Chart Pattern. Now We Need To Wait For Breakout. Algo Currently Above The Previous All Time High. Keep It In Your Watch List. We Will Buy If Price Close Above The Trend Line Resistance & Also Above $1.86. And Our Stop-Loss Will Be 4H Candle Closing Below $1.70.
SO WAIT FOR BREAKOUT....✅
1D Chart...


ALGO/USDT, time to make decisionBroke the descending channel
Bat and bat
Wedge and consolidation
In this week, we should have an eye on Algorand and project on it.

CUDOS crypto hiddden gem💎 💎 THIS BULL MARKET 1000%hidden gem GREAT ENTRY POINT. price demand zone dont WAIT until IT happens

Algorand (Breakout)Algorand is breaking out and testing the $2.00 price target.
Taking a copied bars pattern from October 23rd to October 25th (yellow bars) Algo could see $2.05 to $2.10 by October 27th. Trading is expected to stay within the yellow parallel lines. Large green line is overhead resistance. R.S.I Divergence has broken out of the parallel lines (orange lines). The relative strength index is expected to touch the upper orange lines (at least) with a possible touch on the lower orange line-possibly touching down to the 30% marker before another breakout.
resistance at $1.93 and $2.00.

ALGORAND - Price Could AcceleratePrice has broken out of the wedge as you can see on the chart. This means volatility and velocity. Price could rise faster now.
Support is now technically at 1,78 and next resistance is all the way up to 3,4$
News: Sequoia Games Brings Augmented Reality to Board Games Using Algorand Blockchain
The Catan-style game combines a physical board with NFT-backed characters that can be bought and sold between players on Algorand’s blockchain www.coindesk.com
Sequoia Games has tapped Algorand as the digital ledger behind its new Flex NBA product, a National Basketball Association-licensed board game that uses augmented reality.
The company said Tuesday that Flex NBA is a turn-based board game with similar mechanics to Catan that’s played with a physical board in combination with a mobile app.
the FXPROFESSOR

#ALGO , Time 1DBuy after retest of Trend 1 or after breakout of "1D" candlestick outside the Trendline.
Sell after retest of Trend 2 or after breakout of "1D" candlestick outside the Trendline.

MY NOT SO MINIMALIST ANALYSIS OF ALGORAND$ALGO
10.25.21
1931H +8 SINGAPORE
ALERT: About time for $ALGO to PUSH UPWARDS.
Disclaimer:
The findings of the following analysis are the sole opinions of the publisher of this idea and should not be taken as a piece of investment advice.
"FOLLOW THE WHITE RABBIT!"
HOW TO USE THIS MINIMALIST CHART
Created on a MONTHLY, WEEKLY & DAILY Analysis (The Dynamics of the Market.)
It is designed for SWING TRADES at the BOTTOM. I do not SHORT, though, you can still use it.
The LARGE BOXES (Tops and Bottoms) are MAJOR pivot points that will occur, while the SMALL BOXES (Tops and Bottoms) are MINOR pivot points.
These can be entries to a BUY/ SELL POSITION, EXIT/PARTIAL EXIT/TOP-UP AREAS
and even if you wish to hold longer for a CONSERVATIVE MAXIMUM TARGET AREA OF VALUE (Depending on, if the conditions are right.)
At times I include WAY BEYOND PARABOLIC Price TARGETS.
Watch out for your Volume, Chart Patterns, Candlestick Math, Price Action, and especially your Fibs, Market Dynamics, and trading psychology.
The above-mentioned is sufficient enough as a major deciding factor for this MINIMALIST CHART.
Note: That This CHART is best used without indicators. (As we all know, they lag.)

ALGO/BUSD Symmetrical Triangle Breakout Target Prices (UPDATE 1)TP Targets of SOL/BUSD following a breakout from the symmetrical triangle pattern. Update on my initial ALGO/BUSD idea.

Algorand ($ALGO) New FIBAlgorand ($ALGO) New FIB: If $ALGO can close and confirm in the FIB above, $ALGO will start its BULL-run @ $1.97 Currently $ALGO trading sideways, BB squeezing tight, RSI in the Goldilocks zone and MACD BULL-ish cross over. $ALGO looks primed to 🚀🚀🚀

Confirmed #Algorand goes longAfter weeks of consolidation and a confirmation of
a breakout on the top trend line in a symmetrical
triangle... Along with upwards momentum shown
below on the MACD I believe the next week will be
very bullish for $ALGO. Even a retest of 2.50$ ATH
price level is within reason.
Additionally "Governance" on Algorand's blockchain
currently has 1.88 billion $ALGO essentially being
locked away from the circulating supply for high
rewards until the New Year.
If $BTC stays the course or even falls a bit in price
$AGLO will be making some drastic moves. First
profit level I anticipate is 2.10 then a sharp move
upwards to 2.40 followed by a retest of the 2.5ATH
Getting in under 2$ mark will make for some nice
profits in the short term and in the long term the
staking and governance rewards will have many
traders coming back as return customers on this
blue chip alt.
-Cheers!

Algorand (Bullish Signals)Algorand is showing several Bullish signals, with an impending uptrend to $2.00 and beyond.
The R.S.I is showing divergence !
Charts patterns: falling wedge (blue triangle) with a rounding bottom (red arched line). Rounding top (yellow arched line)
resistance at $1.88-$1.93.
*Price followed the copied Bars pattern (purple bars) from previous prediction perfectly. *
ceiling at $2.00. minimal resistance above $2.06.
related Algo published ideas linked below:
price target of $3.00 for larger bull flag pattern (see previous published ideas). This flag has some sideways trading, but is still valid.

TRIAL AND ERROR: ALGOUSDT*not a financial advice. please do your own research. a powerful catalyst can change a trend.
bullish up to TP1, BEARISH after D.

Algorand is close to new ATH: Price discovery phase as Total 2Massive Cup and Handle on Total 2 Marketcap excluding Bitcoin. Algorand is right there. Watch out for Bitcoin dominance around 47%, best time to buy upon rejection from there.
