ALGO GOES DOWN MY FIRST IDEAAlgo is in a huge bearish since September and too many times it tried to break the resistance but it couldn't go so far. Yesterday with BTC ATH it also climbed to huge amount but still it is under our resistance.
For short positions:
Stop: 1.8
Sell: 1.69
Algorand

Algo to 3$one of the Ethereum competitors we are looking at with a good project and still undervalued in my opinion we are looking her for an x2 or x3 on investments
we might see the same scenario that happened to Solana with this baby boy
------------------
Best Regards, iSmashProfit™

Symmetrical Triangle on ALGO/USD DailyOn the daily chart is a symmetrical triangle forming which should lead to a nice up move if price breaks through.

ALGO try to break out triangle#ALGOUSDT
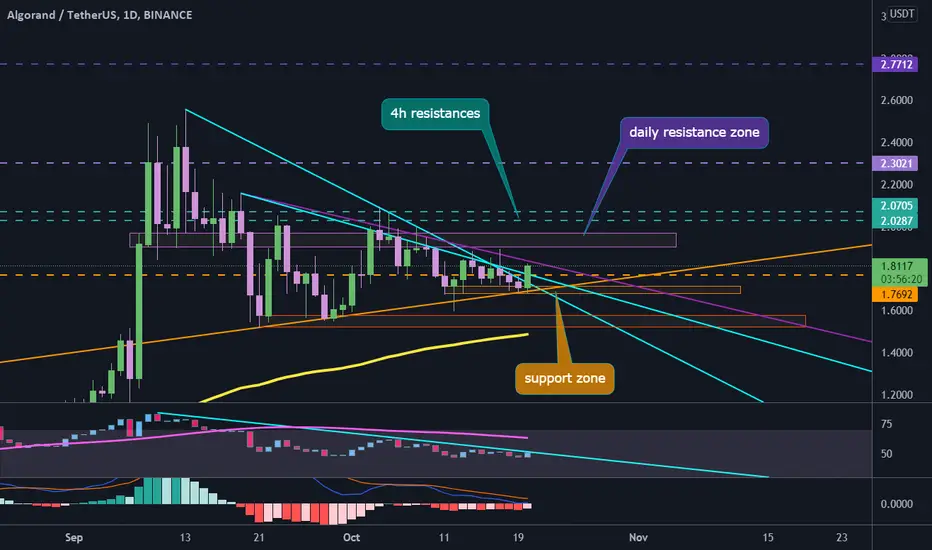
$ALGO is trading above 3 major resistances, if daily candle close above $1.7692, it is a bullish sign and will confirm an uptrend. then price head up toward daily resistance zone and I think it will pass $2. target of broken triangle is around $2.3.

It's almost $ALGO time$ALGO has been consolidating for weeks now, since the mid-september move after hitting 2.50.
The 1.55 area has shown strong support after being tested multiple times in late September. Each time on less and less volume, indicating that selling pressure is waning.
Price is currently bouncing off its 50EMA and the bollinger bands are tightening. I still think we could see one more retest of that 1.55 area but if price breaks its downtrend line then my gut might be wrong.
RSI is peaking above its short term downtrend line and the MACD is a few days away from a crossover.
Keep your eye on this one.


Algorand (Breakout Update)!Update from previous published ideas for Algo's breakout.
Algorand is breaking out of a large descending wedge (blue triangle), tracking along a rounding bottom (red arching line) with a price target of $2.00-$2.20 by 10-20-2021 to 10-23-2021. Expect some sideways trading, which could cause the deadline to be extended by a few days possibly a week.
copied bars pattern-purple bars can be seen with a price target of $2.00. Off-centered, but the basic scenario a possibility still; AB-CD/Measured move up pattern.
resistance at $1.75 and $1.90-$2.00...ceiling at $2.00. Trading within the orange rectangle is what is most important, there is a possibility that Algo can breakout of the rounding bottom and/or copied bars pattern...as recent volatility is causing the entire Crypto Market experience additional sideways trading or sporadic downtrends before their trend change to the upside (new highs).
related in-depth published Algorand ideas linked below:

Algorand (ALGO) - Algorand's had a bad day. Places to buyAlgorand suffered after a recent breakout attempt, where an old daily Dynamic support flipped to resistance and gave us a little local double top. After this those who bought the breakout no doubt have dumped it and caused it to drop to the current lower dynamic support (green) which it is currently testing. The technicals look bad. But wont be confirmed until this 4H closes. Depending on how much you like the ALGO project, you could watch this current 4H candle and try accumulate at this dynamic support if it looks like it will close above price support and OBV key level. From here we may see a recovery. The alternative is this support is broken and we head back down to the 1.5 range. Buyers have been making slightly higher swing lows each time, but they have been failing to show strength.
Note the OBV signaling a strong sell off after attempted break. We would want it to hold that key level
Watch and act at this level, risking the recovery. OR wait until it returns to the 1.6-1.5 level and look for some signs of renewal there

Algorand (Breakout)!!!Algorand is breaking out of a symmetrical triangle (orange triangle), tracking along a rounding bottom (yellow arching line) with a price target of $2.20; by
several possible scenarios can been seen (copied bars pattern-green and pink bars). The green bars scenario seems more likely, with a price target around $2.00; by 10-20-2021 to 10-23-2021.
resistance at $1.90-$2.00...ceiling at $2.00.
related in-depth published Algorand ideas linked below:

good entry position for ALGOUSDTif price can break out dynamic and static resistance line the ALGOUSDT can touch the new ATH

ALGO, MY PREDICTED SCENARIO...Hello, my friends...
This content is just a prediction about the Algorand possible action. The entry point is shown on the chart *but after the retest.
Good luck >_-

ALGOUSDT Daily TimeframeSNIPER STRATEGY (new version)
It works ALMOST ON ANY CHART.
It produces Weak, Medium and Strong signals based on consisting elements.
NOT ALL TARGETS CAN BE ACHIEVED, let's make that clear.
TARGETS OR ENTRY PRICES ARE STRONG SUPPORT AND RESISTANCE LEVELS SO THEY CAN ACT LIKE PIVOT POINTS AND REVERSE THE WAVE (or act like a mirror that can reflects light) BASED ON STRENGTH OF THAT LEVEL.
ENTRY PRICE BLACK COLOR
MOST PROBABLE SCENARIOS TARGETS GREEN COLOR
LEAST PROBABLE SCENARIOS TARGETS RED COLOR
TARGETS ARE NOT EXACT NUMBERS THEY ARE MORE LIKE A ZONE.
DO NOT USE THIS STROTEGY FOR LEVERAGED TRADING.
It will not give you the whole wave like any other strategy out there but it will give you a huge part of the wave.
The BEST TIMEFRAMES for this strategy are Daily, Weekly and Monthly however it can work on any timeframe.
Consider those points and you will have a huge advantage in the market.
There is a lot more about this strategy.
It can predict possible target and also give you almost exact buy or sell time on the spot.
I am developing it even more so stay tuned and start to follow me for more signals and forecasts.
START BELIEVING AND GOOD LUCK
HADIMOZAYAN

Algo Update - ABCDE Algo is looking pretty good. I think we have one more drop to the 1.60-1.65 area before we head up towards 2.20. This is just a potential play that I am currently keeping my eye on.
Thanks for viewing my post!

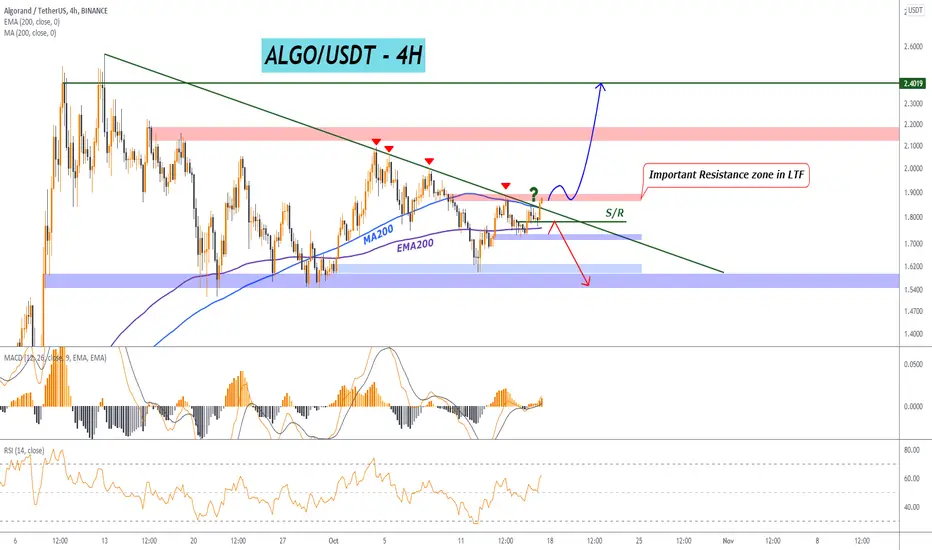
ALGO/USDT : Breaking out the trendline ! BINANCE:ALGOUSDT
Hello everyone 😃
Before we start to discuss, I would be glad if your share your opinion on this post and hit the like button if you enjoyed it !
#ALGO is breaking above the bearish trendline here.
📚 There are some of the bullish factors for it :
- There's a S/R line which has been broken and it has so much impact on #ALGO's master candle after a retest on it.
- Breaking above the current trendline will lead the pair to the recent high which is also.
- This the 5th attempt to breakout and based on 5th rule, Bulls have the opportunity to hold above the trendline.
- EMA200 is supporting the movement and also it's standing to the support zone on current chart's time-frame.
- MACD had a bullish crossover and now it's breaking above the neutral line; Also there's a buy pressure located on MACD.
- RSI is standing at 62 currently which is suggesting the bulls upper hand on current level.
- #ALGO is breaking above the MA200 currently
📌 You can take a ride after a hold above the mentioned resistance zone.
🔴 Any close below the support zone will invalidate the bullish bias.
Attention: this isn't financial advice we are just trying to help people on their own vision.
Have a good day!
@Helical_Trades
Potential Nice Trade Set UpIf algo breaks out of the triangle to the downside we could see a strong bounce off support. 1.65 is a pretty good entry and target would be 2.15. All dependent on Btc.

ALGOUSDT 4hALGO currency is in a one-hour time frame, which can also break upwards. There is also an RD + in the RSI, which could be a signal for the currency to grow. The targets of this currency are 2.02 and 2.23, respectively.

Algo Geo is primo! Chart By CyptoKnee Quickie! Elliott Wave could be a couple things, but mostly corrective MO ATM, just one idea on there now. Somethings need to be invalidated and a break of the range would assist in getting a better Idea. But the GEO has been playing great! Going to be watching these with alarms set to see which way it decides.

Bearish Divergence Weekly Time FrameAlgo formed bearish divergence on the weekly chart could see a drop back down to the support of this channel before heading up to try all time high. Still long term bullish on Algo just think we could see a drop sometime soon.

OPUL and Fibonacci ExtensionsOpul is a music and creator focused token. I am bullish long term on the project overall due to being on the Algorand network, the connection with Yieldly, and that artists will always find the best ways to earn more!
Here are the fib extensions from highest high and lowest low as a framework for viewing larger zones.
Their website describes the project as - "Using our NFT Exchange anyone can own a piece of their favourite artist’s music copyright and buy valuable assets previously only available to industry insiders. Musicians can raise money by freely selling their music copyright as NFTs, while fans can support and form closer connections to their idols by purchasing a real stake in their career.

$ALGO buy set-upsBetween the two scenarios, A & B, I think scenario A is more likely so I'm looking for a breakout above this downtrend line.
Scenario A looks likely because of an MACD cross, strong bounce off the lower bound of the channel, showing strength. Looks like it is about to test RSI at 50.
With ETH fees going through the roof and ALGO being put to the test with more and more transactions per second while maintaining fees below $.01 I think ALGO will flip ETH eventually unless ETH fixes the gas fee problem or ALGO can't maintain its low fees while scaling.
If scenario B happens, I will be looking to buy more once it bounces off the lower bound of the channel.
Long ALGO. Strong support at 1.5538
4% for staking your Algorand on Coinbase. Nice to own an appreciating asset that also has interest.

ALGOUSD LONGALGO is an interesting asset to trade on. It has broken many resistance and seen sharp uptrends in recent times. In my chart, I have a forecast showing how ALGORAND will break the 2.1997 resistance in it's next bull.

Algorand (Sideways Trading)Algorand has been stuck in a sideways trading pattern for the past few days. Seeing a small breakout to the upside (and downside) on occasion, but never breaking below $1.54 (floor/support zone) and never going above $2.09 ($1.86-$2.00 resistance/ceiling.)
Algorand's Community Governance registration period end this Thursday (10-14-2021.) At the time of writing this Algo has:
57,067 Governors, with 751,415,874.696 Algo's committed to be locked up for the 3-month required timeframe.
The Pink rectangle on the R.S.I Chart is a high level of resistance for Algorand, and is sure to be either rejected at this level, or breakout from this level.
A rounding top formed (seen as the over head arching red line.) However, an even bigger rounding bottom can be seen (the arching blue line).
The overall Crypto market has seen the bull market continue, with wide speculation of an extended Bull Market (possibly till January of 2022 and/or beyond.)
Price target around $2.75 to $3.00 per Algo by October 28th through October 31st. With a possible delay till mid November.
related Algorand published ideas linked below:
