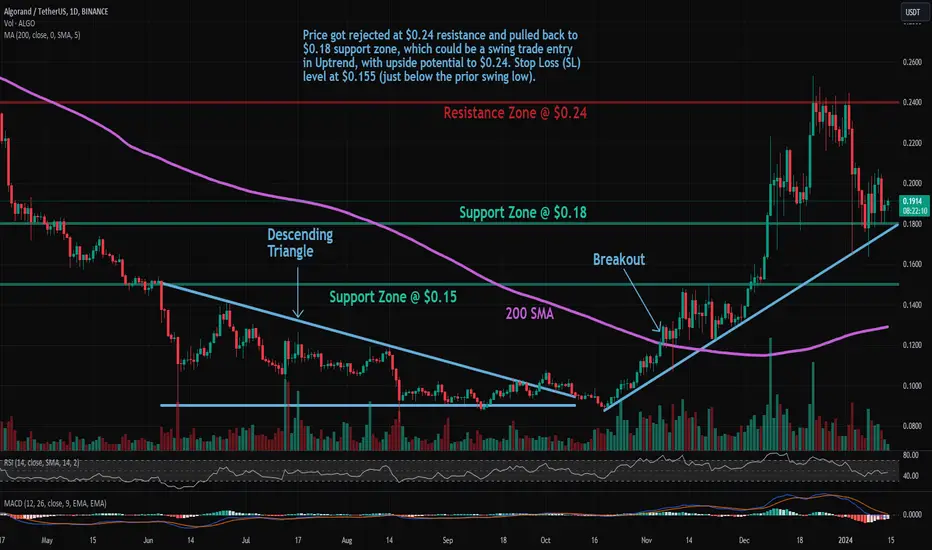
ALGO: Pullback in UptrendTrade setup : Price got rejected at $0.24 resistance and pulled back to $0.18 support zone, which could be a swing trade entry in Uptrend, with upside potential to $0.24. Stop Loss (SL) level at $0.155 (just below the prior swing low).
Trend : Neutral on Short- and Medium-Term basis and Uptrend on Long-Term basis.
Momentum is Mixed as MACD Line is below MACD Signal Line (Bearish) but RSI ~ 50 (Neutral). MACD Histogram bars are rising, which suggests that momentum could be nearing another upswing.
Support and Resistance : Nearest Support Zone is $0.18, then $0.15. The nearest Resistance Zone is $0.24, then $0.30.
Algorand
ALGO/USDT probability of bullish move from support? 👀🚀ALGO💎 Paradisers, focus on #ALGOUSDT, as it's currently exhibiting a trend that suggests a strong chance of a bullish continuation from its support zone.
💎 Amid recent market volatilities, #ALGORAND has seen a decline, but it now appears ready to recover from the support zone at $0.1650. Should #ALGO manage to maintain its momentum above this critical level, there's a substantial likelihood of it embarking on a bullish trajectory towards the significant resistance at $0.2861.
💎 In the dynamic and unpredictable crypto market, adaptability and responsiveness in our trading strategies are key. If #ALGO faces challenges in sustaining its position within this support zone, a reevaluation of our strategy may be necessary.
💎 In that event, our contingency plan, Plan B, would involve a focus on triggering a bullish movement from a deeper support level, identified at $0.1474. Monitoring this level is vital, as failing to hold above it could indicate a possible shift to a bearish trend in the #ALGO market. 🌴💰

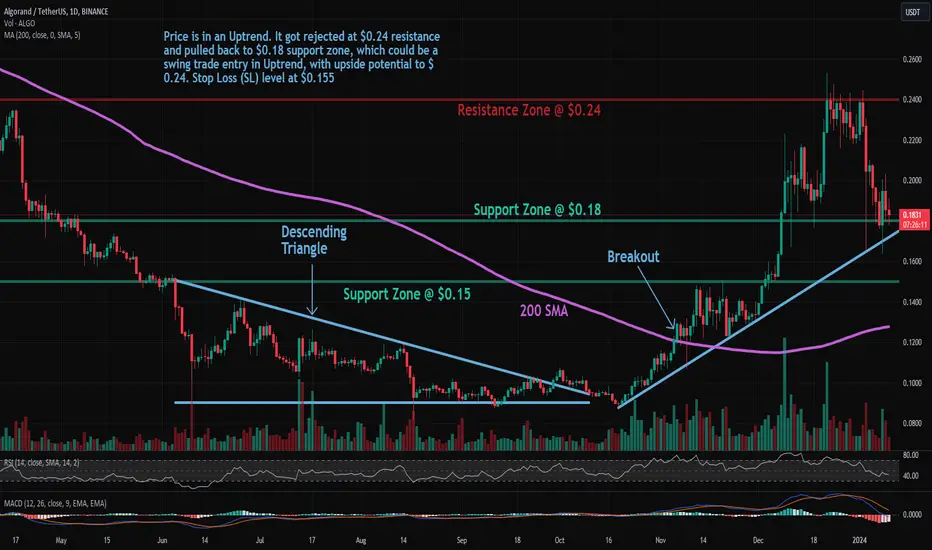
ALGO: Pullback in UptrendTrade setup : Price is in an Uptrend. It got rejected at $0.24 resistance and pulled back to $0.18 support zone, which could be a swing trade entry in Uptrend, with upside potential to $0.24. Stop Loss (SL) level at $0.155 (just below the prior swing low).
Trend : Downtrend on Short-Term basis and Uptrend on Medium- and Long-Term basis.
Momentum is Bearish but inflecting. MACD Line is below MACD Signal Line and RSI is below 45 but momentum may have bottomed since MACD Histogram bars are rising, which suggests that momentum could be nearing another upswing.
Support and Resistance : Nearest Support Zone is $0.18, then $0.15. The nearest Resistance Zone is $0.24, then $0.30.
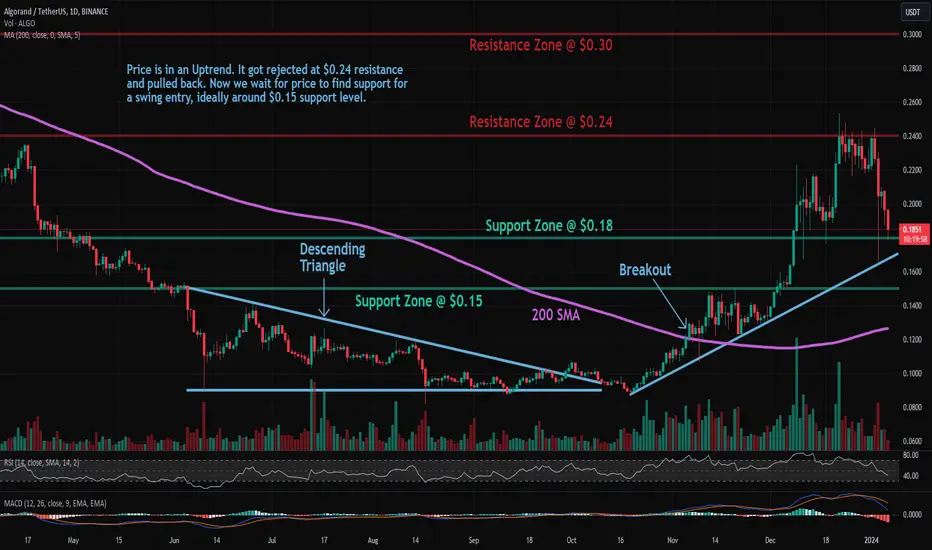
ALGO: Approaching SupportTrade setup : Price is in an Uptrend. It got rejected at $0.24 resistance and pulled back. Now we wait for price to find support for a swing entry, ideally around $0.15 support level. Previously, price broke above 200-day moving average, which confirmed a bullish trend reversal to an Uptrend.
Trend : Neutral on Short-Term basis and Uptrend on Medium- and Long-Term basis.
Momentum is Bearish (MACD Line is below MACD Signal Line, and RSI is below 45).
Support and Resistance : Nearest Support Zone is $0.18, then $0.15. The nearest Resistance Zone is $0.24, then $0.30.
Algorand up 22% this Fall 🍂Down since Binance Listing 2 Consecutive Bullish Months in a row suggest buyers stepping in from the Lows created during Covid Crash at .0976. This crypto offers great Risk/reward back to All time highs at 3$. Catching 1/10 of that move would be great RR

Back to breakeven (ALGO)❤️❤️Thanks for boosting 🚀 and supporting us!
📈for againe buy price to back to breakeven.
📊 (Entry) : 0.2136
🔴 Stop Loss : 0.2001
🎯 Take Profit : 0.2231-0.2335-0.2423
🔗 For more communication with us, In the footnote and send a message in TradingView.
👨🎓 Experience and Education: Our trading team has five years of experience in financial markets, especially cryptocurrencies.

Classic Break For ALGOIs ALGO finally looking to break to the upside for the first time in 2024? its looking promising! A critical level for ALGO is around $.30 and I think we might be making a slow journey in that direction.
Trading the breakout pull back continuation pattern to confirm direction and volume.

ALGO: Approaching ResistanceTrade setup : Price is in an Uptrend and approaching $0.24 resistance. If it breaks above that, it could revisit $0.30 next. Previously, price broke above 200-day moving average, which confirmed a bullish trend reversal to an Uptrend.
Trend : Uptrend across all time horizons (Short- Medium- and Long-Term).
Momentum is Mixed as MACD Line is below MACD Signal Line (Bearish) but RSI > 55 (Bullish).
Support and Resistance : Nearest Support Zone is $0.20 (previous resistance), then $0.18. The nearest Resistance Zone is $0.24, then $0.30.

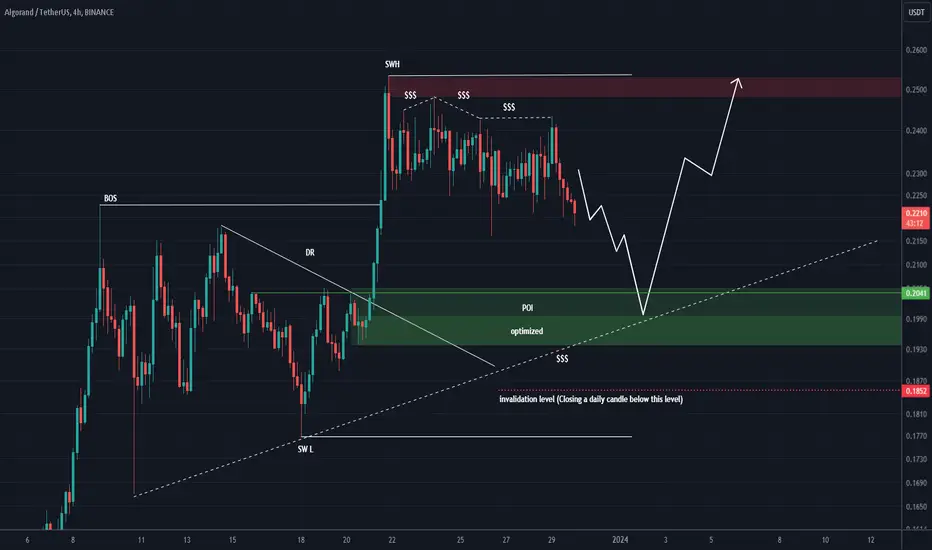
ALGO is near the support rangeIn higher time frames we see a strong bullish trend.
Now the price is slowly approaching the POI range. This range initiated the move that caused the previous ceiling BOS, so it is important to us.
By maintaining the green range, it can collect the liquidity pool that I specified above with the $$$ sign.
For risk management, please don't forget stop loss and capital management
Comment if you have any questions
Thank You
ALGO: Approaching ResistanceTrade setup : Price is in an Uptrend and approaching $0.24 resistance. If it breaks above that, it could revisit $0.30 next. Previously, price broke above 200-day moving average, which confirmed a bullish trend reversal to an Uptrend.
Trend : Uptrend across all time horizons (Short- Medium- and Long-Term).
Momentum is Bullish ( MACD Line is above MACD Signal Line and RSI is above 55).
Support and Resistance : Nearest Support Zone is $0.20 (previous resistance), then $0.18. The nearest Resistance Zone is $0.24, then $0.30.

Algo lookin promising. 0.28 and 0.4 are the huge resistance zones. So that means most likely to get rejection at those lines, and what is more interesting is we could see H&S pattern either way.


ALGO: Approaching ResistanceTrade setup: Price is in an Uptrend and approaching $0.24 resistance. If it breaks above that, it could revisit $0.30 next. Previously, price broke above 200-day moving average, which confirmed a bullish trend reversal to an Uptrend.
Trend: Uptrend across all time horizons (Short- Medium- and Long-Term).
Momentum is Bullish ( MACD Line is above MACD Signal Line and RSI is above 55).
Support and Resistance Nearest Support Zone is $0.20 (previous resistance), then $0.18. The nearest Resistance Zone is $0.24, then $0.30.

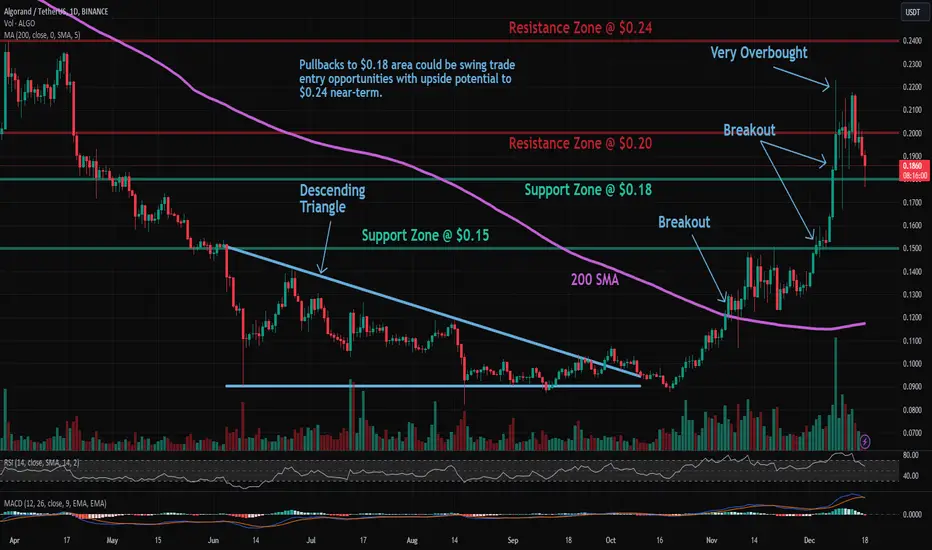
ALGO: Approaching ResistanceTrade setup : Price got overbought (RSI > 70) after breaking above $0.20 and pulled back on some profit taking. Pullbacks to $0.18 area could be swing trade entry opportunities with upside potential to $0.24 near-term. Previously, price broke above 200-day moving average, which confirmed a bullish trend reversal to an Uptrend.
Trend : Uptrend across all time horizons (Short- Medium- and Long-Term).
Momentum is Bullish but inflecting. MACD Line is above MACD Signal Line and RSI is above 55 but momentum may have peaked since MACD Histogram bars are declining, which suggests that momentum is weakening.
Support and Resistance : Nearest Support Zone is $0.18 (previous resistance), then $0.15. The nearest Resistance Zone is $0.20, then $0.24.

ALGORAND is About to Explode!🚀 ALGO/USDT Potential Breakout Signal:
After a careful analysis of ALGO/USDT price action, it appears that a significant move is on the horizon. ALGO has recently broken out of a Falling Wedge pattern, and all signs point to an imminent bullish surge. The key price levels to watch closely are 0.102 and 0.108.
🎯 Mid-term Price Targets:
Target 1: 0.116
Target 2: 0.137
Target 3: 0.159
Target 4: 0.181
🛡️ Risk Management:
Consider initiating small spot buys as the price action develops. If the price experiences a temporary drop, consider Dollar-Cost Averaging (DCA) to achieve an average buying level. It's advisable to set a stop-loss just below 0.090 to manage risk and protect against potential pullbacks from this support level.
Stay tuned for updates as this promising move unfolds! 📈

ALGO: Approaching ResistanceTrade setup : After getting rejected at $0.15 resistance a few times in November, price has finally broken above it to signal continuation of uptrend with upside potential to $0.24. However, price is now overbought (RSI > 70), hence, near-term, we’re likely to see it pause here on some profit taking.
Pullbacks to $0.18 area could be swing trade entry opportunities. Previously, price broke above above 200-day moving average, which confirmed a bullish trend reversal to an Uptrend.
Trend : Uptrend across all time horizons (Short- Medium- and Long-Term).
Momentum is Bullish but inflecting. MACD Line is above MACD Signal Line and RSI is above 55 but momentum may have peaked since MACD Histogram bars are declining, which suggests that momentum is weakening.
Support and Resistance : Nearest Support Zone is $0.18 (previous resistance), then $0.15. The nearest Resistance Zone is $0.20, then $0.24.

ALGO's Parabolic Growth: Cup and Handle Masterpiece! 🚀Algorand (ALGO) emerges as a distinguished performer, crafting a masterpiece in the form of a Cup and Handle pattern. With a breakthrough of a crucial trendline, ALGO is now shaping the handle of this pattern, signaling potential for a resolute continuation of its upward journey.
Chart Analysis: Crafting the Cup and Handle Symphony
Cup and Handle Formation:
ALGO intricately weaves the narrative of a Cup and Handle pattern, a bullish continuation formation.
The cup, formed by a gradual rounding bottom, transitions into the handle—a consolidation before the potential surge.
Trendline Breakthrough:
ALGO marks a significant breakthrough, piercing through a vital trendline.
This breakout serves as a precursor to the formation of the handle, setting the stage for a potential strong upward movement.
Anticipated Scenarios: A Harmonious Surge
Crafting the Handle:
ALGO is currently in the process of forming the handle, a consolidation phase within the Cup and Handle pattern.
This consolidation is essential for gathering momentum before the next phase of the bullish journey.
Bullish Continuation:
The completion of the handle sets the scene for a potential bullish continuation.
Traders and investors eagerly anticipate the symphony of growth, expecting ALGO to resume its ascent.
Strategic Approaches: Navigating ALGO's Crescendo
Strategic Entry Points:
Traders may strategically position themselves during the handle formation, ensuring entry at optimal points within the consolidation.
Timing is crucial, and vigilant entry strategies could enhance the potential for capitalizing on the anticipated surge.
Monitoring the Handle Dynamics:
Continuous monitoring of ALGO's price action within the handle is imperative.
Breakout confirmation from the handle would be a key signal for traders to act on the anticipated bullish continuation.
Conclusion: ALGO's Symphony Continues to Unfold
As Algorand weaves the harmonious notes of its Cup and Handle symphony, traders and enthusiasts alike await the completion of the handle—a prelude to a potential surge in price. The stage is set for ALGO to continue its journey, composing a resounding melody of growth in the crypto realm.
🚀 Crafting the Cup and Handle Symphony | 🎻 The Crucial Trendline Breakthrough | 🌌 Navigating ALGO's Crescendo
❗See related ideas below❗
Share your insights on ALGO's chart dynamics and join the conversation about the potential breakout and its implications. 💚🚀💚

ALGO Scalp setupI am waiting for Algorand to broke up the short-term resistance to enter for a scalp long till 0.21. It looks strong enough and momentum is good

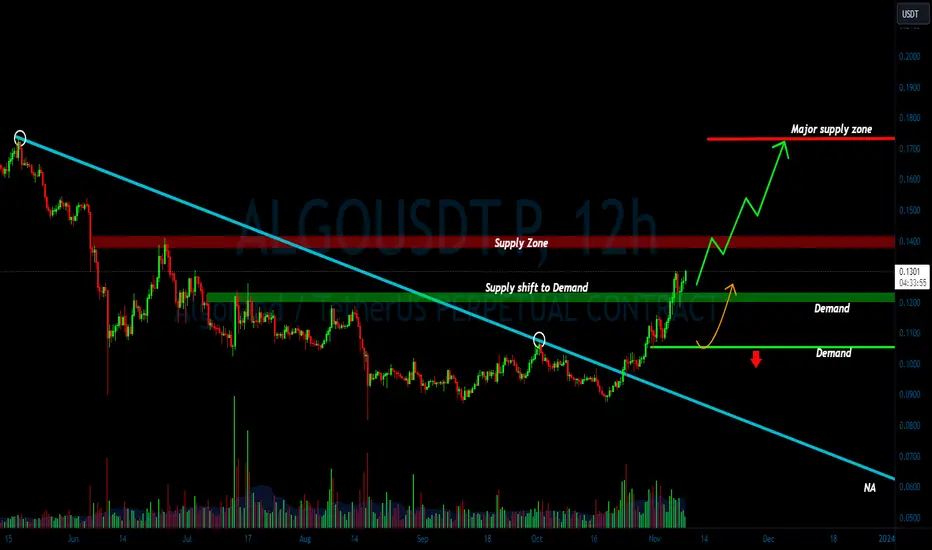
ALGOUSDT upward momentum? 👀 🚀 ALGO Today analysis💎 Paradisers, prepare for a promising opportunity with ALGOUSDT as it showcases an impressive trend, currently positioned in a demand zone, hinting at a heightened likelihood of a bullish trajectory.
💎 In recent developments, we've observed a shift where supply zones have transformed into demand zones. Currently, ALGOUSDT is nestled within such a demand zone, and the prospects of it breaching the .1382 supply zone are quite favorable.
💎 Should this supply zone be successfully surpassed, we could see a move towards challenging higher supply levels, with the increased volume lending credence to a bullish outlook.
💎 On the flip side, should ALGOUSDT falter in its ascent, we might anticipate a bullish resurgence from the .1057 demand level. A dip below this could potentially lead to a notable bearish slide.
ALGO Tp BrokenWhat an amazing trade on Algorand! More than 30% gain on spot from my call and way more on leverage. It's now slowly coming down, but i am waiting for a good retrace to join in long again. Will keep you updated, 0.17 is an interesting zone

ALGO: Overbought at ResistanceAlgorand (ALGO) technical analysis:
Trade setup : After getting rejected at $0.15 resistance a few times in November, price has finally broken above it to signal continuation of uptrend with upside potential to $0.24. However, price is now very overbought (RSI ~ 80!), hence, near-term, we’re likely to see it pause here on some profit taking.
Pullbacks to $0.18 area could be swing trade entry opportunities. Previously, price broke above above 200-day moving average, which confirmed a bullish trend reversal to an Uptrend.
Trend : Uptrend across all time horizons (Short- Medium- and Long-Term).
Momentum is Bullish but extremely overbought. (MACD Line is above MACD Signal Line). RSI is bullish (> 55) but extremely overbought (> 80) which could imply that price could briefly pause or pull back if it reaches Resistance.
Support and Resistance : Nearest Support Zone is $0.15 (previous resistance), then $0.11. The nearest Resistance Zone is $0.18, which it broke, then $0.24.

ALGO/USDT Break the key supply area. Bullish Momentum for ALGO ?💎 ALGO has been a standout in the market, recently achieving a notable breakthrough in a key supply area. It's now undergoing a retesting phase in the Lower Time Frame (LTF), setting the stage for potential upward movement. If successful post-retest, ALGO probability may move towards our targeted strong resistance area.
💎 However, if ALGO returns to the demand area, which previously acted as a supply zone, it will be crucial for it to demonstrate a strong bounce. This is necessary to mitigate the risk of a false breakout.
💎Failure to rebound and closure below the demand level could signal a false breakout, potentially reversing ALGO's trajectory. In such a scenario, ALGO might shift towards a downward trend, moving towards the next lower target, the support area.
