ALGO: Channel Down BreakoutTrade setup : Trends are mixed to down. Price has broken out of a Channel Down pattern but it’s now retesting that breakout level. If successful, price could revisit $0.22. Stop Loss (SL) level at $0.175.
Pattern : Price was trading in a Channel Down pattern. With complete patterns (i.e. a breakout) – initiate a trade when the price breaks through the channel’s trendlines, either on the upper or lower side. When this happens, the price can move rapidly in the direction of that breakout. Learn to trade chart patterns in Lesson 8.
Trend : Downtrend across all time horizons (Short- Medium- and Long-Term).
Momentum is Bearish (MACD Line is below MACD Signal Line, and RSI is below 45).
Support and Resistance : Nearest Support Zone is $0.15, then $0.12. The nearest Resistance Zone is $0.20, then $0.25 and $0.30.
Algorandusdt

ALGO Stuck in the rangeALGORAND is stuck in this range after a weak break abive the main bearish trendline. Range can be good, because usually is an accumulation zone. We just need to wait for a break above this range to see a pump till the local top that is the first resistance zone

ALGO: Channel Down BreakoutTrade setup : Trends are mixed to down. Price has broken out of a Channel Down pattern but it’s now retesting that breakout level. If successful, price could revisit $0.22. Stop Loss (SL) level at $0.175.
Pattern : Price was trading in a Channel Down pattern. With complete patterns (i.e. a breakout) – initiate a trade when the price breaks through the channel’s trendlines, either on the upper or lower side. When this happens, the price can move rapidly in the direction of that breakout. Learn to trade chart patterns in Lesson 8.
Trend : Downtrend across all time horizons (Short- Medium- and Long-Term).
Momentum is Mixed as MACD Line is above MACD Signal Line (Bullish) but RSI < 45 (Bearish). MACD Histogram bars are declining, which suggests that momentum is weakening.
Support and Resistance : Nearest Support Zone is $0.15, then $0.12. The nearest Resistance Zone is $0.20, then $0.25 and $0.30.

ALGO: Channel Down BreakoutTrade setup : Trends are mixed to down. Price has broken out of a Channel Down pattern and back above that 200-day MA to signal trend reversal to Uptrend. Near-term upside potential to $0.22. Stop Loss (SL) level at $0.175.
Pattern : Price was trading in a Channel Down pattern. With complete patterns (i.e. a breakout) – initiate a trade when the price breaks through the channel’s trendlines, either on the upper or lower side. When this happens, the price can move rapidly in the direction of that breakout. Learn to trade chart patterns in Lesson 8.
Trend : Downtrend on Medium-Term basis and Uptrend on Short- and Long-Term basis.
Momentum is Mixed as MACD Line is above MACD Signal Line (Bullish) but RSI ~ 50 (Neutral).
Support and Resistance : Nearest Support Zone is $0.15, then $0.12. The nearest Resistance Zone is $0.20, then $0.25 and $0.30.

ALGO: Channel Down PatternTrade setup : Trends are mixed to down. Following a failed breakout, price is back to trading within a Channel Down pattern. We wait for a breakout from the pattern and back above that 200-day MA to signal trend reversal to Uptrend again.
Pattern : Price is trading in a Channel Down pattern. With emerging patterns, traders who believe the price is likely to remain within its channel can initiate trades when the price fluctuates within its channel trendlines. With complete patterns (i.e. a breakout) – initiate a trade when the price breaks through the channel’s trendlines, either on the upper or lower side. When this happens, the price can move rapidly in the direction of that breakout. Learn to trade chart patterns in Lesson 8.
Trend : Downtrend on Short- and Medium-Term basis and Uptrend on Long-Term basis.
Momentum is Mixed as MACD Line is above MACD Signal Line (Bullish) but RSI < 45 (Bearish). MACD Histogram bars are declining, which suggests that momentum is weakening.
Support and Resistance : Nearest Support Zone is $0.15, then $0.12. The nearest Resistance Zone is $0.20, then $0.25 and $0.30.

ALGO: buy in low level📊Analysis by AhmadArz:
🔍Entry: 0.1784
🛑Stop Loss: 0.1557
🎯Take Profit: 0.2107 -0.2441 -0.2856
🔗"Uncover new opportunities in the world of cryptocurrencies with AhmadArz.
💡Join us on TradingView and expand your investment knowledge with our five years of experience in financial markets."
🚀Please boost and💬 comment to share your thoughts with us!

What's next for ALGO?Algorand setup is pretty clear and a continuation of the uptrend is what i expect here. If the support area at $0.19 hold, i think we can run higher and target the resistance area at $0.28

Algorand Price Analysis. Setup for LongLet's take a look in details globally and locally for BINANCE:ALGOUSDT.P
Why do i think the chart now looks more bullish than bearish! Potential targets for long and continuation!
Hope you enjoyed the content I created, You can support with your likes and comments this idea so more people can watch!
✅Disclaimer: Please be aware of the risks involved in trading. This idea was made for educational purposes only not for financial Investment Purposes.
---
• Look at my ideas about interesting altcoins in the related section down below ↓
• For more ideas please hit "Like" and "Follow"!

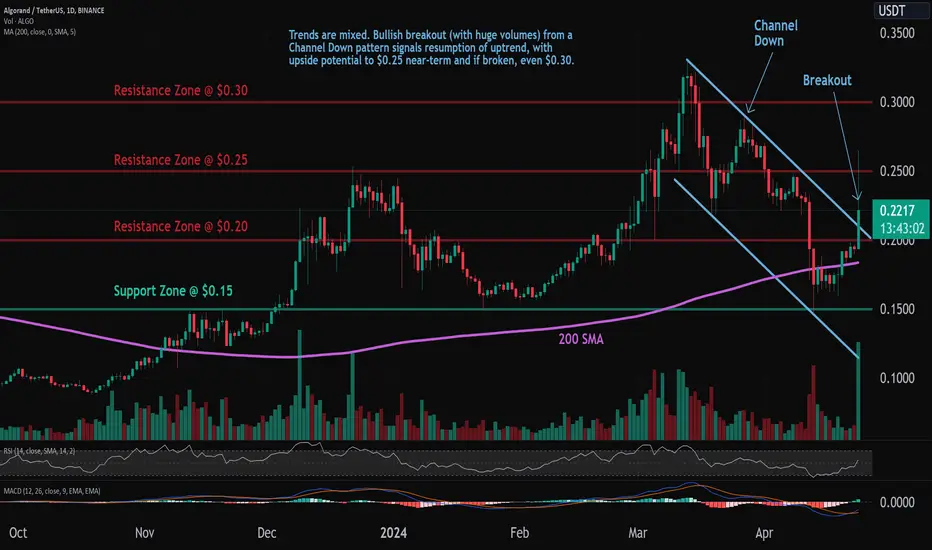
ALGO: Channel Down PatternTrade setup : Trends are mixed. Bullish breakout (with huge volumes) from a Channel Down pattern signals resumption of uptrend, with upside potential to $0.25 near-term and if broken, even $0.30.
Pattern : Price was trading in a Channel Down pattern. With emerging patterns, traders who believe the price is likely to remain within its channel can initiate trades when the price fluctuates within its channel trendlines. With complete patterns (i.e. a breakout) – initiate a trade when the price breaks through the channel’s trendlines, either on the upper or lower side. When this happens, the price can move rapidly in the direction of that breakout. Learn to trade chart patterns in Lesson 8.
Trend : Downtrend on Short- and Medium-Term basis and Uptrend on Long-Term basis.
Momentum is Bullish (MACD Line is above MACD Signal Line and RSI is above 55).
Support and Resistance : Nearest Support Zone is $0.15, then $0.12. The nearest Resistance Zone is $0.20, which it broke, then $0.25 and $0.30.
ALGO is breaking out nicely!ALGO must have gotten a little jealous of HBAR because it's breaking out now too!
2 Da Moon!

ALGO: Descending Triangle PatternTrade setup : Price remains in an Uptrend. After making another Higher High (~$33), which is a sign of Uptrend, price is consolidating in Descending Triangle pattern. The pattern is coming to a pinnacle, which means price is about to breakout. We wait for a breakout that would signal the end of consolidation and a resumption of uptrend. Bullish breakout could see the price revisit $0.30 for +20% upside, while a bearish breakout below $0.23 support could see further downside to $0.18.
Pattern : Price is trading in a Descending Triangle pattern. Typically, a breakout will occur in the direction of the existing trend.
Trend : Downtrend on Short-Term basis, Neutral on Medium-Term basis and Uptrend on Long-Term basis.
Momentum is Bearish but inflecting. MACD Line is below MACD Signal Line and RSI is below 45 but momentum may have bottomed since MACD Histogram bars are rising, which suggests that momentum could be nearing another upswing.
Support and Resistance : Nearest Support Zone is $0.20, then $0.15. The nearest Resistance Zone is $0.25, then $0.30.

#ALGO/USDT#ALGO
The price moves in an inverted head and shoulders pattern
The right shoulder is now complete
Wall is expected for the upper border of the shoulder
We have a higher stability moving average of 100
We have bullish momentum on the RSI and an uptrend
We have a current breakout of the channel to the upside
Entry price is 0.2500
The first target is 0.3000
The second target is 0.3500
The third goal is 0.4000

ALGO: Pullback in UptrendTrade setup : Price remains in an Uptrend. We would be buyers on pullbacks near $0.25 support area, which is also near its up trendline, and could be an attractive swing entry in Uptrend, with +20% upside potential $0.30 near-term. Stop Loss (SL) level at $0.215.
Trend : Downtrend on Short-Term basis and Uptrend on Medium- and Long-Term basis.
Momentum is Bearish (MACD Line is below MACD Signal Line, and RSI is below 45).
Support and Resistance : Nearest Support Zone is $0.25, which it broke, then $0.20. The nearest Resistance Zone is $0.30, then $0.36 and $0.41.

ALGO: Pullback in UptrendTrade setup : Price remains in an Uptrend. We would be buyers on pullbacks near $0.25 support area, which is also near its up trendline, and could be an attractive swing entry in Uptrend, with +20% upside potential $0.30 near-term. Stop Loss (SL) level at $0.22.
Trend : Uptrend across all time horizons (Short- Medium- and Long-Term).
Momentum is Mixed as MACD Line is below MACD Signal Line (Bearish) but RSI ~ 50 (Neutral).
Support and Resistance : Nearest Support Zone is $0.25, then $0.20. The nearest Resistance Zone is $0.30, then $0.36 and $0.41.

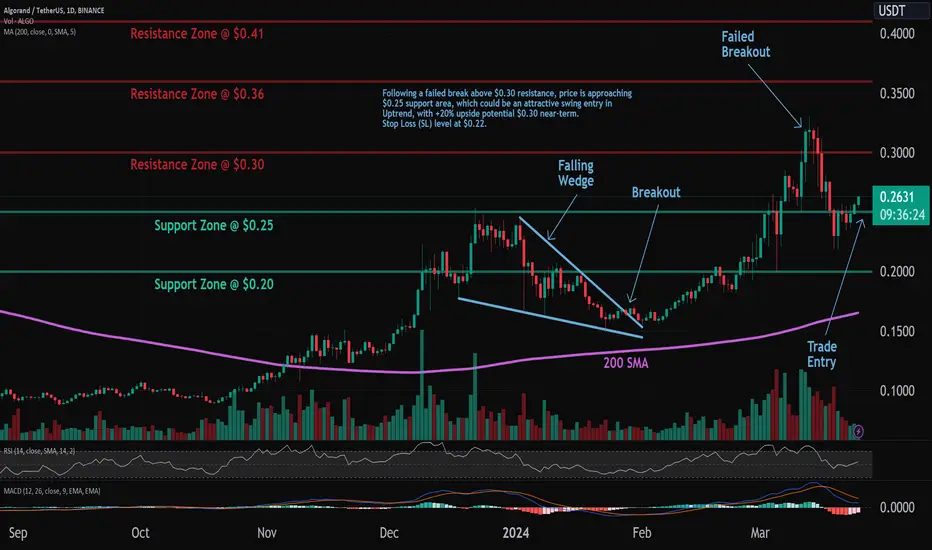
ALGO: Pullback in UptrendTrade setup : Price remains in an Uptrend. Following a failed break above $0.30 resistance, price is approaching $0.25 support area, which could be an attractive swing entry in Uptrend, with +20% upside potential $0.30 near-term. Stop Loss (SL) level at $0.22.
Trend : Uptrend across all time horizons (Short- Medium- and Long-Term).
Momentum is Mixed as MACD Line is below MACD Signal Line (Bearish) but RSI ~ 50 (Neutral). MACD Histogram bars are rising, which suggests that momentum could be nearing another upswing.
Support and Resistance : Nearest Support Zone is $0.25, then $0.20. The nearest Resistance Zone is $0.30, then $0.36 and $0.41.
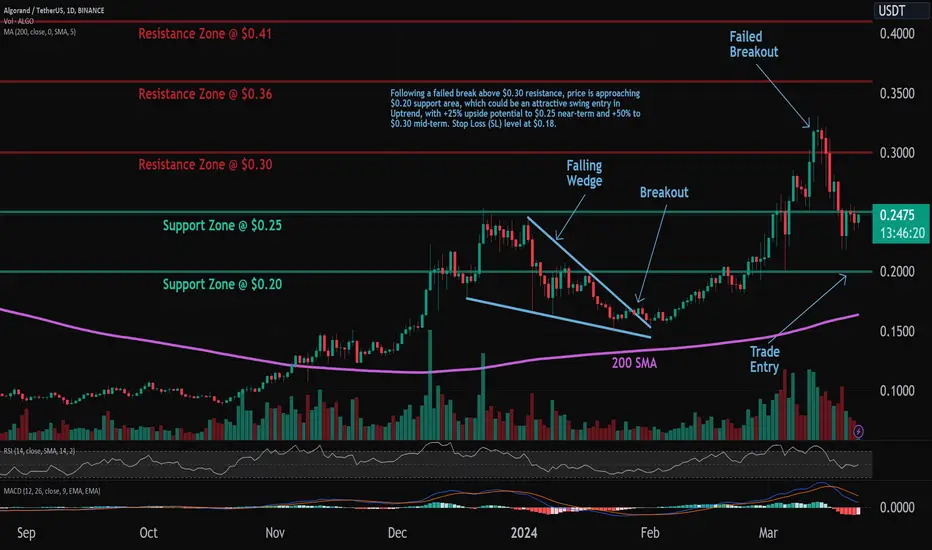
ALGO: Pullback in UptrendTrade setup : Price remains in an Uptrend. Following a failed break above $0.30 resistance, price is approaching $0.20 support area, which could be an attractive swing entry in Uptrend, with +25% upside potential to $0.25 near-term and +50% to $0.30 mid-term. Stop Loss (SL) level at $0.18.
Trend : Neutral on Short-Term basis and Uptrend on Medium- and Long-Term basis.
Momentum is Mixed as MACD Line is below MACD Signal Line (Bearish) but RSI ~ 50 (Neutral).
Support and Resistance : Nearest Support Zone is $0.25, which it broke, then $0.20. The nearest Resistance Zone is $0.30, then $0.36 and $0.41.
Algorand uptrend local targetsBINANCE:ALGOUSDT
Lets take a look on D timeframe for Algo
Possible Targets and explanation idea
➡️Local fib we perfectly touched -0.18 lvl and would be good to test green block again
➡️Like usual we got many variations of price movements but I marked 2
➡️Both of this price movement for continuation Up.
➡️Green - retest 27 block and continuation in spring
➡️Red - retest buy line "take profit" indicator on D and Up
Hope you enjoyed the content I created, You can support with your likes and comments this idea so more people can watch!
✅Disclaimer: Please be aware of the risks involved in trading. This idea was made for educational purposes only not for financial Investment Purposes.
---
• Look at my ideas about interesting altcoins in the related section down below ↓
• For more ideas please hit "Like" and "Follow"!

ALGO: Pullback in UptrendTrade setup : Following a bullish breakout from a Falling Wedge pattern, price resumed its Uptrend. It briefly broke above $0.30 resistance but failed stay above it as traders took profits. Pullback near $0.25 support area could be an attractive swing entry in Uptrend, with +20% upside potential to $0.30 near-term and +40% to $0.36 mid-term. Stop Loss (SL) level at $0.225.
Trend : Uptrend across all time horizons (Short- Medium- and Long-Term).
Momentum is Mixed as MACD Line is below MACD Signal Line (Bearish) but RSI ~ 50 (Neutral).
Support and Resistance : Nearest Support Zone is $0.25 (previous resistance), then $0.20. The nearest Resistance Zone is $0.30, then $0.36 and $0.41.

ALGORAND To $3+ Before EOYAccording to my autistic calculations Algorand will trade above $3 somewhere between june and october this year.
I don't make the rules...
NFA

ALGO: Resistance BreakoutTrade setup : Following a bullish breakout from a Falling Wedge pattern, price resumed its Uptrend. Now it broke above $0.30 to signal continuation of that uptrend, with +20% upside potential to $0.36 near-term and +33% to $0.41 mid-term. Stop Loss (SL) level at $0.265.
Trend : Uptrend across all time horizons (Short- Medium- and Long-Term).
Momentum is Bullish (MACD Line is above MACD Signal Line and RSI is above 55).
Support and Resistance : Nearest Support Zone is $0.25 (previous resistance), then $0.20. The nearest Resistance Zone is $0.30, which it broke, then $0.36 and $0.41.

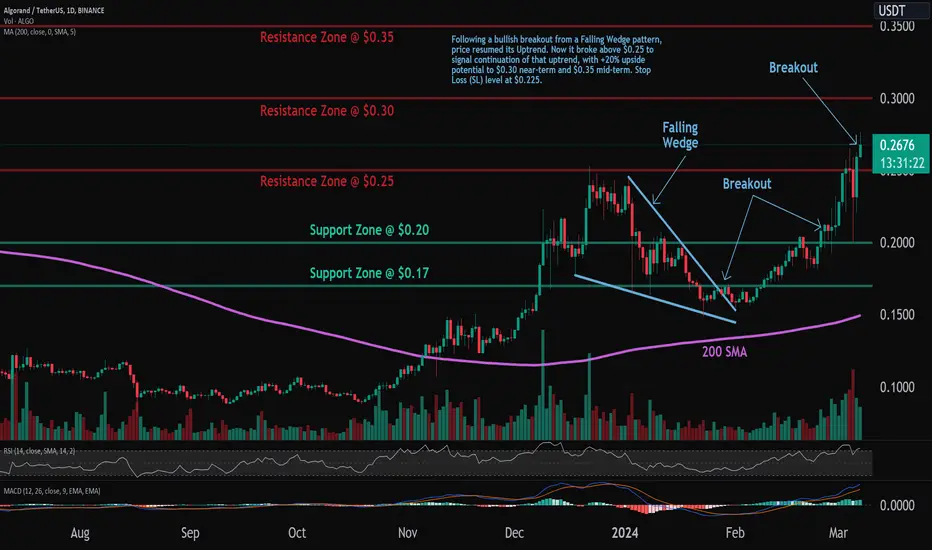
ALGO: Resistance BreakoutTrade setup : Following a bullish breakout from a Falling Wedge pattern, price resumed its Uptrend. Now it broke above $0.25 to signal continuation of that uptrend, with +20% upside potential to $0.30 near-term and $0.35 mid-term. Stop Loss (SL) level at $0.225.
Trend : Uptrend across all time horizons (Short- Medium- and Long-Term).
Momentum is Bullish (MACD Line is above MACD Signal Line and RSI is above 55).
Support and Resistance : Nearest Support Zone is $0.20 (previous resistance), then $0.17. The nearest Resistance Zone is $0.25, which it broke, then $0.30.
ALGOUSD 1WALGO ~ 1W 📈
#ALGO Forms H&S Pattern at larger times. We expect a Break of the Resistance line on this pattern. which would confirm the Bull is coming soon.
Make purchases in stages here, with a minimum target of 20%++

A closer look at the potential of ALGO.People are jumping with joy today as FLARE has made a more than 300% in gains as of late, but when you see what ALGO is about to do, you won't give a second look at FLARE again. Not to put down FLR, I hold a bag myself, but only to use it as a comparison.
Just taking a gander at this chart, even the most rudimentary of assessments come to realize really quickly that there is definitely potential here. Even if the cup & handle formation fails, the chart gives you some really great tips about exit and entry points on long, and short positions.
Enjoy traders, and always use a stop.
