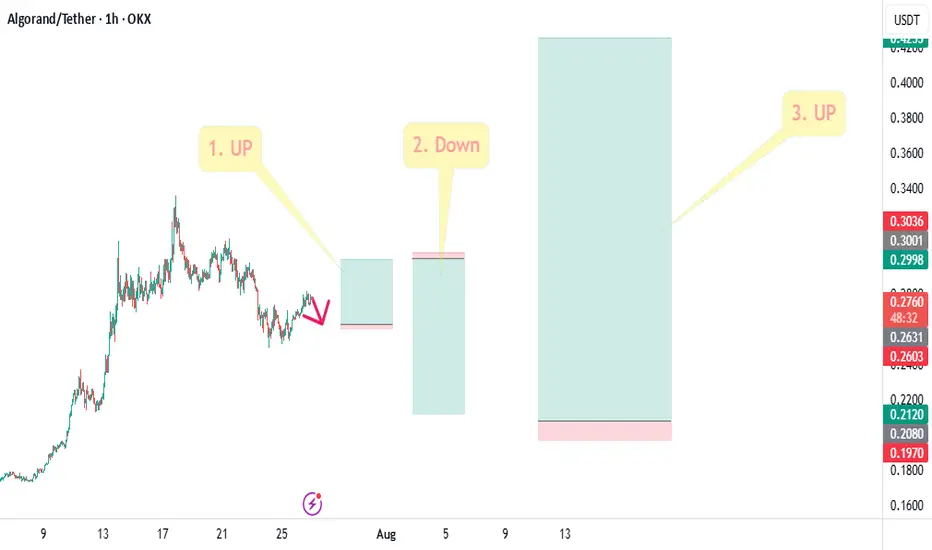
#ALGO Moves of 3 trades in a single chart.#ALGO Moves of 3 trades in a single chart.
In this, the first trade represents a long position on a short-term time frame. Then, a short position can be opened for the retracement. After that, the final third move could be an upside move of more than 100%.
Join Us For All Updates.
@Namaste@
Algotrading
Trump did it again!Donald Trump did exactly what he did in his previous term: Dollar Devaluation .
Reason? Strengthening the US exports.
Will it work? We'll see.
What's your thoughts?
#dollar #forex #euro #devaluation #trump #exports #trading #algo

ETH: Huge Reversal or Correction Still in the Horizon?The recent price action in Ethereum (ETH) has left market participants questioning its next major move. With volatility high and sentiment shifting, is ETH headed for a massive reversal, or is a correction still looming on the horizon?
Key Points to Consider
Macro Environment: Global markets are facing uncertainty from shifting interest rates and regulatory developments in crypto. These factors may spark continued volatility for ETH in the near term.
Technical Analysis: ETH has many analysts watching key support and resistance areas. A clean break above resistance could signal a reversal, while a failure to hold recent gains may suggest a correction is not over yet.
On-Chain Data: Activity on the Ethereum network, including DeFi usage and staking patterns, can offer clues as to whether accumulation or distribution is taking place.
Market Sentiment: Traders remain divided, with some calling the recent bounce a bull trap, and others anticipating renewed upside momentum.
My Take
While the case for a reversal is gaining strength, the possibility of a broader correction can’t be dismissed. It’s crucial for investors to stay alert, watch the charts, and position size accordingly. I'm not longing any crypto in the short run...As for the long run, extremely BULLISH!
*not investment advice*
#Ethereum #Crypto #Investing #MarketAnalysis #Web3 #crypto #bitcoin #trading

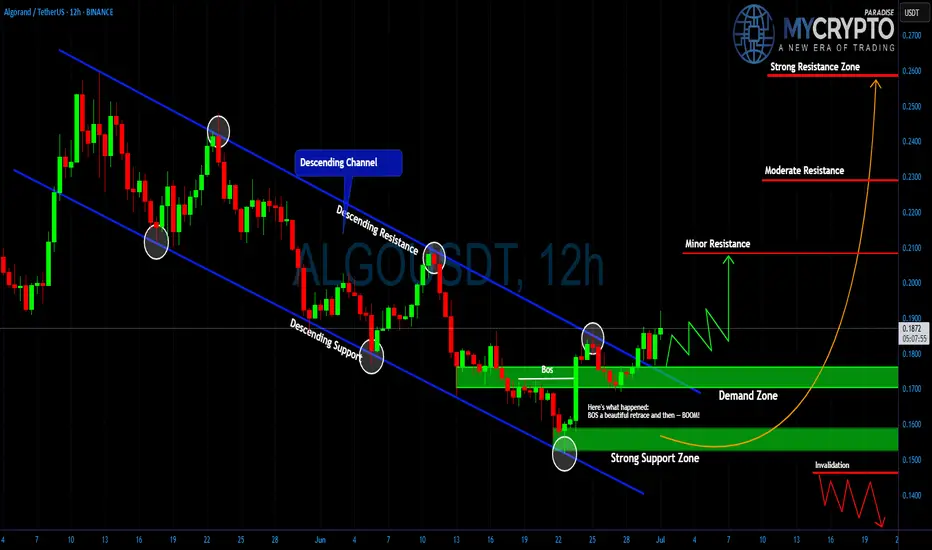
ALGO: Surprise Rally Ahead?Yello Paradisers, did you spot that breakout from the descending channel in time or are you still waiting for confirmation that already happened?
💎#ALGO/USDT has officially broken out of its multi-week descending channel after a textbook Break of Structure (BoS). Price action gave us a beautiful retrace into the demand zone, and from there boom momentum began shifting. This move is now showing early signs of bullish continuation, but as always, the majority will only realize it once the big move is already done.
💎#ALGO had been trading within a clearly defined descending channel, with price reacting precisely between the descending resistance and descending support lines. The breakout occurred after a strong candle pierced the descending resistance, and more importantly, we got a BoS followed by a clean retest of the demand zone around $0.165–$0.175. That reaction was sharp and decisive, indicating strong interest from buyers stepping in.
💎As of now, it is trading near $0.186 and forming higher lows, which supports the idea of an ongoing trend reversal. The structure has changed, and bulls are slowly regaining control. If price sustains above $0.190, the doors open for further upside. The first key level that could slow momentum is minor resistance near $0.210. If that level breaks with volume, moderate resistance around $0.230 becomes the next critical zone. Above that, the major target sits at $0.260, a strong resistance area where a lot of liquidity could be triggered.
💎On the flip side, the strong support zone between $0.145 and $0.155 remains our invalidation area. If price drops below this range, the bullish setup collapses, and we reassess the entire structure. But unless that happens, the bias remains cautiously bullish.
Trade Smart. Stay Patient. Be Consistent.
MyCryptoParadise
iFeel the success🌴
Preventing Holiday Schedule Glitches in Automated Futures Trade
Yesterday the market closed at 1:00 PM, and I still had two open positions. Normally my algorithm sends an “exit all” signal at 3:59 PM EST to close every futures contract, but it didn’t account for the holiday schedule. That glitch cost me $5,000 in just a few hours. Lesson learned.

June trading results - three automated trading systemsHi,
In month of June 2025, my three automated trading systems made 32 trades on ME.S and MN.Q.
The pnl pie charts are on the screen. I lost about $1,000 in total. I trade on Micro. Well, I was up for the past 5 month but this kinda hurts, but its ok, I should not give up. I have back tested my strategies using python backtrader in 5 years (rolling walk forward), I know that lost is also expected.
My system trades on 15 min candle, and I use tradingView + tradovate automation system which I built myself.

USDJPY FXAN & Heikin Ashi exampleIn this video, I’ll be sharing my analysis of USDJPY, using FXAN's proprietary algo indicators with my unique Heikin Ashi strategy. I’ll walk you through the reasoning behind my trade setup and highlight key areas where I’m anticipating potential opportunities.
I’m always happy to receive any feedback.
Like, share and comment! ❤️
Thank you for watching my videos! 🙏

Automated Execution: TradingView Alerts → Tradovate using AWS LaI’ve built a fully automated pipeline that takes live TradingView alerts and turns them into real orders in Tradovate. Here’s how it works, step by step (I will provide a video on it):
PineScript Alerts
My indicator/strategy in TradingView fires alert() with a JSON payload (symbol, side, qty, price, ATR, ENV).
Webhook to AWS
Alerts hit an API Gateway endpoint in AWS, invoking a Lambda function.
Lambda Processing
Parse the JSON from TradingView.
Calculate Stop‐Loss & Take‐Profit using ATR.
Authenticate to the Tradovate API (demo & live environments).
Place an OCO order (placeOSO) with proper bracket legs.
Send a confirmation message to my Telegram channel.
Tradovate REST API
Auth: POST /auth/accesstokenrequest → accessToken
List accounts: GET /account/list → find accountId
Place OCO: POST /order/placeOSO with entry, SL, TP
Testing & Monitoring
Local smoke tests of Telegram bot.
Lambda console test events for sample payloads.
CloudWatch logs for debugging & alerts on errors.
Why it matters:
Zero manual steps from signal to fill.
Consistent risk management via ATR‐based SL/TP.
Clear audit trail: logs in AWS + Telegram notifications.
Educational resource for anyone building similar setups
Feel free to ask questions or suggest improvements! Please leave comments.

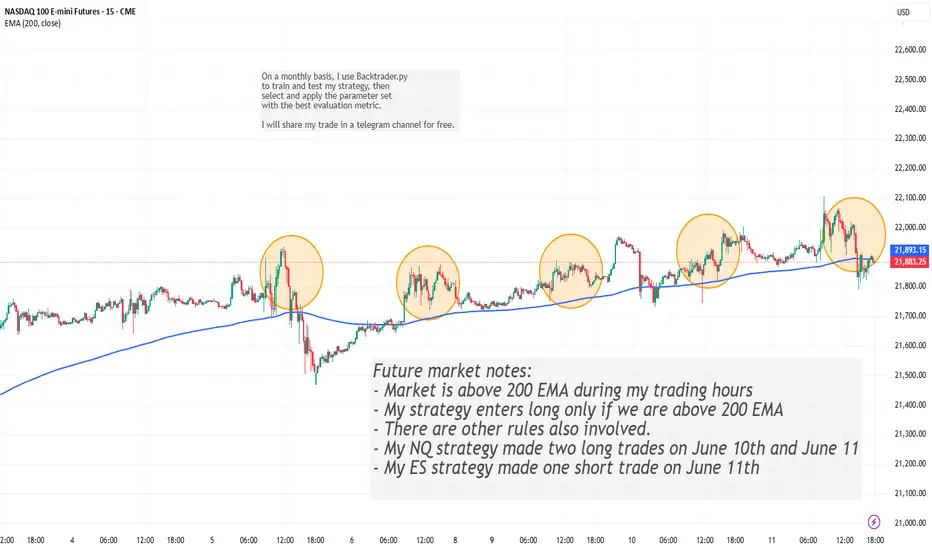
200 EMA Futures Strategy Recap: June 10–11Description:
Market Context:
During my trading window (11:00–17:00 ET), price remained decisively above the 200-period EMA.
Key Rule:
• As one of several entry conditions, the model only goes long when price is above the 200 EMA.
June 10–11 Trades:
NQ Strategy: Two long entries—one on June 10 and one on June 11.
ES Strategy: One short entry on June 11 (all other rules aligned).
Feel free to ask questions or share feedback!
Live trade 06/10/2025Here is what one of my strategy traded today. I have 5 trading strategies in NQ and ES.
Today's trade was made based on the NQ DVD strategy where I look at the cumulative daily volume, an indicator that I developed. The Cumulative daily volume is calculated based on the direction of each candle and it resets on daily basis. For more info, please see my channel.
For this specific trade, the both TP and SL are calculated based on a coefficient of ATR. If none of them are met, then I close the trade by 16PM EST.

Volume Speaks Louder: My Custom Volume Indicator for Futures
My Indicator Philosophy: Think Complex, Model Simple
In my first “Modeling 101” class as an undergrad, I learned a mantra that’s stuck with me ever since: “Think complex, but model simple.” In other words, you can imagine all the complexities of a system, but your actual model doesn’t have to be a giant non-convex, nonlinear neural network or LLM—sometimes a straightforward, rule-based approach is all you need.
With that principle in mind, and given my passion for trading, I set out to invent an indicator that was both unique and useful. I knew countless indicators already existed, each reflecting its creator’s priorities—but none captured my goal: seeing what traders themselves are thinking in real time . After all, news is one driver of the market, but you can’t control or predict news. What you can observe is how traders react—especially intraday—so I wanted a simple way to gauge that reaction.
Why intraday volume ? Most retail traders (myself included) focus on shorter timeframes. When they decide to jump into a trade, they’re thinking within the boundaries of a single trading day. They rarely carry yesterday’s logic into today—everything “resets” overnight. If I wanted to see what intraday traders were thinking, I needed something that also resets daily. Price alone didn’t do it, because price continuously moves and never truly “starts over” each morning. Volume, however, does reset at the close. And volume behaves like buying/selling pressure—except that raw volume numbers are always positive, so they don’t tell you who is winning: buyers or sellers?
To turn volume into a “signed” metric, I simply use the candle’s color as a sign function. In Pine Script, that looks like:
isGreenBar = close >= open
isRedBar = close < open
if (not na(priceAtStartHour))
summedVolume += isGreenBar ? volume : -volume
This way, green candles add volume and red candles subtract volume, giving me positive values when buying pressure dominates and negative values when selling pressure dominates. By summing those signed volumes throughout the day, I get a single metric—let’s call it SummedVolume—that truly reflects intraday sentiment.
Because I focus on futures markets (which have a session close at 18:00 ET), SummedVolume needs to reset exactly at session close. In Pine, that reset is as simple as:
if (isStartOfSession())
priceAtStartHour := close
summedVolume := 0.0
Once that bar (6 PM ET) appears, everything zeroes out and a fresh count begins.
SummedVolume isn’t just descriptive—it generates actionable signals. When SummedVolume rises above a user-defined Long Threshold, that suggests intraday buying pressure is strong enough to consider a long entry. Conversely, when SummedVolume falls below a Short Threshold, that points to below-the-surface selling pressure, flagging a potential short. You can fine-tune those thresholds however you like, but the core idea remains:
• Positive SummedVolume ⇒ net buying pressure (bullish)
• Negative SummedVolume ⇒ net selling pressure (bearish)
Why do I think it works: Retail/intraday traders think in discrete days. They reset their mindset at the close. Volume naturally resets at session close, so by signing volume with candle color, I capture whether intraday participants are predominantly buying or selling—right now.
Once again: “Think complex, model simple.” My Daily Volume Delta (DVD) indicator may look deceptively simple, but five years of backtesting have proven its edge. It’s a standalone gauge of intraday sentiment, and it can easily be combined with other signals—moving averages, volatility bands, whatever you like—to amplify your strategy. So if you want a fresh lens on intraday momentum, give SummedVolume a try.

GBPJPYHello Traders,
Today’s first setup comes from GBPJPY. Based on current market conditions, I’ve identified a high-probability sell opportunity. The trade has already been executed on my end, with a Risk-to-Reward Ratio set between 1:1.5 and 1:2, depending on your individual risk appetite.
🔍 Trade Details:
✔️ Timeframe: 15-Minute
✔️ Risk-to-Reward Ratio: 1:1.50 / 1:2
✔️ Trade Direction: Sell
✔️ Entry Price: 193.564
✔️ Take Profit: 193.256
✔️ Stop Loss: 193.768
🔔 Disclaimer: This is not financial advice. I'm simply sharing a trade I’m personally taking, based on my own methodology. It is intended purely for educational purposes.
📌 If you're interested in a more systematic and data-driven approach to trading:
💡 Follow the page and turn on notifications to stay up to date with future trade ideas and market breakdowns.

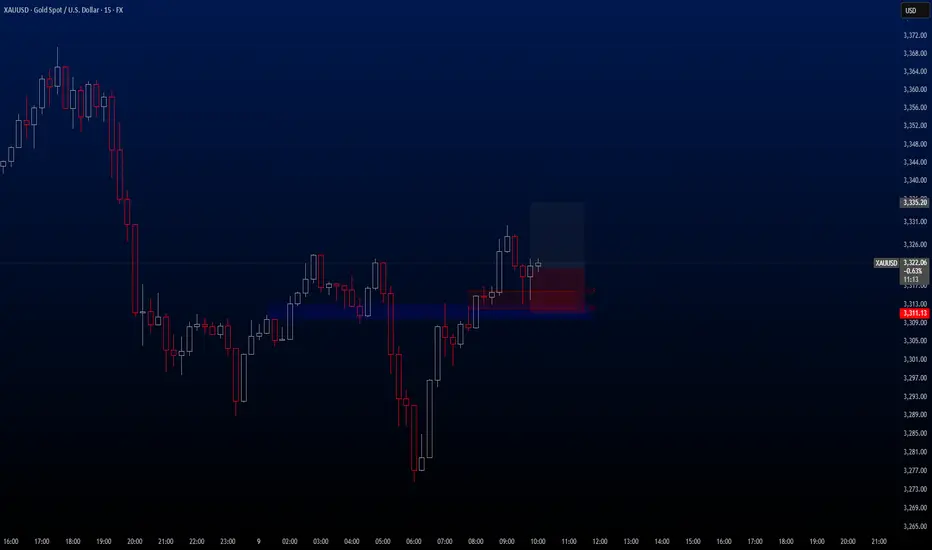
XAUUSDHello traders!
There's a buy opportunity on the XAUUSD pair, and I wanted to share this trade with you. The trade is currently active on my end, and I’ve set the Risk-to-Reward Ratio to 1:1.50.
🔍 Criteria:
✔️ Timeframe: 15M
✔️ Risk-to-Reward Ratio: 1:1.50
✔️ Trade Direction: Buy
✔️ Entry Price: 3320.74
✔️ Take Profit: 3335.20
✔️ Stop Loss: 3311.13
🔔 Disclaimer: This is not financial advice. It's a trade I’m taking based on my own system, shared purely for educational purposes.
📌 If you're also interested in systematic and data-driven trading strategies:
💡 Don’t forget to follow the page and subscribe to stay updated on future analyses.
EURUSDThe third and final trade of the day will be on EURUSD.
Following the significant depreciation of the Euro during the U.S. and Asian sessions yesterday, I expect this downward trend to continue today as well. That’s why I’m opening a sell trade on the 15-minute chart (as always, using a short-term timeframe).
🔍 Criteria:
✔️ Timeframe: 15M
✔️ Risk-to-Reward Ratio: 1:2
✔️ Trade Direction: Sell
✔️ Entry Price: 1.12932
✔️ Take Profit: 1.12743
✔️ Stop Loss: 1.13028
🔔 Disclaimer: This is not financial advice. It's a trade I’m taking based on my own system, shared purely for educational purposes.
📌 If you're also interested in systematic and data-driven trading strategies:
💡 Don’t forget to follow the page and subscribe to stay updated on future analyses.

EURUSD EURUSD presents another buy opportunity, and I've just activated the trade.
I wanted to share it with you as well. This trade has three different Take Profit levels, which are:
1.13455 / 1.13563 / 1.13786
However, I personally plan to close the trade at 1.13455 in order to stick to my game plan.
This will be the last trade of the day for me.
🔍 Criteria:
✔️ Timeframe: 15M
✔️ Risk-to-Reward Ratio: 1:1.50 / 1:2.50 / 1:4.50
✔️ Trade Direction: Buy
✔️ Entry Price: 1.13290
✔️ Take Profit: 1.13455
✔️ Stop Loss: 1.13180
🔔 Disclaimer: This is not financial advice. It's a trade I’m taking based on my own system, shared purely for educational purposes.
📌 If you're also interested in systematic and data-driven trading strategies:
💡 Don’t forget to follow the page and subscribe to stay updated on future analyses.

BTCUSDTHello traders! A potential short signal is forming on BTCUSDT. However, it's not ideal to open the sell position right now — we need to wait for the price to reach a specific level. Once it does, we can execute the trade.
So, what are the entry, TP, and SL levels for this setup?
If you’ve just started following me, let’s get started!
🔍 Criteria:
✔️ Timeframe: 15M
✔️ Risk-to-Reward Ratio: 1:1.50 / 2
✔️ Trade Direction: Sell
✔️ Entry Price: 95828.00
✔️ Take Profit: 95507.18
✔️ Stop Loss: 95988.00
🔔 Disclaimer: This is not financial advice. It's a trade I’m taking based on my own system, shared purely for educational purposes.
📌 If you're also interested in systematic and data-driven trading strategies:
💡 Don’t forget to follow the page and subscribe to stay updated on future analyses.

XUTEK : huge gap away !Love to use aged data, to clarify real alpha yield.
A huge gap down of old data (most aged).
Force to be buliish in futur to balanca whole picture.

#DAX - 27 MarSimilar to SPX, DAX looks even more bearish based on price action.
IMO, as long as PZ holds, expect further downside.

Short Trade at Ethereum executed Strong signal received on ETH which shows a Profit Factor of 4.00 in Short Trading at the 15min timeframe. The trade was open for 45min and the Exit was placed at a very nice spot.
Would you like to receive such sort of signals in realtime? Tell me in the comments and follow for more!

Behind the Buy&Sell Strategy: What It Is and How It WorksWhat is a Buy&Sell Strategy?
A Buy&Sell trading strategy involves buying and selling financial instruments with the goal of profiting from short- or medium-term price fluctuations. Traders who adopt this strategy typically take long positions, aiming for upward profit opportunities. This strategy involves opening only one trade at a time, unlike more complex strategies that may use multiple orders, hedging, or simultaneous long and short positions. Its management is simple, making it suitable for less experienced traders or those who prefer a more controlled approach.
Typical Structure of a Buy&Sell Strategy
A Buy&Sell strategy consists of two key elements:
1) Entry Condition
Entry conditions can be single or multiple, involving the use of one or more technical indicators such as RSI, SMA, EMA, Stochastic, Supertrend, etc.
Classic examples include:
Moving average crossover
Resistance breakout
Entry on RSI oversold conditions
Bullish MACD crossover
Retracement to the 50% or 61.8% Fibonacci levels
Candlestick pattern signals
2) Exit Condition
The most common exit management methods for a long trade in a Buy&Sell strategy fall into three categories:
Take Profit & Stop Loss
Exit based on opposite entry conditions
Percentage on equity
Practical Example of a Buy&Sell Strategy
Entry Condition: Bearish RSI crossover below the 30 level (RSI oversold entry).
Exit Conditions: Take profit, stop loss, or percentage-based exit on the opening price.

ALGOUSDT - Weekly LONGThis is a weekly technical analysis for educational purposes on ALGOUSDT. I believe that Algo will revisit the same levels and will be widely discussed during the altcoin bull season. I may be wrong. :)
Regards,
