SHORT ALGO- Back to 25 CENTS price action on algo along with the rest of the market has solid signs of bearish consolidation
a retest of 25 cents lines up with the pervious historical support back in the 2020 bullish impulse
Algotrading

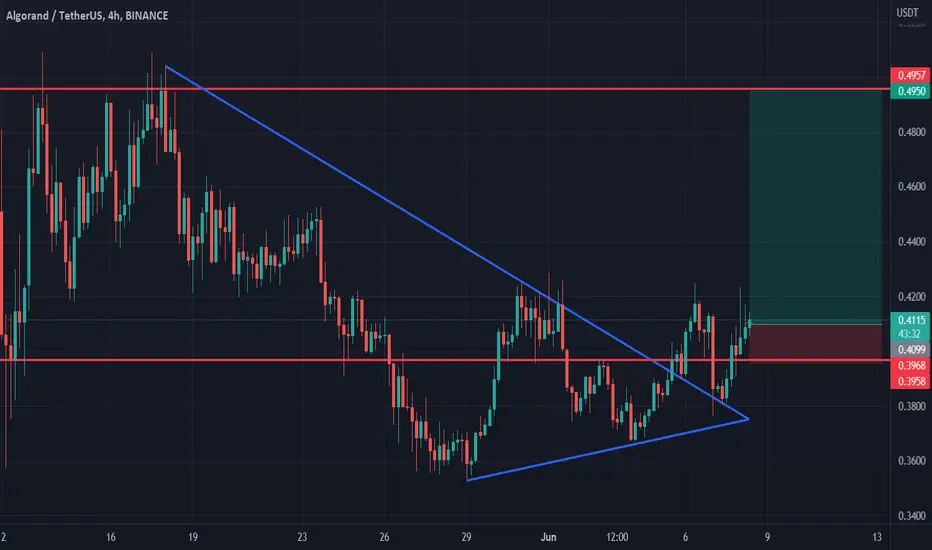
Algorand longAlgorand bounced off the descending trendline. Asset broke trough the resistance level. Bullish movement to resistance level at 0.495 is possible.

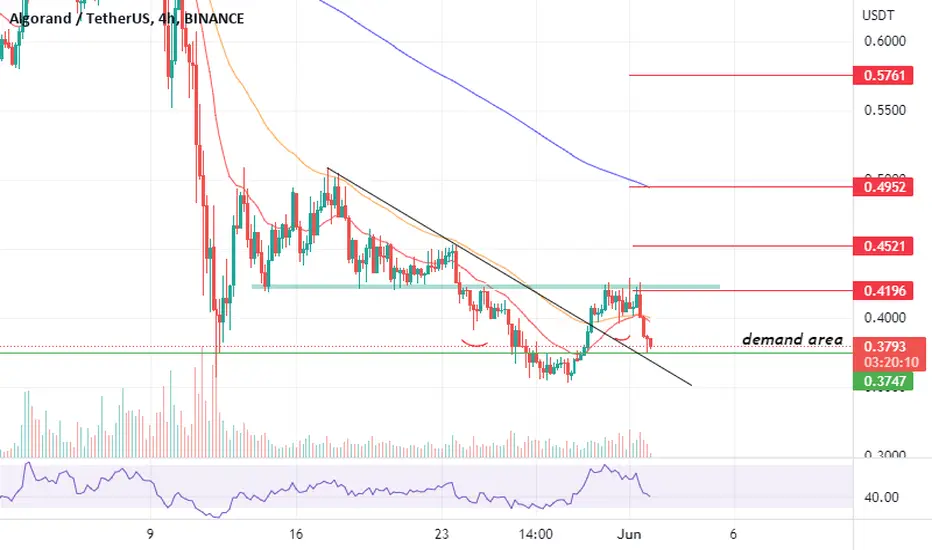
ALGO/USDT BUYING SETUP (SWING)ALGO potential rejection after hit demand area and continue upward movement .we can close if can't break resistance at $0.425 area
Buy zone : 0.38 - 0.365- 0.355
Target : 0.4196 - 0.4521 - 0.4952 - 0.5761
Stop : 0.345
1972-2022 Comparison of Nasdaq and GSPC Indexes.This chart shows the monthly Nasdaq and S and P 500 going back to the early 70's, a little after the Nasdaq index first started (which I believe was 1971). I should note that it's a monthly chart, again, so it's SMA's are monthly based, and I use logarithmic scale for long term charts. Log. is not really for short term so much. I like to look at very long term charts periodically, and freshly analyze them. I believe it's important to study longer time frames especially if you're a day trader like me. I get consumed by the short term movements, and believe you need a full history of anything to truly understand it.
It's fairly easy to see that the Nasdaq moves further and faster than the GSPC. The Nasdaq has tripled the long performance of the GSPC since 1975, and when it corrects, expect that to be more pronounced as well. I like to look at Fibonacci Retracements simply because other people look at them, and they're probably programmed into the big quant trading companies algorithms as well. Almost everyone looks at Fib. retracements whether they admit it or not. Of course, you can't trade directly at these levels as if they are a "golden mean". In the stock market if you meet one person who trades off of some indicator, you can bet others do to, no matter how crazy you think it is. Even if you don't agree with it; the sum total of all points of view of those trading, equate to the current price. I know what I'm thinking, it's the average of everyone's thinking, that I can't figure out. Of course, something like 80 percent of the price action is said to be the result of automated, algorithmic trading. So, I'm taking classes on computer programming, algorithmic trading, data structures, etc. Which leads me into some notations I have on the chart.
I have a big orange arrow pointing to October of 1987 when new computer trading systems got everyone in trouble. I've placed red arrows at points on the Rate of Change indicator where the ROC begins to diverge with price action. It isn't 100 percent, but if this divergence begins to occur be prepared for downside which could move extremely fast. We had a Rate of Change price divergence starting in 12/20/21 and look what's happened since then. Also the Rate of Change is moving down now, and it's very low already, about 20 below the Zero line. This indicator alone makes me believe that there will be more short side price action to come. The Nasdaq went from a low of 1265, roughly, in March of 2009 to a high of 16,212 in November of last year. That's not supposed to happen. There are people who are 31 years old right now, and there hasn't been a real bear market since they became legal adults. I generally live by not having a directional bias in the market, I just follow price action, and I don't believe much in holding positions overnight. I am just cautioning people who have a long bias after 13 years of a generally bullish market, that we have some very unique market condition coming into play, and learning a more price action based strategy, if they haven't is somewhat warranted. We have a few, MASSIVE, market caps holding indexes up which are skewing the outlook more positive than it should be. We have economic experts that are about 150 years old, and they've never seen anything like this. I loved the idea of Cryptocurrency, but I tend to agree with Buffet on that one. Crypto doesn't have value at it's core, it wasn't worth anything when the idea started. Normally, when a company goes public they have some core value. They produce something, or create a new technology that has value. I love that it trades 24/7 basically, I love that you can use it on the dark web, I love that politicians don't get rich from it, I loved that computer guys could make money mining it in the beginning. Soon you're going to need your own power plant and cpu company to mine it.
I ramble too much maybe, without getting to the point. The point is from 2009 to our 2021 index high, the recent Nasdaq low was about a 35% retracement of that gain, and statistically that's just not enough given the decade long upside performance of it. We had a decade run that came close to the Nasdaq gains in the 90's tech bubble. The tech bubble was around 1500% in a decade, we were close to 1300% in a decade (those numbers are give or take a little obviously). The tech bubble bottom 34 months later with a 84% retracement of it's decade long gain. We're currently only 6 months away from our high in November, and only saw a roughly 35% retracement. No one knows what the market will do, but if you believe we've seen the bottom you have to explain away numbers like that. My friend thinks it's un-American to be short a position. Remember that these quant. trading companies have MIT students developing algorithms to beat you out of your money. Competition is the American way.

Algo Obvious patterns!Here is a update analysis on Algo. We about to see algo move up trend in the next few weeks. All blue arrows shows how long you should be holding algo for to profit. Algo have potential of hitting over $3 Rsi looks similar from all its previous lows. Make sure you do your own research before buying.

TRADE USING AXE STRATEGY In this idea, we are using AXE strategy.
What is AXE Strategy?
Axe is an algotrading strategy developed by our professional trading experts and programming team. This strategy is based on how buyers and sellers behave in the market.
The high win-rate of this strategy makes us confident that it will be used by many high-profile traders all around the globe.
Visit our website for more information and how to access to AXE Strategy.
$ETH Maddrix III - Great SHORT taken, 50% of profit lost in pumpThis week Maddrix III took a short position (randomly decided by the algo) and it was our lucky day because it was dumping.
It was frustrating because profits were cut by 2 due to the pump back.
What is important to learn here is that when you have a trading system, you MUST stick to the rules.
In this case, it reached it's STOP level, so it exited, for a much smaller profit. We can see that it then went back down and it "could" have made more.
The problem is when it was pumping up, it could have kept going higher and higher, and the safest is to take some profits, instead of thinking "what if".
This is what it means to be disciplined and have RULES.
If this was done by a human, it would be very hard. Good thing the algo is taking care of it!

Anchor for another 60% gain? I really hope you can see this but I believe there is another push up to get that median line plus to finish the impulse wave up. Looks good, highly volatile.
I leave the macro view below.

#ALGO/USDT 1DAY UPDATE BY CRYPTOSANDERS Welcome to this quick ALGO/USDT analysis.
I have tried my best to bring the best possible outcome in this chart.
Reason of trade:- ALGO/USDT PARALLEL CHANNEL brake the green and trandline and buy the retest green zone. PARALLEL CHANNEL green zone. (SPOT CALL)
Entry:-$0.4230,$0.4625
Traget:- 30%
Stoploss:- $0.3555
Remember:-This is not a piece of financial advice. All investment made by me is at my own risk and I am held responsible for my own profit and losses. So, do your own research before investing in this trade.
Sorry for my English it is not my native language.
Do hit the like button if you like it and share your charts in the comments section.
Thank you...

EURUSD | SHORT POSITION The bears are gradually coming in.
EUR/USD is dropping towards 1.0500, having faced rejection above 1.0550.
The retreat in the major could be linked to the deteriorating market mood, which has revived the US dollar’s safe-haven appeal. EU inflation data awaited.

HOW TO reverse AUDNZDUsing POW reversal strategy on this trading idea.
Working AUDNZD on the 30M
Strategy is set to work my chosen session times hence red shading showing when I don't trade.
Chart shows a label which details all trade rules for the current live trade.
That trade is another short trade like the previous trade which can be seen on chart.
Blue lines show TP points, Red lines are SL points and yellow lines are my entry points.
Good reverse scalping strategy with stats to back it up.

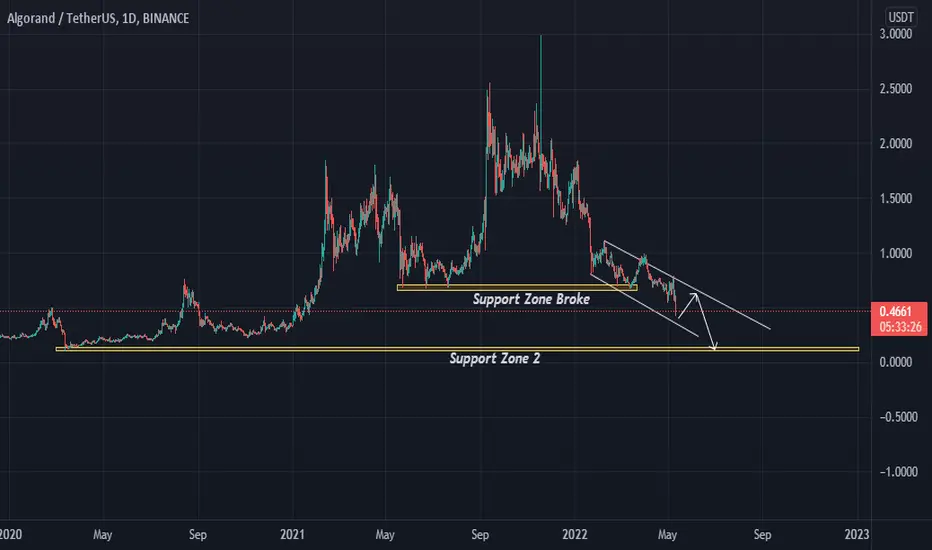
ALGORAND ALGO/USDT i saw Bearish Flag on this coin im Short on ALGO and waiting for next Support zone 2 good luck!
This Chart Pattern Calls for Algorand $1.00 TargetThe technical chart suggests that Algorand (ALGO) has the potential to tag the $1.00 milestone again. The downswings since February 8 can be confined within a descending channel, with the swings getting shorter in magnitude and the momentum drying out.
Algorand Descending Channel
After reaching the lower support trendline, the ALGO price bounced, and we're now looking for a possible retest of the upper resistance trendline, which falls near the $1.00 psychological level.
The current bounce is also supported by the RSI oscillator, which broke above the 50 mid-level. The last time the RSI broke above the 50 mid-level on March 21, ALGO's price retested the upper resistance trendline.
The pattern, if confirmed, could set off a much larger rally in the coming months. However, for a meaningful reversal, we would need a daily break and close above the descending channel but, more importantly, above $1.00.
We also have a massive bullish divergence between the price and the RSI oscillator, which highlights the exhaustion of selling pressure. This is a significant price development because it has the potential to call for a potential bullish reversal.
Looking forward: We have to keep in mind that the overall trend is bearish as we're still trading below the 200-day simple moving average, and in terms of the price structure, we are still following a bearish path. However, we might be in the process of a reversal if the pattern highlighted above is triggered.

ALGO BullishWe broke this falling wedge pattern , i think we will see easily hit tp 1 ! RSI / MACD bullish too
Give me like if you agree , if you want more check my profile

ACE OF WATERS - US Dollar (DXY) Index - Daily (75%w 8.5 R/R)Not the greatest ROI due to not trading a high frequency. However, 75% win rate with a profit factor of 25. Winning trades yield about 8.5x as much as loosing trades. Only trades about 60x per year and typically holds winning trades for about 6 days. Avg trade returns .65% ROI. Largest floating/running drown down during any given trade was .78% with the largest closing loss of .14%.
Slow and steady long term strategy with minimal running drawdowns with low risk, high return.
Be like water my friends.
ACE OF WATERS will be available for copy trading in MT4 - MT5 library soon.

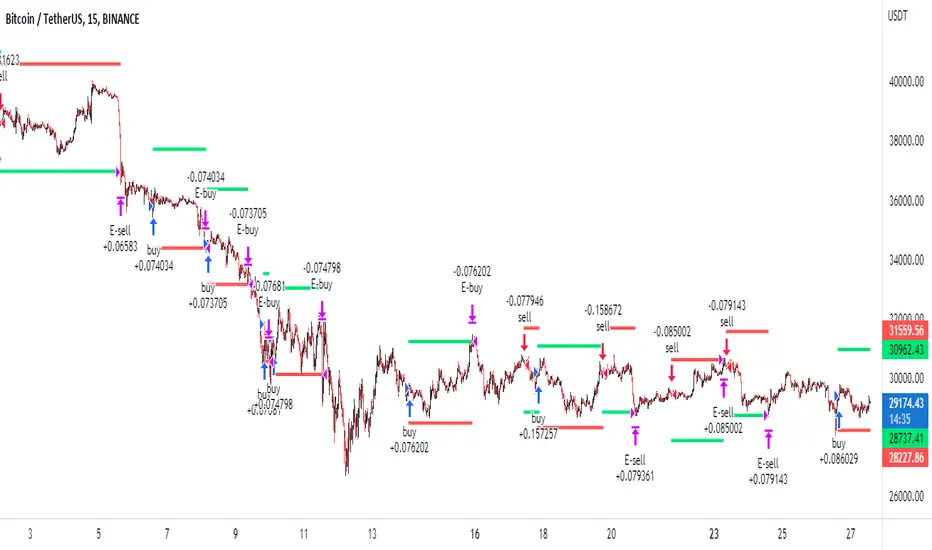
Ace of Waters - 4 HR BTC Oanda 800% 1year, 1.37% max drawdown. I have no words for this back test. Over 800% profit in the previous year, within just over 100 trades. Only a max drawdown of 1.37%??? My jaw is literally on the floor right now. It has always been my dream to find a reasonable solution to market volatility on BTC.... The test includes the .005% fee Oanda charges PLUS the 30 tick average spread or 'slippage'. Honestly, I dont know what to do. Its been 4 years and 100's of hours trying to find something simple, sustainable and for gods sakes understandable. I think mitigation of such a huge profit potential with such a small draw down is THE holy grail I was looking for. IT IS NOT FOR SALE. DONT ASK. LOOK AT THE CHART, FIGURE IT OUT FOR YOUR SELF. PS. The settings and calculations derived are NOT arbitrary or discretionary. Its dynamic and relative. I dont claim to hold any superior math skills BUT ive done enough to know the dangers of second guessing. Ide be happy trading this algorithm on autopilot and dont profess any knowable future results BUT who cares, your going to likely win 3/4 trades and the trades you loose will likely only be 1/7th the trades you win. Be like water my friends. BINANCE:BTCUSDT OANDA:BTCUSD

Ace of Waters - 4hr 280% 1yr backtestI have no words for this back test on gold 4hr Oanda chart - Heikinashi candles. Over 280% profit in the previous year, within just over 240 trades. Only a max drawdown of 0.46%%??? My jaw is literally on the floor right now. It has always been my dream to find a reasonable solution to market volatility on GOLD .... The test includes the .005% fee Oanda charges PLUS the 15 tick average spread or 'slippage'. Honestly, I dont know what to do. Its been 4 years and 100's of hours trying to find something simple, sustainable and for gods sakes understandable. I think mitigation of such a huge profit potential with such a small draw down is THE holy grail I was looking for. IT IS NOT FOR SALE. DONT ASK. LOOK AT THE CHART, FIGURE IT OUT FOR YOUR SELF. PS. The settings and calculations derived are NOT arbitrary or discretionary. Its dynamic and relative. I dont claim to hold any superior math skills BUT ive done enough to know the dangers of second guessing. Ide be happy trading this algorithm on autopilot and dont profess any knowable future results BUT who cares, your going to likely win 3/4 trades and the trades you loose will likely only be 1/7th the trades you win. Be like water my friends.

FOLLOWING THE BIG MONEY FOOTPRINTS LONG-TERMwe think good traders follow good rules. always consistent and planning we following the big money footprints. the bluebox system have creat a strong entry point in the eur/usd pair. the macd shows a light divergency and the rsi also and we also identify a high volume in d1. what let us suspect that the small money is coming in. all this classic thinking are not the reason why we take this trade its more the indication of our blubox. system that applies batch system parameters. bluebox entry points are calculated following the big money footprints. to make a successful pitch, the most important thing you can do is to be prepared. the average of success of the bluebox signal is up to eighty seven percent. if you require any further information, feel free to contact me
algorithmic trading by phi
thank you!!!

Bullish Divergence on Algo#Algo is getting ready for a bigger move and forming bullish Divergence on weekly timeframe is a confirmation for the same

Bank Nifty AlgoHere I developed after many years how typically Banknifty indices operate sudden huge move, its completely controlled by Big players after trapping retailers SL. There are few methods identified and back tested after several months. Basically its perfectly works with Banknifty future & Option buyers. Can easily capture 200 to 300 points from sudden level in intraday. The purpose of this indicator mainly to eliminate Fear, greedy, emotions., its basically "KONW YOUR RISK & REWARD" & Kindly note this for only intraday players how to use it. Its updated version of Millreeh
This indicator facility to plot following for some reason,
1. SMA 20 & 200
2. Swing forming in MTF (current chart TF, 15, 1 Hr )
The basic setup categories two way
1. Setup2 - Just taking out retailer SL zone and trade against Retailers & RR 1:5
2. Algorithm Setup - Join hand with big players. (When S2 Fails) & RR 1:10
How to use for Setup2:
1. Keep your Chart 3 mins
2. Identify Reaction zone/area ( Where to take trade)
3. Action center (When to enter & Know the SL level)
4. Exit Trade ( Know the Target level)
For Algo setup its need lot experience to spot and its move like free fall most of time.


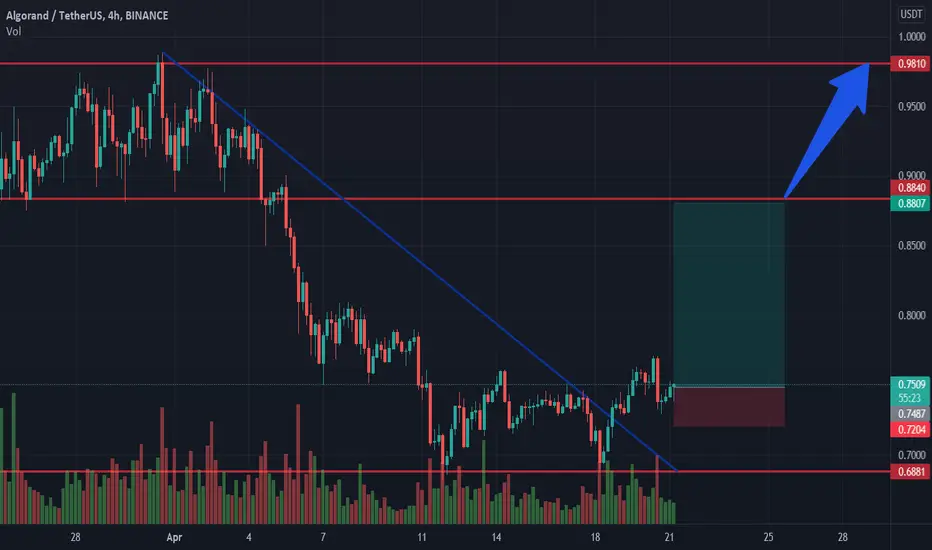
Algorand longAlgorand bounced off the support level. Asset broke through the descending trendline. Bullish movement to resistance level at 0.88 is expected to happen. If the next resistance level will be broken up the Algorand is supposed to reach 0.98.