ALGOUSD - Bullish idea on the daily timeframeHello traders and investors,
Today we have looked at the ALGO / USD pair. Assuming that 2020 March low is the beginning of a primary cycle (purple) and that 2021 February high is the beginning of extension in primary wave 3 (hence intermediate blue wave 1), I can only be extremely bullish that we are in a 1-2-1-2-1-2 pattern that is unfolding towards new (incredible) high.
Looking at possible targets, I see a confluence of Fibonacci for primary pink 3 (2.618) and possible ends of intermediate blue wave 5 (200%).
This is a bullish idea that still needs to unfold in the next couple months.
What's your target?
Algousd

ALGOUSD LONGWe recommend to take a long position as the price is currently at the lower boundary of the Keltner Channel. Moreover current market conditions are favouring bulls and we expect it to bounce towards the previous support which should be act as a resistance.
Entry and target are shown in the chart.
No financial advice.

buy zoneit's no secret that i'm bullish on ALGO long term, and i think we're likely to see strong growth starting in Q1 2022. here are a few reasons why:
the new governance model is beginning, and users will be locking up supply for extended periods of time, effectively taking algo out of circulation. supply down, price up.
el salvador committing to algorand for their crypto infrastructure. el salvador doesn't exactly have a great track record as a model government, but i do think their endorsement is a valid signal of adoption.
it's fast and cheap and has some of the best minds behind it. and with MIT's ties to the Fed, i'm betting ALGO is on the U.S.'s short list.
placing my next round of buy orders on this $1.30 support. price may dip further to retest either of the major bull trendlines, but i don't think the probability is high enough to risk waiting.
this is (not coincidentally) right around the same level i was buying last time:

ALGO - buying more !!In the past it has never been a bad idea to buy at these oversold levels !!
RSI around 33-34 level has many times been a good indicator.
Moreover ALGO is right above support !

ALGO we tested 0.38 FibBINANCE:ALGOUSDT
✅Before we start to discuss, I would be glad if you share your opinion on this post's comment section and hit the like button if you enjoyed it.
Thank you.
Possible Targets
➡️We tested 0.38 Fib global chart since 2019. (1.39$)
➡️I mention how much % Algo made last 2 times when we touch bottom on 1D on RSI
➡️According by cup and handle pattern what I've mention in previews ideas ALGO should reach 3.44$
➡️We got huge wick candle on 1D if we hold 0.38 fib we will go in to this imbalance zone 3-4$
➡️Worse case scenario if btc going to 44-40K we can see retest support global line and test 0.23 level by fib around 1$
➡️Targets still relevant for Algo 3.45$ - 5.52$
Hope you enjoyed the content I created, You can support with your likes and comments this idea so more people can watch!
✅Disclaimer: Please be aware of the risks involved in trading. This idea was made for educational purposes only not for financial Investment Purposes.
Don't forget sub and join my channels under this idea!

ALGORAND- Updated Chart with Key Levels 🕺Updated chart for ALGORAND which had a nice recent Pump and Dump that hit our 3 previous targets.
Remember: Buying and Holding will get you places but learning how to take profits and buying the dips will take you there faster...
3 Reasons to Buy Algorand :
1. Interoperability
2. Smart contracts
3. Algorand's growth potential is impressive
For hypergrowth investors, finding investments that provide unique competitive advantages and moats is important. In the cryptocurrency world, there is certainly no shortage of such options.
However, Algorand's unique network provides interoperability along with functionality that is truly enticing.
Of course, like other digital tokens, Algo is not without risk. This token's value depends upon the market consensus of its value, and the value of the underlying Algorand network. Accordingly, volatility can be expected.
However, those seeking a hypergrowth option in the cryptocurrency space today have reason to consider Algo. This is one of the top cryptocurrencies I've got on my watch list right now.
One Love,
the FXPROFESSOR

Algorand (ALGO) - December 7Hello?
Welcome, traders.
If you "follow", you can always get new information quickly.
Please also click "Like".
Have a nice day.
-------------------------------------
(ALGOUSD 1W Chart) - Mid-Long-Term Perspective
Above 0.76754798 point: Expected to create a new wave.
(1D chart)
First resistance section: near point 2.30117362
Second resistance section: 2.84473154-3.02591751
First support section: near point 1.21405778
Second support section: 0.67049985-0.85168582
A move above the 1.97455023 point is needed to see if it can accelerate the uptrend.
If they do, they should check to see if they find support at the 1.57642973-1.75761570 zone.
The price should hold above the 1.35658321 point to continue the uptrend.
Accordingly, a short-term Stop Loss is required if the price declines from the 1.57642973 point.
------------------------------------------
(ALGOBTC 1W chart)
6469 Satoshi point or higher: Expected to create a new wave.
Above the 2886 Satoshi point: It is likely to turn into an uptrend and continue the uptrend.
------------------------------------------
We recommend that you trade with your average unit price.
This is because, if the price is below your average unit price, whether the price trend is in an upward trend or a downward trend, there is a high possibility that you will not be able to get a big profit due to the psychological burden.
The center of all trading starts with the average unit price at which you start trading.
If you ignore this, you may be trading in the wrong direction.
Therefore, it is important to find a way to lower the average unit price and adjust the proportion of the investment, ultimately allowing the funds corresponding to the profits to be able to regenerate themselves.
------------------------------------------------------------ -------------------------------------------
** All indicators are lagging indicators.
Therefore, it is important to be aware that the indicator moves accordingly with the movement of price and volume.
However, for convenience, we are talking in reverse for the interpretation of the indicator.
** The MRHAB-O and MRHAB-B indicators used in the chart are indicators of our channel that have not been released yet.
(Since it was not disclosed, you can use this chart without any restrictions by sharing this chart and copying and pasting the indicators.)
** The wRSI_SR indicator is an indicator created by adding settings and options to the existing Stochastic RSI indicator.
Therefore, the interpretation is the same as the traditional Stochastic RSI indicator. (K, D line -> R, S line)
** The OBV indicator was re-created by applying a formula to the DepthHouse Trading indicator, an indicator disclosed by oh92. (Thanks for this.)
** Support or resistance is based on the closing price of the 1D chart.
** All descriptions are for reference only and do not guarantee a profit or loss in investment.
(Short-term Stop Loss can be said to be a point where profit and loss can be preserved or additional entry can be made through split trading. It is a short-term investment perspective.)
---------------------------------

ALGOUSDT , Amazing movement ...Hello everyone
Its one of the amazing chart that we analysed , it has amazing movement
According to the chart, after parabolic upward movement and complete waves, we expect the correction is omig toward the first support zone of trendline and if the price break this level, the price can drop to other levels of support zone.
If you need any help just tell us and send us messages in private
Good Luck
Abtin


ALGO 2022 projectionThe way I'm looking at it, ALGO will either under perform or do a 10x from current levels by the end of 2022.

revised targetsstill right on track from my previous ALGO idea , but revising the upcoming targets based on the latest data. specifically noting the new strong support at $1.52 and that crazy wick up to $2.99, making $3.00 an excellent target.

algo double topalgorand is a great project and have a planty of good news. now it made a double top (ignore that huge shadow) and can make its way to the top

algo/usdTesting/tracking elliot wave theory. Please do not trade off idea without S/L. Not financial advice.

Algo Buy Setup Algo is Ready to Fly Again..
Entry below 1.800
Targets.
1.9600
2.2000
2.5000
2.8000
3.2000.
Stop loss :- 1.5900

ALGOUSD Fibonacci CircleI have drawn up some Fib circle describing a bullish move to a spot that has been a previous trend rejection point (red ovals)
Price comparison points can be drawn between the green ovals
Major trendline in bold white line
The Cup and Handle pattern is an addition that supports the bull idea

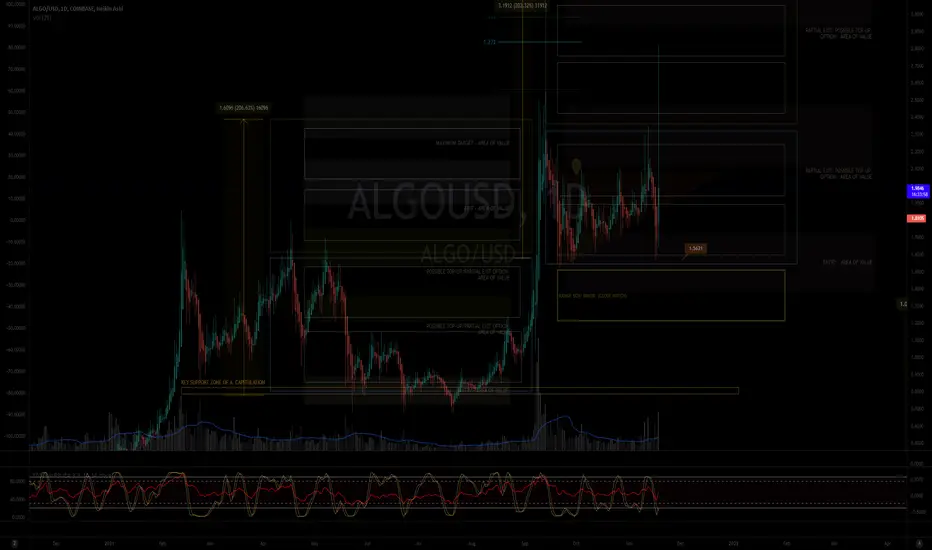
MY MINIMALIST CHART ANALYSIS FOR ALGORAND $ALGO
ON TRACK WITH OUR TARGET AREA OF VALUES
11.18.21
1422H +8 SINGAPORE
Disclaimer:
The findings of the following analysis are the sole opinions of the publisher of this idea and should not be taken as a piece of investment advice.
ALERT:
VITAL SIGN A-OK, WE WILL FINISH THIS SWING.
The Market has amazingly moved along the TOPS and BOTTOMS of our BOXES, signifying TURNING POINTS of PRICE ACTION.
We are now looking at an ENTRY that we can TOP-UP for our Investment FIB 0.618.
Congratulating all those who have climbed the SWING together with me.
REMINDER:
INDICATED ARE ENTRIES, PARTIAL EXITS/TOP-UPS, EXITS, and MAXIMIZED AREAS OF VALUE
"FOLLOW THE WHITE RABBIT!"
Just Follow the TOPS and BOTTOMS of the BOXES as a GUIDE where the MARKET will take you.
HOW TO USE THIS MINIMALIST CHART
Created on a MONTHLY, WEEKLY & DAILY Analysis (The Dynamics of the Market.)
It is designed for SWING TRADES at the BOTTOM. I do not SHORT, though, you can still use it.
You can CLICK AND hold THE CHART and PAN or DRAG IT.
TARGET ZONE IDENTIFICATION
The LARGE BOXES (Tops and Bottoms) are MAJOR pivot points that will occur sometime in the future. While the SMALL BOXES (Tops and Bottoms) are MINOR pivot points.
These can be entries to a BUY/ SELL POSITION, EXIT/PARTIAL EXIT/TOP-UP AREAS,
and, if you wish to hold longer for a MAXIMUM TARGET EXIT AREA OF VALUE - CONSERVATIVE (If price action conditions are right at that given moment.)
At times I include WAY BEYOND PARABOLIC Price TARGETS depending on The Character of the Market (CRYPTOS ONLY).
Watch out for your Volume, Chart Patterns, Candlestick Math, FIB COILS ( ABC ), Price Action, FIB LEVELS, Market Dynamics, especially institutional and retailer trading psychology.
Wishing you all The Best Trades and Thank you all for your Appreciation and Support of My Work.
Much thanks to My 3 Mentors. They are so much of a Blessing that I also wish to Share.
Vive Le Autist!
Vive Le Egalitarianism!

Algo has reach the bottom of this correctionAfter the correction that we just saw, it is just a matter of time before we bounce right back up.
My entry point is right now $1.69 the RSI is very low the MACD is also very low indicating a promising bounce.
The next few hours are important, if BTC can hold the line at $60K then we will see a quick turn around.
If the support breaks, the next stop is $52K so it will take a bit longer to recover.
We have 2 supports, one at $1.49 and another at $1.19, but I really don't think we will make it to that and this is why I prefer to get in right now, even if it will drop a little further still.
TP1: 2.03, (50%)
TP2: 2.23, (50%)

Algorand (ALGO) - November 15Hello?
Welcome, traders.
By "following", you can always get new information quickly.
Please also click "Like".
Have a nice day.
-------------------------------------
(ALGOUSD 1W Chart) - Mid-Long-Term Perspective
Above 0.76754798 point: uptrend expected to continue
(1D chart)
First resistance section: near point 2.30117362
Second resistance section: 2.84473154-3.02591751
Support section: 1.57642973-1.75761570
We need to see if we can sustain the price above the 1.90329264-1.97455023 segment.
If it goes down, you should check to see if you find support in the support zone.
If the price holds above the 1.90329264-1.97455023 range, I would expect a move to move above the first resistance level.
------------------------------------------
(ALGOBTC 1W chart)
4309 Satoshi-6469 Satoshi section or more: Expected to create a new wave.
Above the 2886 Satoshi point: Expected to turn to an uptrend.
Currently, it is forming a box section below the 4309 Satoshi point and walking sideways.
------------------------------------------
We recommend that you trade with your average unit price.
This is because, if the price is below your average unit price, whether it is in an uptrend or in a downtrend, there is a high possibility that you will not be able to get a big profit due to the psychological burden.
The center of all trading starts with the average unit price at which you start trading.
If you ignore this, you may be trading in the wrong direction.
Therefore, it is important to find a way to lower the average unit price and adjust the proportion of the investment, ultimately allowing the funds corresponding to the profits to regenerate themselves.
------------------------------------------------------------ -----------------------------------------------------
** All indicators are lagging indicators.
Therefore, it is important to be aware that the indicator moves accordingly with the movement of price and volume.
However, for the sake of convenience, we are talking in reverse for the interpretation of the indicator.
** The MRHAB-O and MRHAB-B indicators used in the chart are indicators of our channel that have not yet been released.
(Since it is not publicly available, you can use this chart without any restrictions by sharing this chart and copying and pasting the indicators.)
** The wRSI_SR indicator is an indicator created by adding settings and options to the existing Stochastic RSI indicator.
Therefore, the interpretation is the same as the traditional Stochastic RSI indicator. (K, D line -> R, S line)
** The OBV indicator was re-created by applying the formula to the DepthHouse Trading indicator, an indicator disclosed by oh92. (Thanks for this.)
** Support or resistance is based on the closing price of the 1D chart.
** All descriptions are for reference only and do not guarantee a profit or loss in investment.
(Short-term Stop Loss can be said to be a point where profit and loss can be preserved or additional entry can be made through split trading. It is a short-term investment perspective.)
---------------------------------

algorand algo algousd#1
algorand algo algousd
algorand algo algousd
algorand algo algousd
algorand algo algousd


UNISWAP BREAKOUT and LAUNCH coming soon!UNISWAP has broken out of large pennant flag with retest of the Trendline and bounce above last candle high. Rising MACD with cross Above ZERO Line. Similar chart to LINK, ALGO, and so many other crypto charts. RISK 1% of my account.
Entry = $ 26.70
SL = $21.82
TP = $53
R = 5.4

