Algo explosion by end of OctoberThe last time the weekly RSI was at these levels there was a massive move upward (486%) in the following 4-5 weeks. If we see the same result as last time, algo could move as high as $5.90 (unrealistic in my opinion) or at least $2.50s. With goverance happening in October, I don't see a scenario where algo doesn't move up, and quick.
Algousd


ALGO POISED FOR BULLISH MOVE?#ALGO looking naughty on the weekly timeframe, and currently approaching that key golden ratio on the fib retracement from the ATH set earlier this year!

Local Bottoms and Local TopsWithout fail, Algorand has stuck to this pattern for over 7 months now. Roughly every 30 days is a local bottom. The most recent doesn't seem like a bottom because on the chart it is in the same range algo had been bound to for quite awhile.
My target for the next local top, meaning within the next 18-25 days, is in yellow.

ALGORAND- Our ChartI don't touch projects that go to 3,4 then back to half a dollar.. Something is fundamentally wrong.
You asked for the chart and with all my love: Here it is!
I hope it helps, price at major res/sup level and let's see what happens.
Again, I am NOT touching it
the FXPROFESSOR

ALGO: Clear for TakeOffAlgo moving on high volatility with upward trajectory on all time scales examined. Easily tradeable today on 1-5% margins as it heads towards $1.45 (95% confidence intervals).
Best regards and happy trading,
Dr. Nick2Keul

Altseason has officially started"September 18 will change everything and be the catalyst Algorand needs. Opulous at the most popular venue in the world announcing to the world “We go with Algorand” and then the huge musical artist. The world will listen. Then governance in October. Then AlgoMint, TinyMan, and AlgoDEX by end of year… maybe xBacked too. Some surprises possibly in between.. and hopefully CBDC. The rest of the year is ripe for gains and growth of the ecosystem"
Michael Jordan in "I believe I can fly" featuring MC Hammer who "can't touch this".

#Algo to the Moon!Hello, my dear padawans,
This is my first review, chart analysis on ALGOUSD.
I always love to draw chart patterns, to discover something we can explore to my padawans.
Do not take this as a piece of financial advice.
Let's see what's gonna happen next.
may the force be with you.
Cheers.

ALGOUSDT : go for long ?? As we can see, after breaking its downward trend, the price is gathering strength to start a strong climb.
In order to buy, the SL (stop loss) and capital management must be observed.
All resistances and TPs (take profits) are marked on the chart.
(DYOR)

ALGO - My Trading Plan in 3 mins!Hello everyone, if you like the idea, do not forget to support with a like and follow.
Here is the top-down analysis for ALGO, feel free to request any pair/instrument or ask any questions in the comment section below.
Best of luck!


Algorand (ALGO) - august 10Hello?
Welcome, traders.
By "following", you can always get new information quickly.
Please also click "Like".
Have a nice day.
-------------------------------------
(ALGOUSD 1W Chart)
If the price is maintained above the 0.5221395-0.76754798 range, it is expected to create a new wave.
(1D chart)
If the price is maintained in the 0.65798713-0.92350974 range, it is expected to turn into an uptrend.
However, in order to continue the uptrend, it must break out of the downtrend line.
If it goes down, you should check to see if it finds support at the 0.52522584-0.65798713 zone.
-------------------------------------
(ALGOBTC 1W chart)
We are walking sideways in the section 1075 Satoshi-6469 Satoshi.
If the price is maintained above the 1970 satoshi-2886 satoshi range, it is expected to turn into an upward trend.
To continue the uptrend, it must rise above the 4309 Satoshi point.
If it rises above the 6469 Satoshi point, it is expected to create a new wave.
(1D chart)
If it finds support at the 1820 satoshi point and moves above the 2147 satoshi point, I would expect it to turn into an uptrend.
If the volume profile section spanning the 2452 Satoshi-2886 Satoshi section is exceeded upward, it is expected to continue the upward trend.
If it falls from the 1820 Satoshi point, it may enter the mid- to long-term investment area, so careful trading is required.
------------------------------------------
We recommend that you trade with your average unit price.
This is because, if the price is below your average unit price, whether it is in an uptrend or in a downtrend, there is a high possibility that you will not be able to get a big profit due to the psychological burden.
The center of all trading starts with the average unit price at which you start trading.
If you ignore this, you may be trading in the wrong direction.
Therefore, it is important to find a way to lower the average unit price and adjust the proportion of the investment, ultimately allowing the funds corresponding to the profits to regenerate themselves.
------------------------------------------------------------ -----------------------------------------------------
** All indicators are lagging indicators.
Therefore, it is important to be aware that the indicator moves accordingly with the movement of price and volume.
However, for the sake of convenience, we are talking in reverse for the interpretation of the indicator.
** The wRSI_SR indicator is an indicator created by adding settings and options to the existing Stochastic RSI indicator.
Therefore, the interpretation is the same as the traditional Stochastic RSI indicator. (K, D line -> R, S line)
** The OBV indicator was re-created by applying a formula to the DepthHouse Trading indicator, an indicator disclosed by oh92. (Thanks for this.)
** See support, resistance, and abbreviation points.
** Support or resistance is based on the closing price of the 1D chart.
** All descriptions are for reference only and do not guarantee a profit or loss in investment.
Explanation of abbreviations displayed in the chart
R: A point or section of resistance that requires a response to preserve profits.
S-L: Stop Loss point or section
S: A point or section where you can buy to make a profit as a support point or section.
(Short-term Stop Loss can be said to be a point where profit and loss can be preserved or additional entry can be made through split trading. It is a short-term investment perspective.)
GAP refers to the difference in prices that occurred when the stock market, CME, and BAKKT exchanges were closed because they are not traded 24 hours a day.
G1 : Closing price when closed
G2: Opening price
(Example) Gap (G1-G2)

Algousdt BuyHello Traders!
The market is getting strong and we will find opportunities to trade and make a profit from the bullish coins.
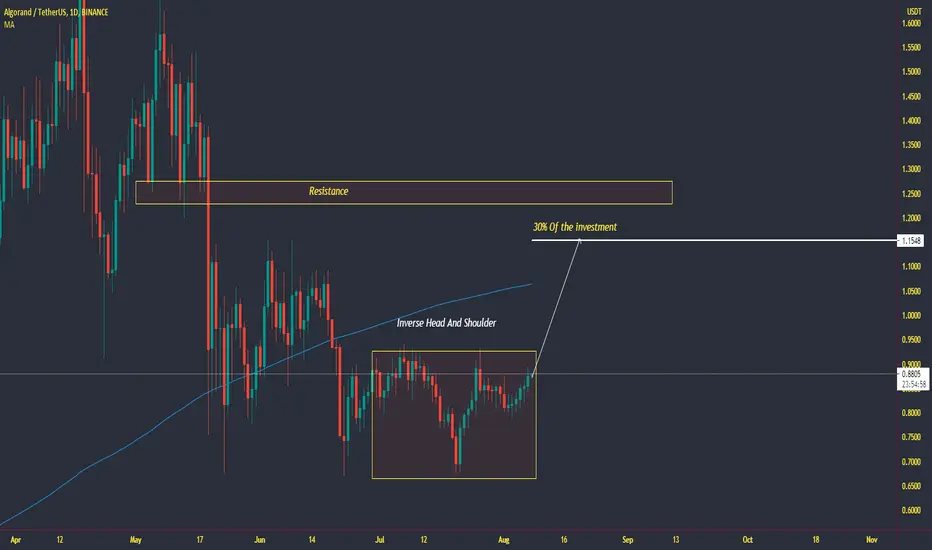
This is AlgoUSDT analysis, it looks like it has formed an Inverse H&S pattern and after the breakout, it will make big bullish candles.
The target is 30% of the investment and Max margin you can use is 5x to boost the profit.
Don't Forget to hit the like button and follow to stay connected
ALGOUSDT Flag Pattern!ALGOUSDT Technical analysis Update
ALGO/USDT currently trading at $0.8438
Flag Pattern
Buy level: Above $0.840
Stop loss: $0.800
TP1: $0.865
TP2: $0.910
TP3: $0.99
Max Leverage 3x
Always keep Stop loss
Note: please do your own research before investing. Never invest money that you can't afford to lose.

Algo possible bull flag and descending triangle breakout?In this analysis we will be going over algorand flag pattern that could potentially be breaking ALGO out of the larger descending triangle .
Algo has recently triple bottomed, is currently forming a bull flag and is looking to jump out of a descending triangle . If the top of the bull flag resistance line is popped the price action will head upward the same length of the bull flags pole. This would break the price action out above the macro pattern of the descending wedge pattern we have been in for 2.5 months.
Currently the price action is bouncing off of the .5 fib line after the retrace from the recent high (the resistance line of the descending triangle ) that helped formed the macro descending triangle formation Algo is currently in.
This one looks ready to move as long as Bitcoin plays nicely.
Have a green and prosperous week!

Waiting for confirmations breakout algorand to entry.This is my ideas for algorand. i hope this can help your analysis

Take Long on Algo #Algo $AlgoGood Time to take a long position on Algo!
Currently, due to the increase in the bitcoin range and its movements, all altcoins will be affected by it. The analysis is just a series of probabilities.
I hope you find this analysis useful🌹
Follow for more...

Algorand (ALGO) - July 18Hello?
Welcome, traders.
If you "follow", you can always get new information quickly.
Please also click "Like".
Have a good day.
-------------------------------------
(ALGOUSD 1W Chart)
If the price holds above the 0.76754798 point, we expect the uptrend to continue.
(1D chart)
If the price is maintained in the 0.65798713-0.92350974 range, it is expected to turn into an upward trend.
If it falls in the range of 0.52522584-0.65798713, there is a possibility of entering the mid- to long-term investment area, so careful trading is required.
A move above the 0.92350974 point would suggest a move to break above the downtrend line.
-------------------------------------
(ALGOBTC 1W chart)
If it rises in the sideways section of 1075 Satoshi-4309 Satoshi, it is expected to create a new wave.
(1D chart)
If the price is maintained in the 2374 Satoshi-2792 Satoshi section, it is expected that the upward trend will continue.
If it falls from the 2374 satoshi point, it can touch the 1747 satoshi-1956 satoshi section, so Stop Loss is necessary to preserve profit and loss.
However, since it will be located within the section that previously showed the volatility of the 716 Satoshi-3888 Satoshi section, you need to think about how to set up a buying opportunity.
------------------------------------------
We recommend that you trade with your average unit price.
This is because, if the price is below your average unit price, whether it is in an uptrend or in a downtrend, there is a high possibility that you will not be able to get a big profit due to the psychological burden.
The center of all trading starts with the average unit price at which you start trading.
If you ignore this, you may be trading in the wrong direction.
Therefore, it is important to find a way to lower the average unit price and adjust the proportion of the investment, ultimately allowing the funds corresponding to the profits to regenerate themselves.
------------------------------------------------------------ -----------------------------------------------------
** All indicators are lagging indicators.
Therefore, it is important to be aware that the indicator moves accordingly as price and volume move.
However, for the sake of convenience, we are talking in reverse for the interpretation of the indicator.
** The wRSI_SR indicator is an indicator created by adding settings and options to the existing Stochastic RSI indicator.
Therefore, the interpretation is the same as the traditional Stochastic RSI indicator. (K, D line -> R, S line)
** The OBV indicator was re-created by applying a formula to the DepthHouse Trading indicator, an indicator disclosed by oh92. (Thanks for this.)
** See support, resistance, and abbreviation points.
** Support or resistance is based on the closing price of the 1D chart.
** All descriptions are for reference only and do not guarantee a profit or loss in investment.
Explanation of abbreviations displayed in the chart
R: A point or section of resistance that requires a response to preserve profits.
S-L : Stop Loss point or section
S: A point or section where you can buy to make a profit as a support point or section
(Short-term Stop Loss can be said to be a point where profit and loss can be preserved or additional entry can be made through split trading. It is a short-term investment perspective.)
GAP refers to the difference in prices that occurred when the stock market, CME, and BAKKT exchanges were closed because they are not traded 24 hours a day.
G1 : Closing price when closed
G2: Opening price
(Example) Gap (G1-G2)

ALGOUSD H8: BEST Level to SHORT IT 25/35% gains(SL/TP)(NEW)Why get subbed to me on Tradingview?
-TOP author on TradingView
-15+ years experience in markets
-Professional chart break downs
-Supply/Demand Zones
-TD9 counts / combo review
-Key S/R levels
-No junk on my charts
-Frequent updates
-Covering FX/crypto/US stocks
-24/7 uptime so constant updates
ALGOUSD H8: BEST Level to SHORT IT 25/35% gains(SL/TP)(NEW)
IMPORTANT NOTE: speculative setup. do your own
due dill. use STOP LOSS. don't overleverage.
Tagged as SHORT as I expect more losses
short and mid term.
🔸 Summary and potential trade setup
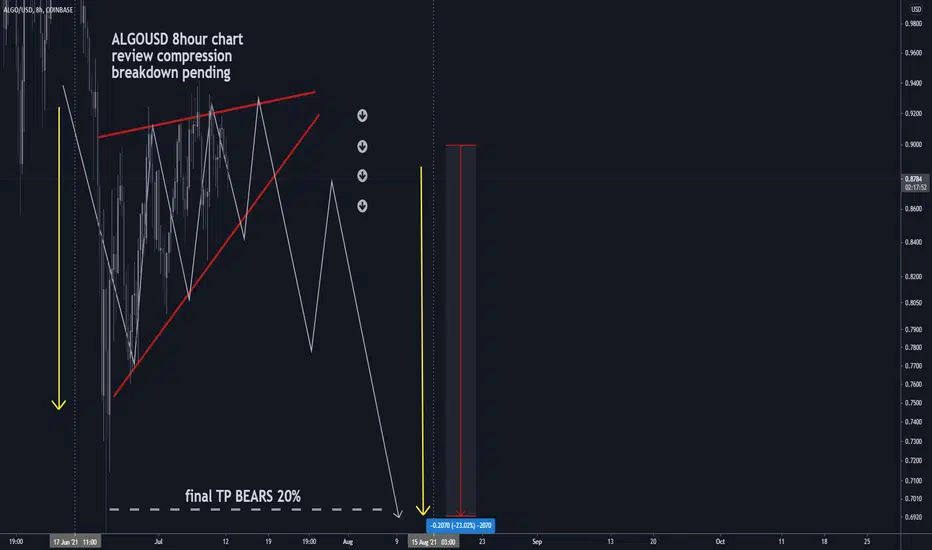
::: ALGOUSD 8hour chart review/outlook
::: compression into wedge now
::: breakdown pending
::: expecting 25%/35% correction
::: shorting from here is a nice trade
::: BEARS will target recent cycle lows
::: TP Bears is +25%/+35% gains
::: no valid setups for bulls now
::: later after pullback/correction
::: bulls may look at buying low
::: recommended strategy: SHORT IT
::: short at market / short rallies/rips
::: SWING TRADE: SHORT/HOLD IT
::: correction not over yet
::: good luck traders!
::: SHORT and get paid. period.
🔸 Supply/Demand Zones
::: N/A
::: N/A
🔸 Other noteworthy technicals/fundies
::: TD9 /Combo update: N/A
::: Sentiment mid-term: BEARS
::: Sentiment outlook short-term: BEARS
RISK DISCLAIMER:
Trading Crypto, Futures , Forex, CFDs and Stocks involves a risk of loss.
Please consider carefully if such trading is appropriate for you.
Past performance is not indicative of future results.
Always limit your leverage and use tight stop loss.

Will ALGO/USDT make the bullish movement?Hi every one
ALGORAND / TETHERUS
ALGO/USDT is forming an ascending triangle which means after the breaking of this pattern we can be sure that the price will increase as much as the measured movement!( AB=CD )
Traders, if you liked this idea or have your opinion on it, write in the comments, We will be glad.
Things can change...
The markets are always changing and even with all these signals, the market changes tend to be strong and fast!!
Thank you for seeing idea .
Have a nice day and Good luck

$ALGO Long or Short? DAILY UPDATEBullish indicators: Breakout & retest of orange wedge as support. If it breaks out with force chances are we could see it make a nice lil run without the retest
Bearish indicators: Sitting in a larger wedge which shows signs that we could see another retest on the downside

ALGOUSDT(1H CHART) Trend BreakoutALGOUSDT (1H CHART) Technical Analysis Update
ALGOUSDT (1H CHART) currently trading at $0.831
Sell level: Below $0.833
Stop loss: Above $0.891
Target 1: $0.794
Target 2: $0.765
Target 3: $0.711
Max Leverage: 3X
ALWAYS KEEP STOP LOSS...
Follow Our Tradingview Account for More Technical Analysis Updates, | Like, Share and Comment Your thoughts.
