ALGOUSD about to complete wave 4So far EW count on Algorand looks reasonable. Wave 5 could be extended, since wave 3 was not. Let's see how this plays out.
Please remember, that alternative cryptocurrencies (altcoins) are depending heavily on Bitcoin.
Algousd

Buying ALGO EverdayAveraging into ALGO everday. Algo ofers 4% APY via Coinbase.
You can watch the newest video on my youtube channel which goes over this in detail.

Algorand, the trilemma-solverAfter plotting the local bottom pattern, which is 30days exactly between local bottoms, I extended that bottom pattern out for the next two months. I also used a sine wave to plot the local bottoms since the beginning of the february pump. My targets are based on the range made from each local bottom to its local top. I also placed what I believe, based on the pattern, will be the next two 30 day bottoms (yellow circles)

Algorand is primed, yet again!Currently a falling wedge on the daily, with 3 touches on both the bottom and the top.
As with my last chart, I believe a target for this local top to be between $1.12 and $1.46.
NFA.

Algorand targetsI took a measured move from each local bottom to local top for the last 4 "pumps" we've seen since the big pump in February. I placed these four lines on our new local bottom to get an idea of what to expect from this next 30 day cycle.
If we are to expect algorand to make a move similar to the last four it has made, we should see a local top between $1.12 and $1.46, and I would say that sub $1.20 is more likely than above it.
NFA.

ALGO - Detailed Video Analysis!Hello everyone, if you like the idea, do not forget to support with a like and follow.
Here is the top-down analysis for ALGO, feel free to request any pair/instrument or ask any questions in the comment section below.
Best of luck!

Algo is very consistentOver the last 5 months algorand has been following this bottom pattern. The local lows are all 30 days apart from each other, except one which is 29 days.. Yesterday was the 30 day bottom, so we can conclude that, if the trend continues, 30 days from now is the next new bottom.
Additionally, from local bottom to local top, all 4 cycles have increased over 65%. I'm going to put my money on algo repeating the cycle yet again. Even if it is a lower high, it is possible to reach 1.26 in the next 3 weeks.
DYOR, NFA.

Does Algorand have hidden potential that's about to be released?Hi Guys
Quick disclaimer please do your own research and do not trade based on my opinion; this is not professional advice. Let's get going:
CHART OVERVIEW
Here is a daily chart for ALGO/USDT on Binance. I've marked out specific points which could be pointing towards a Wyckoff Reaccumulation Pattern. The pattern has not be completed so it can very well fail but if it plays out here's what can happen.
Analysis
This pattern has a number of phases I'll briefly go through, the preliminary supply, this point marks the entry of the professional or "composite man" as Wyckoff put it, big financial operators who have identified an valuable asset and want to add as much of it as possible to their bag. This phase they are attempting to shake out investors in order to pause the uptrend, once they shake enough out, a short sharp up thrust occurs resulting in a "buyers climax".
At this point their is an "automatic reaction" sending the price plummeting. After this the composite man (CM) will establish resistance points and support points in with secondary test (ST) in order to create a trading range in which to encourage selling from the public and accumulate as much of the asset from them as possible. Their will be a major Upthrust (UT) and then a laboured long decline all the way to the bottom of support in order to significantly shakeout small investors.
Once the bottom is reached their is a "Spring" all the way out of the reaccumulation zone, a few tests will be made to make sure their is enough demand and strength to continue the uptrend, once a significant "Sign of Strength" (SOS) occurs with a high volume uptrend a small shakeout at the high resistance points occur and after the bullish uptrend continues.
What do you guys think, is this possible? Thanks for taking the time to read this.

ALGO formed Ascending TriangleLets see from where it breaks out. Also keep your eyes on BTC Death Cross. BINANCE:ALGOUSDT

#ALGO may see a push towards $1.50The market is green right now, we may see a nice push up too $1.50 if this momentum continues and the Volume picks up. There is a bunch of Positive news around Algorand right now, more and more projects and integration into Cities and Businesses every single day.
*Not Financial Advice


Algorand (ALGO) - June 15Hello?
Welcome, traders.
By "following", you can always get new information quickly.
Please also click "Like".
Have a good day.
-------------------------------------
(ALGOUSD 1W Chart)
If the price holds above the 0.76754798 point, we expect the uptrend to continue.
(1D chart)
We need to see if we can move higher from the 0.92350974-1.18903235 zone and move above the downtrend line.
If it finds support by moving up to the 1.18903235-1.32179365 section, it is expected to lead to further upside.
However, if it declines, it is expected that the downward trend will continue, so careful trading is required.
-------------------------------------
(ALGOBTC 1W chart)
To create a new wave, it must rise above the 4309 Satoshi point.
It remains to be seen if support at the 2452 Satoshi point can be found and continue the uptrend along the uptrend line.
If it falls below the 1970 Satoshi point, it may take a long time to rise as it enters the mid- to long-term investment area.
Therefore, careful trading is required.
(1D chart)
It remains to be seen if we can climb to the 2792 satoshi-3000 satoshi section.
If it falls from the 2374 Satoshi point, Stop Loss is required to preserve profit and loss.
If it does not fall below the downtrend line, it is likely to rise, so careful trading is required.
------------------------------------------
We recommend that you trade with your average unit price.
This is because, if the price is below your average unit price, whether it is in an uptrend or in a downtrend, there is a high possibility that you will not be able to get a big profit due to psychological burden.
The center of all trading starts with the average unit price at which you start trading.
If you ignore this, you may be trading in the wrong direction.
Therefore, it is important to find a way to lower the average unit price and adjust the proportion of the investment, ultimately allowing the funds corresponding to the profits to regenerate themselves.
------------------------------------------------------------ -----------------------------------------------------
** All indicators are lagging indicators.
Therefore, it is important to be aware that the indicator moves accordingly with the movement of price and volume.
However, for the sake of convenience, we are talking in reverse for the interpretation of the indicator.
** The wRSI_SR indicator is an indicator created by adding settings and options to the existing Stochastic RSI indicator.
Therefore, the interpretation is the same as the traditional Stochastic RSI indicator. (K, D line -> R, S line)
** The OBV indicator was re-created by applying a formula to the DepthHouse Trading indicator, an indicator disclosed by oh92. (Thanks for this.)
** See support, resistance, and abbreviation points.
** Support or resistance is based on the closing price of the 1D chart.
** All descriptions are for reference only and do not guarantee a profit or loss in investment.
Explanation of abbreviations displayed in the chart
R: A point or section of resistance that requires a response to preserve profits.
S-L: Stop Loss point or section
S: A point or section where you can buy to make a profit as a support point or section.
(Short-term Stop Loss can be said to be a point where profit and loss can be preserved or additional entry can be made through split trading. It is a short-term investment perspective.)
GAP refers to the difference in prices that occurred when the stock market, CME, and BAKKT exchanges were closed because they are not traded 24 hours a day.
G1 : Closing price when closed
G2: Opening price
(Example) Gap (G1-G2)

Possible small gain on a flat marketThe ALGO market is going sideways at the moment, but there is a chance for a small profit over the next few days.
The weekends are normally fairly flat, so, in an already flat market, I don't expect anything wild to happen
TP1: $1.16
TP2: $1.28 (but I don't see us breaking the 0.236 fib)
I won't use a stop loss as I trust the long term project, but I would probably set one around $0.95

ALGORAND - Buy Setup Forming!As per one of my ideas, we were waiting for ALGO to approach the green support to look for buy setups. (attached below)
Then we looked for a buy setup on H1 (also attached below)
NOW WHAT?
ALGO is still sitting around the green support and getting stuck in a range in the shape of a big ascending triangle as you can see in red.
Before we buy, we want the buyers to prove that they are taking over again.
on H4: we will be waiting for ALGO to break (candle close) the ascending triangle upward (projection in purple)
preferably after forming a new swing high around it.
Meanwhile, until the buy is activated, ALGO can still test the green support before upward.
Good luck!
All Strategies Are Good; If Managed Properly!
~Rich

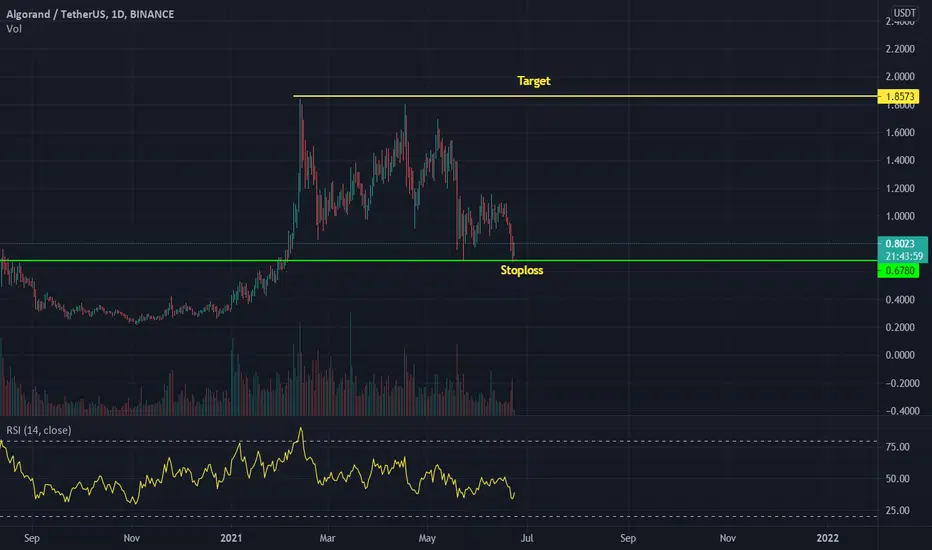
Algo going to correct ... time to short✅ short: 1.10 - 1.25 ✅
🎯TARGETS:
1- 80 cent
2- 73 cent
3- 65 cent
💵 Trade Size: 3-5% of Portfolio - leverage: X3
🚫Invalidation(SL): 1.39
please click LIKE button and Appreciate my hard work.
Must follow me for latest crypto real time updates.
Thank you.


ALGO - Wait For The Trigger!Hello everyone, if you like the idea, do not forget to support with a like and follow.
Here is the top-down analysis for ALGO, feel free to request any pair/instrument or ask any questions in the comment section below.
Best of luck!


ALGO/USD Possible Bullish Bat PatternTaking a look at ALGO/USD, it looks to be completing the C wave of a Bullish Bat Patten. Normally, I don't necessarily like to trade harmonic patterns, gartleys, or bats in the crypto market. It is a good tool for really technical traders who want to find a spot-on target. However, the crypto market is too volatile to expect such things. So I tend to stay away from them and look for mid-long term trends, patterns. That being said, expect this bullish bat pattern to trade within a range. You can use this pattern to find an entry range towards the end of wave c, and catch point D heading back up. Furthermore, point D, the completion of this pattern, coincides with the main trend line marked yellow. I would look to enter just above this point if you are looking to get your order filled.
Fibonacci Analysis: It's always nice to see the initial correction bounce off the .618 in a bull market, which ALGO did, as seen with the blue arrow. But in this case, we will just use this as a sign that ALGO is trading healthy and keep an eye out for these key fib levels. I usually like to use these key fib levels in beautiful elliot wave patterns, not necessarily bat patterns.
Hidden bullish divergence: IF this pattern continues down to the yellow trend line or around that area, I would expect the RSI to achieve a lower low. This would still indicate a higher low in price. This would confirm a hidden bullish divergence. If this is true, then we could say that ALGO is in fact bullish on several levels.
Conclusion: Bullish Bat pattern, bullish fib bounce, hidden bullish divergence. Great entry point around POINT D. Can take profits at previous high and above. I will stay neutral for now because I do not short. But I will say LONG at the completion of this pattern. Of course...... I could be totally wrong.

ichimoku trade : short positionichimoku signal:
short position:
enter at 0.93$
stop loss kijunsen with buffer

Have a look ... +150% potential for Algo 👌technically, we wont see Algo under 50 cents again unless bull run is over n actually it is not yet.
Algorand fundamentally from strong projects that have a great technology that's why it jumped from 8 cent to $1.80 !
82 cents is strong support n will hold in the worst correction scenario.
Algorand is a prefect choice for long term investment, it may rich 6$ n $9 maximum in the near longterm.
but we still have a great potential to go up.
Try to have some in ur portfolio.
✅ Buy: 1.25 - 1.00 ✅
🎯TARGETS:
1- $1.58
2- $1.80
3- $2.40
4- $3.30
💵 Trade Size: 5-7% of Portfolio
🚫 Stop loss: daily candle close below 0.825
Please click LIKE button and Appreciate my hard work.
Must follow me for latest crypto real time updates.
Thank you.

$ALGO - 1W close above 1.47 all we needLets fill all those down candles
Close above 1.47 on 1W and we increase the chances of doing so a lot
