ALGOUSDT: Possible Long (11.11.2020)At D1, the price has broken the downtrend line. An initial growth impulse was formed.
On H4, the price is forming a local correction, which can take the form of a Zagzag. It is highly likely that the price will test the 76.4% Fibonacci correction level, where the RSI reaches the oversold level.
We recommend taking a long when the price reaches the $ 0.24 level in order to keep the position above $ 0.35.
Algousd

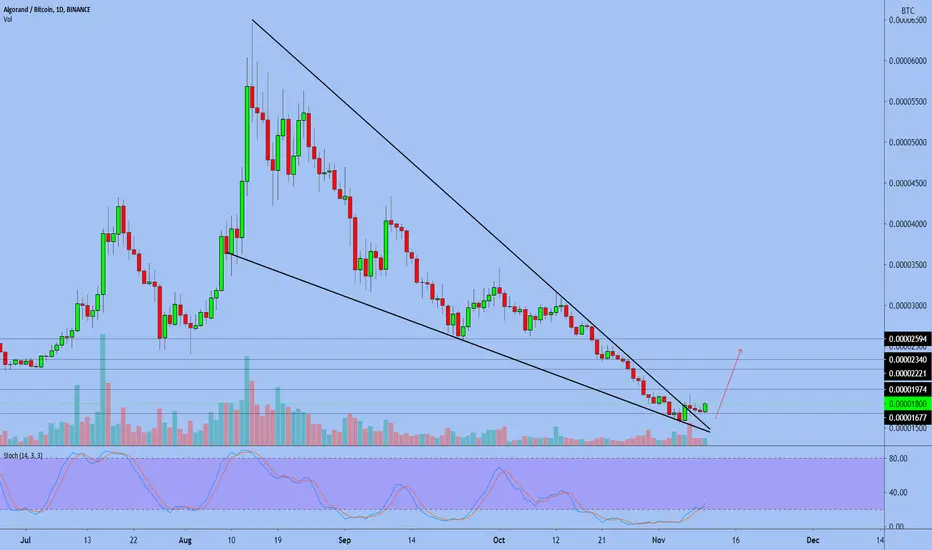
Algorand ALGOALGO/BTC formed a falling wedge
Break out and tested
Interesting formation in candlestick analysis
Best regards EXCAVO
Close above this level to switch bullish & supports to watch*DISCLAIMER: I am not a financial advisor and this is not financial advice as these are purely my opinions and speculations. I do not guarantee any results nor am I responsible for your actions. You should always do your own due diligence before trading or investing in this market as it is extremely risky.
*Follow me for the latest cryptocurrency analyses on my watchlist
*Thank you to those who donated, I very much appreciate it.
*Let me know in the comment section if you agree or disagree, would love to hear your ideas too.

best possible buying area for algorand1.- best possible buying area for algorand.
2.- possible stop volume
3.- my target 1.20 to 1.30
4.- estimated date for target: February 2021
5.- profit to expect + 486%
----- good luck ----


Negating this VERY bearish pattern and reverse back up?*DISCLAIMER: I am not a financial advisor and this is not financial advice as these are purely my opinions and speculations. You should always do your own due diligence before trading or investing.
*Follow me for the latest cryptocurrency analyses on my watchlist
*Thank you to those who donated, I very much appreciate it.
*Let me know in the comment section if you agree or disagree, would love to hear your ideas too.

ALGOUSDT potential reversal setup formingLooking at today's candle as a potential buy signal IF AND ONLY IF it closes near its high. If it does, a buy above the candle is reasonable.
Setup invalidated if either of the following happens: market pulls back significantly before closing, market trades below 0.2767 (red line), or if market creates a lower low (below support level around 0.2626).
Warning: not a trading advice, please. DYOR.

ALGO/BTC (3rd Test at Key Level Support)💎Technical Analysis Summary💎
BINANCE: ALGOBTC
-Algorand is back trading around the key level of support
-Well, this is still good because the Bull defended this zone again
-But the fight is not yet over until the downward trendline is broken upward
-Yes, you can buy at key level but tight stop loss
-Or, wait for the trendline breakout to confirm that the trend will start to reverse
-Upside potential is up to 4000s sat area or higher
A big Thanks for donating 💰 via Tradingview coins this week to billstenzel 🙏🎉
``````````````````````````````````````````````
Trading Involves High Risk ⚠️
Not Financial Advice 💸
Please Exercise Risk Management 💱
``````````````````````````````````````````````
Thank You All!🙏😊💖For Supporting My Channel 📺
Through Leaving A Thumbs Up, Comment & Follow 💬
Happy Trading!😊💕💖
``````````````````````````````````````````````

ALGOUSD 2D: BEST Level to SELL/BUY 30%/45% gains(SL/TP)(NEW) Why get subbed to me on Tradingview?
-TOP author on TradingView
-15+ years experience in markets
-Professional chart break downs
-Supply/Demand Zones
-TD9 counts / combo review
-Key S/R levels
-No junk on my charts
-Frequent updates
-Covering FX/crypto/US stocks
-24/7 uptime so constant updates
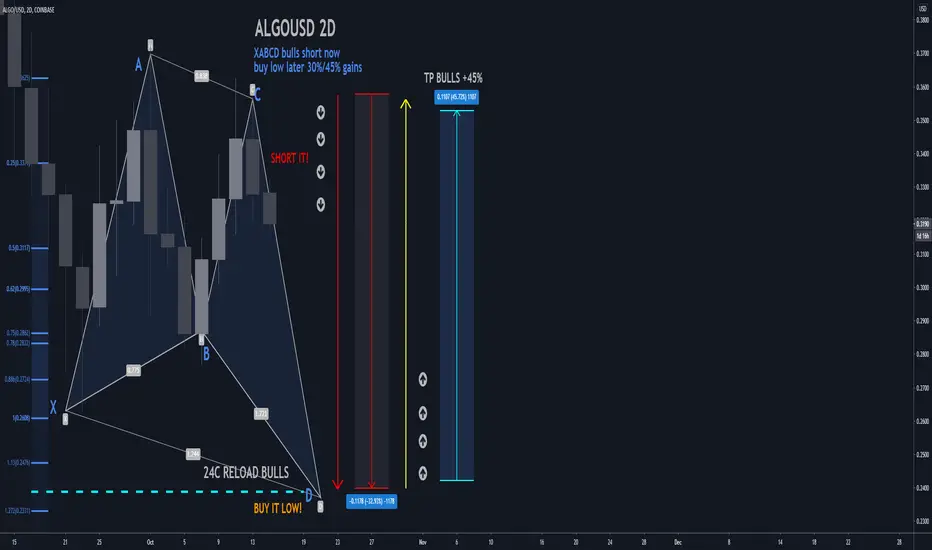
ALGOUSD 2D: BEST Level to SELL/BUY 30%/45% gains(SL/TP)(NEW)
IMPORTANT NOTE: speculative setup. do your own
due dill. use STOP LOSS. don't overleverage.
Tagged as SHORT as I expect more losses
before reversal BULLS point D/PRZ.
🔸 Summary and potential trade setup
::: ALGOUSD 2days chart review/outlook
::: speculative XABCD setup in progress
::: requires confirmation
::: SHORT/LONG sequence now
::: but lower risk on BUY side later
::: higher risk setup: SHORT NOW TP 30%
::: TP Bears is point D/prze at 24c
::: BULLS should focus on buying low
::: later after pullback/correction
::: BULLS should BUY/HOLD 24c TP 45% gains
::: TP bulls is 35c
::: recommended strategy: BUY LOW point D/PRZ
::: ENTRY NEAR 24c SL 5% TP 45%
::: SWING TRADE: BUY LOW and HOLD IT
::: correction not over yet
::: good luck traders!
::: SHORT and get paid. period.
🔸 Supply/Demand Zones
::: N/A
::: N/A
🔸 Other noteworthy technicals/fundies
::: TD9/Combo update: N/A
::: Sentiment mid-term: BEARS/24c
::: Sentiment outlook short-term: BULLS 35c
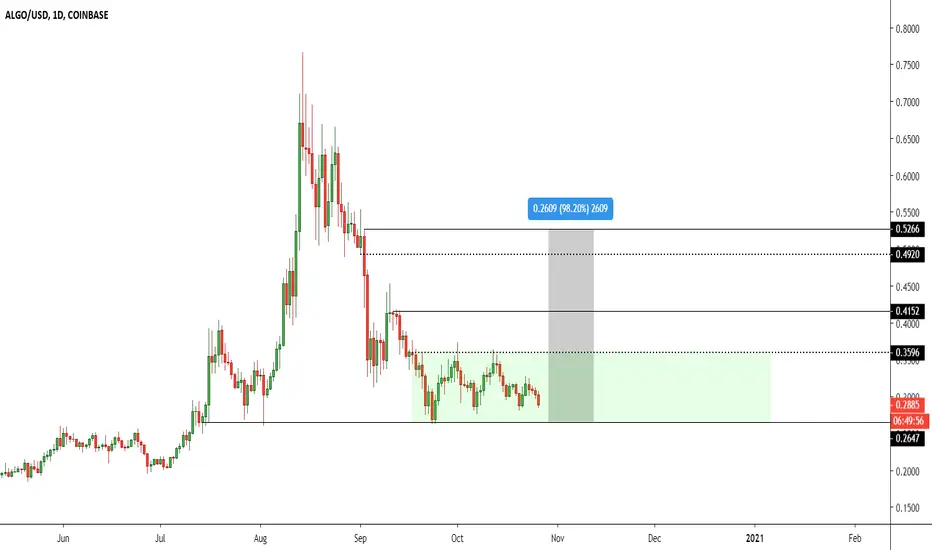
Algo/usdIf this can break and hold .357.... GAME ON!!!!! A lot of ALTS are looking like this right now... get your tether ready :). Good luck y’all!


Algo/usdt testing major trendline support Algo testing now the major trendline support (white)
and bounced from there
If the price can hold above this area and break the trendline resistance (purple) can be a good buy
But for me... best buy area when also break above ema 100-200 around resistance 0.37$
Stability above this resistances can lead to great jump
If you like my ideas hit like and follow for more free ones


ALGOUSD LongHi
As you can see in the chart, the price has broken a downward trendline and pullback.
Besides, that price got supported on 0.618 Fibonacci and on an upward trendline.
There is a visible bullish divergence.
---------------------------------------------------
What is your opinion? Comment it below.
If you like the idea, please hit the like button and subscribe to the profile to not miss my updates. The information given is never financial advice. Always do your research too.
Goodluck.

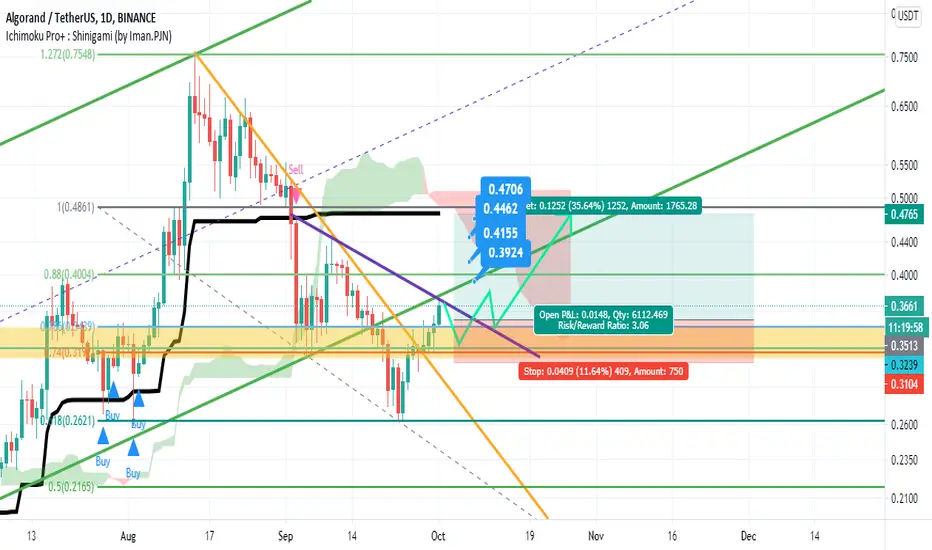
Algo/Usdt Long OpportunityAlgo is in a good position for a long time. Reversed from Fibo 618 support and stabilized above the static resistance level and I think it can break the trend and move towards the black Shinigami and touch the targets that are specified.

ALGO/BTC (Testing Strong Support)💎Technical Analysis Summary💎
BINANCE: ALGOBTC
-Algorand is now testing a strong support area
-This zone is a confluence of previous resistance and support
-If ALGO can hold this area for a few days
-And BTC starts consolidating normally
-There is a chance, this coin will bounce up to 3500 sat
-But if the support fails, the next level to watch is 2000 sat
-So please be careful, I don't advice to buy at market price yet
``````````````````````````````````````````````
Trading Involves High Risk
Not Financial Advice
Please Exercise Risk Management
``````````````````````````````````````````````
If You Like My Daily Published Ideas
A little Help By Supporting My Channel
Through Leaving A Thumbs Up, Comment & Follow
Happy Trading! --> Thank You! :)
``````````````````````````````````````````````

ALGOUSD - Daily Chart Follow-UpWhat a crucial image. Same Head and Shoulders as a few weeks back, just bigger!
Looks like we have a waterfall scenario here... For the ones who hold ALGO, better pray...
Happy Trading!

ALGOUSD - Bearish Continuation Pattern or Bottoming Pattern?Algorand looking as if it is building one massive broadening triangle which could go into both direction when hitting the bottom.
Looks very bearish at the moment. Also built a H&S in shorter time frames. Good luck with that one!
Happy Trading!

OH ALGO! WHAT A NICE SETUP - WAITING FOR AN ULTIMATE BREAK UP!Guys. Please do not hold me. I am buying This!
