ALGO ready to go down! (Short)After a minor pullback to change of character area, I expect a liquidity grab from the prior high and go down from there.
NFA
ALGOUSDT


ALGO/USDT - Algorand: Resistance_Breakout_Confirmation◳◱ A Resistance Breakout and Confirmation has been detected on the SIX:ALGO / CRYPTOCAP:USDT chart. The price has broken above a key resistance level and has been confirmed by a strong candle, indicating a potential bullish trend. The next resistance key levels are located at 0.2247 | 0.2329 | 0.2501, and the major support zones can be found at 0.2075 | 0.1985 | 0.1813. Consider entering a trade at the current price zone of 0.2313 and targeting higher levels.
◰◲ General info :
▣ Name: Algorand
▣ Rank: 40
▣ Exchanges: Binance, Kucoin, Bybit, Huobipro, Gateio, Mexc
▣ Category/Sector: Infrastructure - Smart Contract Platforms
▣ Overview: Algorand is a scalable, secure, and decentralized digital currency and smart contract platform. Its protocol uses a variation of Proof-of-Stake (PoS) called Pure PoS (PPoS) to secure the network and reach consensus on block production. Unlike other PoS models, PPoS does not reward, nor does it put validator or user funds at risk of being slashed (a loss of funds used to promote honest node and user behavior). Algorand intends to eventually leverage its PPoS design to form the foundation for an on-chain governance system.
◰◲ Technical Metrics :
▣ Mrkt Price: 0.2313 ₮
▣ 24HVol: 12,134,262.215 ₮
▣ 24H Chng: 5.858%
▣ 7-Days Chng: 4.60%
▣ 1-Month Chng: 11.99%
▣ 3-Months Chng: 0.01%
◲◰ Pivot Points - Levels :
◥ Resistance: 0.2247 | 0.2329 | 0.2501
◢ Support: 0.2075 | 0.1985 | 0.1813
◱◳ Indicators recommendation :
▣ Oscillators: BUY
▣ Moving Averages: STRONG_BUY
◰◲ Technical Indicators Summary : STRONG_BUY
◲◰ Sharpe Ratios :
▣ Last 30D: 0.76
▣ Last 90D: 0.54
▣ Last 1-Y: -0.78
▣ Last 3-Y: 0.63
◲◰ Volatility :
▣ Last 30D: 0.90
▣ Last 90D: 0.86
▣ Last 1-Y: 0.95
▣ Last 3-Y: 1.20
◳◰ Market Sentiment Index :
▣ News sentiment score is N/A
▣ Twitter sentiment score is 0.60 - Bullish
▣ Reddit sentiment score is 0.46 - Bearish
▣ In-depth ALGOUSDT technical analysis on Tradingview TA page
▣ What do you think of this analysis? Share your insights and let's discuss in the comments below. Your like, follow and support would be greatly appreciated!
◲ Disclaimer
Please note that the information and publications provided are for informational purposes only and should not be construed as financial, investment, trading, or any other type of advice or recommendation. We encourage you to conduct your own research and consult with a qualified professional before making any financial decisions. The use of the information provided is solely at your own risk.
▣ Welcome to the home of charting big: TradingView
Benefit from a ton of financial analysis features, instruments and data. Have a look around, and if you do choose to go with an upgraded plan, you'll get up to $30.
Discover it here - affiliate link -

ALGO Sell Limit 😎✅😎✅😎Hi dear traders
ALGO moving in flat channel.
The price is retesting the 0.2244 resistance and making a false breakout.
We can see bearish divergence between price and volume.
I expect the price to return to the specified area.
We are trying to take 📈 in short term
Wait for confirmation
All targets specified
Let's see what happens
This is not financial advice (DYOR )
Good luck

ALGO - Road to 2024HTF - We are about to print LL and imo 2023 will start with a Bear Market Rally.
LTF - I dont know, I dont care, I am not good at it. I only SPOT TRADE.
This is my 2nd bear cycle and about to be my 3rd bull cycle,
and if history at least rhymes with the past, then it’s time to accumulate.

Short the ALGOHello Traders!
Welcome back to another trade with analyst Aadil1000x.
Today we are selling Algo because of a strong reversal pattern.
Algo SHort Now @ 0.2223
Stoploss 0.2275(-2.3%)
Target 1, 0.2157(+2.9%)
Final Target 0.2107(+5.17%)
Don't forget to hit the like button and follow to stay connected

Trade Alert(s) - Take ProfitTraders,
Unfortunately, I am too uncertain about how altcoins will respond when Bitcoin pulls back to tolerate this level of risk on the table. So, I have chosen to take profits on two coins coming up into resistance here: ALGO and DOGE. I will re-evaluate a decent re-entry area once I know this resistance is or will be defeated.
Stew

Trade Alert - Long Algo Traders,
Bull Flag here. Bought at .21. Will hold to .26 or the 200 day ma, which ever comes first.
Stew

ALGO Idea for an upward rally...Hi traders...
As you can see in the chart, over the past 2 weeks, price increases has happened in alternating time patterns that include Fibonacci time zones.
The next iteration has the power to push the price towards the daily pivot and I expect to see the price rally in the next 48 hours.
BINANCE:ALGOUSDT COINBASE:ALGOUSD
⚠️🚨 Risk warning, disclaimer: the above is a personal market judgment and analysis based on published information and historical chart data on The trading view,
And only some of these analyzes are my actual real trades.
I hope Traders consider I am Not responsible for your trades and investment decision.
✅ Please write any advice or suggestions.
Dear friends, request any cryptocurrency pair, currencies pair for forex, and any index that you want to be analyzed.

Algousdt | Getting Ready Algousdt
Getting Attention of Buyers, Big traders are showing interest in Algo
Hope to see a breakout very soon.
Wait for Breakout Incase Of Breakout Expecting Massive Bullish Move.
Remember: We only give ldea's from our
experience and knowledge, it does not
mean that it will be 100% correct, the
market is always unpredictable, anything
can happen anytime.
Always trade with your own research and
knowledge. If You Are Satisfied With Our
Work Then Join

Algo Breakout has occurred. What am I waiting for?Traders,
Algo has broken the triangle definitively. But I hesitate to enter for several reasons:
1. That 50 day coming down hard
2. Still not above .227 cents level
3. Need at least one confirmation candle on the daily above .227 and preferably above the 50 day ma.
4. Still expect BTC to draw back more.
5. Headed OOO for the next week and a half and I don't want to be tracking trades during this period if I don't have to.
I wouldn't blame anyone who follows me to want to enter here. I am just not. Yet.
Stew

ALGO: The Long Term Bet I Would Love to MakeBy the time of writing, ALGO has already down 95% from its ATH in 2019. Meaning, if we buy now, and it goes back to ATH, we can profit up to 20x our investment. A very good deal, don't you think?
In addition, Algo is now sitting at a multi-year weekly support.
Even if Algo does not manage to reach its ATH, but only to let's say its weekly resistance, the potential profit is already 500%. I really think that this is a very good deal, personally.
For better confirmation, we can wait for these indicator/condition to be fulfilled:
- Break of the white trendline
- Break of 21 EMA
and/or surge in buying volume

ALGOUSDT Elliott Waves AnalysisHello friends.
Please support my work by clicking the LIKE button👍(If you liked). Also i will appreciate for ur activity. Thank you!
Everything on the chart.
Entry: market and lower
Target: 0.3 - 0.36 - 0.44
after first target reached move ur stop to breakeven
Stop: ~0.18 (depending of ur risk). ALWAYS follow ur RM.
RR: 1 to 5
risk is justified
Good luck everyone!
Follow me on TRADINGView, if you don't want to miss my next analysis or signals.
It's not financial advice.
Dont Forget, always make your own research before to trade my ideas!
Open to any questions and suggestions.

Algo Looks Promising In Higher Timeframes Seems Like Already Bottomed Out
Forming Descending Channel In 3days Timeframe Incase Of Breakout Expecting 300 to 320% Bullish Move

Algorand (ALGO) formed bullish Butterfly for upto 43.50% moveHi dear friends, hope you are well and welcome to the new trade setup of Algorand (ALGO) with BTC pair.
Our last successful trade of ALGO was as below:
Now on a daily time frame, ALGO has formed a bullish Butterfly move for another price reversal.
Note: Above idea is for educational purpose only. It is advised to diversify and strictly follow the stop loss, and don't get stuck with trade

ALGOBTCAlgorand looks good and I think we can trust it and publicly we see a positive movement in the coming days.

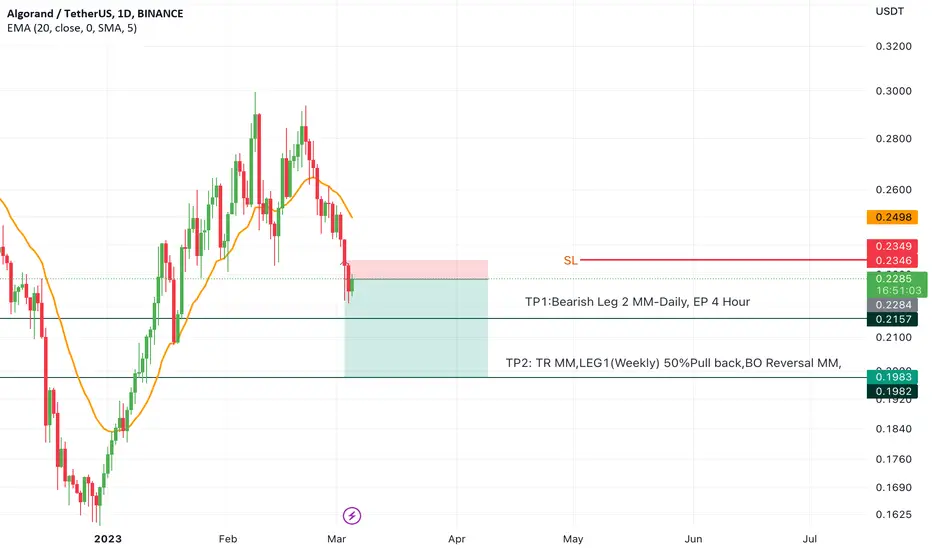
ALGO Short SetupAlgo is currently on its bearish leg pull back,
Therefore I took a short position with mentioned TPs
Lets see

Algorand (ALGO) formed harmonic bullish Shark for upto 23% pumpHi dear friends, hope you are well and welcome to the new trade setup of Algorand (ALGO) with US Dollar pair.
Previously we caught more than 25% pump of ALGO as below:
Now on a daily time frame, ALGO has formed a bullish Shark move for another price reversal.
Note: Above idea is for educational purpose only. It is advised to diversify and strictly follow the stop loss, and don't get stuck with trade

To turn into an uptrendHello?
Traders, welcome.
If you "Follow", you can always get new information quickly.
Please also click "Boost".
Have a good day.
-------------------------------------
(ALGOBTC 1W chart)
There is no power of ascension itself.
So, after March 13th, we need to see if it can rise above the downtrend line and rise above 0.0000 1448.
In order to dissipate the rising power, it must rise above 0.0000 1970 ~ 0.0000 2886.
Therefore, it is expected that the price should be maintained above 0.0000 1448 to start gaining momentum.
-------------------------------------------------- --
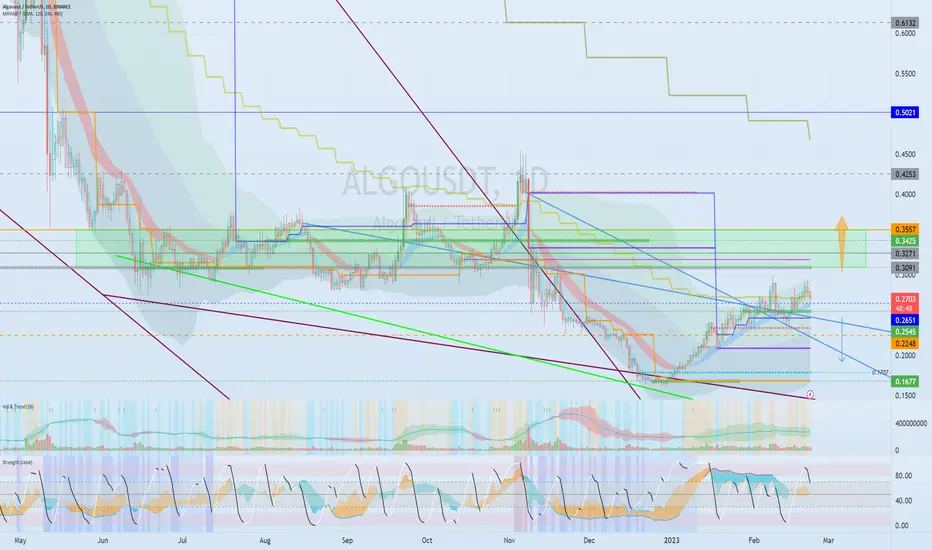
(ALGOUSDT 1D chart)
It is showing a move to break out of the mid- to long-term downtrend.
However, in order to turn into an uptrend, the price must be maintained above 0.3091-0.3557.
If it fails to do so and falls below the downtrend line, be cautious as there is a possibility of renewing lows.
-------------------------------------------------- -------------------------------------------
** All descriptions are for reference only and do not guarantee profit or loss in investment.
** If you share this chart, you can use the indicators normally.
** The MRHAB-T indicator includes indicators that indicate points of support and resistance.
** Check the formulas for the MS-Signal, HA-Low, and HA-High indicators at ().
(Short-term Stop Loss can be said to be a point where profit or loss can be preserved or additional entry can be made by split trading. This is a short-term investment perspective.)
---------------------------------
Algousdt Approaching Towards Crucial Area Forming Descending channel In daily timeframe
Incase Of breakout expecting 150 To 170% bulish move

ALGO retrace
Boucing off horizontal support and decending channel support, falling wedge breakout, technical breakouts, can head to previous support turned resistance.

ALGO LONG SIGNALSHello, friends. Nice to meet you.
ALGO has now broken through a major selling point.
The position where the candle fell rebounded from 0.5, and it is very ideal to raise it after retesting at 236.
