Will ALGORAND'S 'anti Trump' management team kill the project?ALGORAND has some serious potential in regard to its technology and its use case, but it’s well known that the people behind ALGO are publicly—and unfortunately loudly—against Trump and his agenda to 'Make America Great Again' and to make 'America the crypto capital of the world.'
I like ALGORAND's project and technology, but I also think that the management's inability to keep their political opinions to themselves, and instead focus on their business model, could end up working against ALGO over the next four years. I think it’s not only a bad idea to take a public political stance as they have when you have a business to run, but their poor judgment could severely hurt ALGO investors over the course of the current administration. But, let’s hope that isn’t the case.
Good luck, and always use a stop loss!
ALGOUSDT

ALGOUSDT - Weekly LONGThis is a weekly technical analysis for educational purposes on ALGOUSDT. I believe that Algo will revisit the same levels and will be widely discussed during the altcoin bull season. I may be wrong. :)
Regards,

ALGO buy setup (1D)Here, we have a high-potential zone for ALGO.
The green zone represents strong support, and if the price reaches this area, we will look for buy/long positions.
The red box is a fresh order block that hasn’t been tapped yet, containing the main sell orders.
The target can be this red box.
Closing a daily candle below the invalidation level will invalidate this analysis.
For risk management, please don't forget stop loss and capital management
Comment if you have any questions
Thank You

ALGOUSD - BULLISH PHASE STARTSHello,
Micro and Medium Caps entering bull phase for next ~2Months.
ALGO could be a good choice because it is ISO 20022 compliant, is somehow US friendly and could apply for ETF also.
This is not a trading advice!
Thanks

#ALGO/USDT#ALGO
The price is moving in a descending channel on the 1-hour frame and is expected to continue upwards
We have a trend to stabilize above the moving average 100 again
We have a descending trend on the RSI indicator that supports the rise by breaking it upwards
We have a support area at the lower limit of the channel at a price of 0.2351
Entry price 0.2434
First target 0.2479
Second target 0.2536
Third target 0.2594

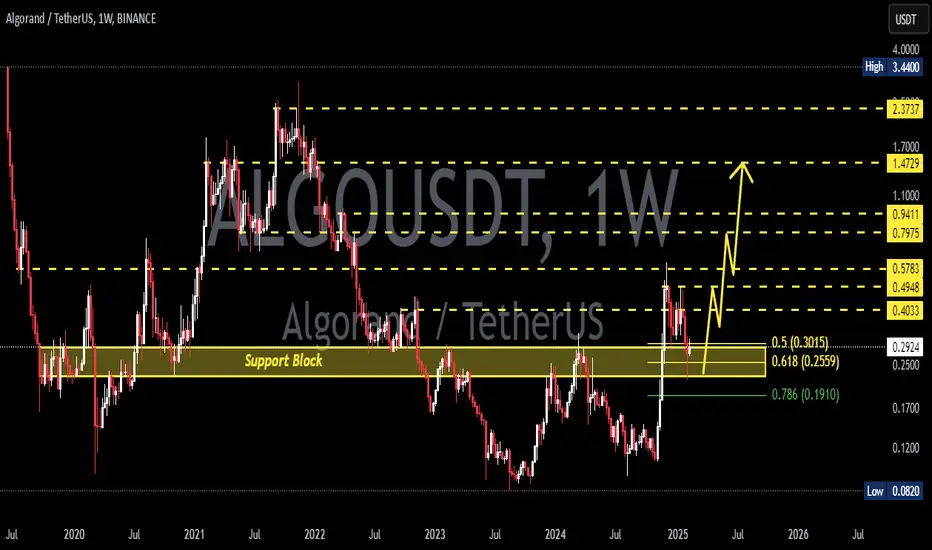
Is an 11X in the cards for ALGO, taking price to $2.00 +?The days of "alt-coin season" are over, and we are now living in the time of Utility Season. Many cryptocurrencies that lack real-world utility simply didn't rally much, if at all, during the "Trump pump." Did you ever ask yourself why? Because the days of speculation are coming to an end, and the new era of utility is quickly becoming the law of crypto.
Ninety-nine percent of cryptocurrencies will not survive what's coming, and if your chosen crypto isn't on the ISO 20022 list, then kiss it goodbye!
ALGO will be one of the few chosen beneficiaries of Utility Token Season and is looking like the charts could indicate a run-up of around 11X to the $2.00+ level in the coming 6 to 9 months.
Good luck, and always use a stop loss!

ALGO ANALYSIS (1D)ALGO's structure is still bullish on higher timeframes and will remain so unless the origin of the previous bullish wave is broken.
We have a low-risk Rebuy zone where spot entries can be made gradually within this range.
The target could be the supply zone.
A daily candle closing below the invalidation level would invalidate this analysis.
Do not enter the position without capital management and stop setting
Comment if you have any questions
thank you

$ALGOI consider two price ranges for the correction floor. The first range is around $0.1977, from which I suspect we might see a temporary bounce, but I believe this price range will not be the end of the price correction. The second range is around $0.1388, where I think we will see the end of the correction and a trend change. If the price reaches around the second range, the market will need a time correction. In the future, based on the events occurring in this dynamic market, a more comprehensive analysis will be provided. For now, my view on the EURONEXT:ALGO currency is as follows.
I would be pleased to see your valuable and constructive comments below this analysis. Thank you for taking the time to read this analysis. I hope you have enjoyed it.

algo ready for distribution/pump.algousdt is in manipulation of po3 formation. Also their team is very active now a days and doing partnerships. which can also be a good factor to buy this.

Algorand , easy oneAlright hope you having a wonderful valentine’s night, I did algo while ago probably late 2023 and haven’t updated since then, touched very important level and currently in a perfect situation to go up , first tp for me is the first orange rectangle, let’s not make rush for the rest and update it later on , for now have fun .

Is ALGO Finally Bottoming Out? A Massive Move Could Be Coming!Yello, Paradisers! #ALGOUSDT is flashing major reversal signals, and if the pattern plays out, a big move could be on the horizon. Are the bulls finally ready to step in? Let’s break it down!
💎#ALGO has been stuck in an A-B-C correction pattern, with Wave A kicking off the downtrend, Wave B bringing a retracement, and Wave C completing the correction. But here’s where it gets interesting—ALGO is now showing signs of accumulation, hinting that bulls might be gearing up for the next impulsive wave.
💎To confirm the reversal, ALGO must break the $0.33 resistance. If bulls successfully push past this level, momentum could accelerate, sending price toward the descending resistance at $0.37. This is a pivotal breakout level, and clearing it would give bulls the strength to aim for the $0.46–$0.50 resistance zone—the 61.8% Fibonacci retracement, a historically strong level where major reactions tend to happen.
💎On the downside, ALGO has solid support at $0.265–$0.250, a key demand zone that bulls have defended since November 2024. As long as this support holds, the probability of a strong move higher remains intact.
Paradisers, as always, patience and precision are key in this market. This isn’t a time for reckless trades—let the levels guide you, trade strategically, and stay disciplined.
MyCryptoParadise
iFeel the success🌴


ALGOUSDT 1WALGO ~ 1W Analysis
#ALGO If you still have a Conviction on this coin. Maybe this is very good support to start buying again from here.
A 1,000% OPPORTUNITY Algorand has been on my Alt watchlist now for quiet some time and it has continued to become more and more convincing as the charts continue to print data.
The token is still relatively new and has a similar chart patterns to those of Solana, XRP and BTC, all projects that exploded multiple times after creating their initial all time highs.
I won't put all the tokenomics in here on the project as you can find that and research that for yourself however with BTC hopefully dumping very soon it gives us an opportunity to reload on some alts as i already mentioned and a lot of your messaged me asking exactly which alts i would buy, well i am going to be posting them all for you.
The chart is utterly beautiful and it is begging for another pump on the next bull run. I don't think it would even hurt to get in now as $ is so low and so is the MC relative to other similar project's and token MC's.
As you can see from the Fib Algo could still see a further downside push to around 0.10 which would also be Algo's floor, if this does happen i will absolutely load up on this project with the anticipation of it hitting new ATH's on the next bull run, which would be over a 1,000% increase.

ALGOUSDT SLIGHT BULISHWe are currently in the correction phase of the market. I don’t see any sharp movements at the moment, but a slight bullish movement could occur, as shown on the chart.
Targets are marked, but the danger zone and stop loss levels are more important than the targets. Please pay close attention to them.
Note: My ideas are not intended for any type of scalping or scalpers!
You can find the full list of my ideas here: www.tradingview.com
Here are some of my ideas:

ALGO Long Spot OpportunityMarket Context:
ALGO has reached a key support level, offering a strong risk-to-reward opportunity for a long spot position. Given current price action, this level could act as a launchpad for a move higher.
Trade Details:
Entry Zone: $0.32 - $0.35 (support area)
Take Profit Targets:
$0.48 - $0.53
$0.70 - $0.80
Stop Loss: Just below $0.30
This trade aligns with ALGO’s structure, aiming for a rebound from support into key resistance levels. Stay disciplined with risk management! 📈

ALGOUSDT BEARISHI analyzed ALGOUSDT a few days ago as well, and it was bullish at that time. However, after a significant decline, I believe it may fall again, but probably not sharply.
Note: My ideas are not intended for any type of scalping or scalpers!
Here are some of my ideas (not selected!) :
Full list of my ideas are here:
www.tradingview.com

ALGO is trading within equilibrium, setting up for a breakout.ALGO has been trading within the bullish wedge pattern for some time and is now looking to break out to challenge the recent pattern high.
Good luck, and always use a stop loss!

#ALGO/USDT #ALGO
The price is moving in a descending channel on the 1-hour frame and is adhering to it well and is heading to break it strongly upwards
We have a bounce from the lower limit of the descending channel, this support is at a price of 0.3500
We have a downtrend on the RSI indicator that is about to be broken, which supports the rise
We have a trend to stabilize above the moving average 100
Entry price 0.3533
First target 0.4080
Second target 0.4381
Third target 0.4753

#ALGO/USDT Ready to go higher#ALGO
The price is moving in a descending channel on the 1-hour frame and sticking to it well
We have a bounce from the lower limit of the descending channel, this support is at 0.4064
We have a downtrend on the RSI indicator that is about to be broken, which supports the rise
We have a trend to stabilize above the moving average 100
Entry price 0.4313
First target 0.4475
Second target 0.4593
Third target 0.4960


Algorand middle term targetsAlgorand middle term targets BINANCE:ALGOUSDT
Possible Targets and explanation idea
➡️We already sweep covid historical march 2020 low
➡️On a W tf we can see money inflow based on my Money Power indicator
➡️Perfect scenario with test of Buy line of my Take Profit indicator
➡️Target will be break out of downtrend line and test with full fill around 0.53$ monthly FVG.
Hope you enjoyed the content I created, You can support with your likes and comments this idea so more people can watch!
✅Disclaimer: Please be aware of the risks involved in trading. This idea was made for educational purposes only not for financial Investment Purposes.
---
• Look at my ideas about interesting altcoins in the related section down below ↓
• For more ideas please hit "Like" and "Follow"!

ALGO plan for 2023✅Before we start to discuss, I would be glad if you share your opinion on this post's comment section and hit the like button if you enjoyed it.
Thank you.
We don't need to draw a lot of lines on a charts. Here is weekly timeframe and everything what you should know about Algorand price action for 2023
Possible Targets and explanation idea
➡️Weekly chart. Based on Take profit indicator we traded long time period under fundamental price.
➡️Its a Fib trend extension not a retracement. By this fib from the top we came in exactly to 0.618 lvl
➡️First block its a Monthly gap. Second block its a weekly gap which we most likely come to trade
➡️Take profit line now at 1.13 and exit line over than 0 level 1.27
➡️Most likely we can see at least move to 0.23 level by fib then retest buy line and take profit line before 2024/2025 bull run
Hope you enjoyed the content I created, You can support with your likes and comments this idea so more people can watch!
✅Disclaimer: Please be aware of the risks involved in trading. This idea was made for educational purposes only not for financial Investment Purposes.
---
• Look at my ideas about interesting altcoins in the related section down below ↓
• For more ideas please hit "Like" and "Follow"!
