ALGO - Wait For The Trigger!Hello everyone, if you like the idea, do not forget to support with a like and follow.
As per my last video analysis, we were waiting for the bulls to take over from a medium-term perspective by breaking above the inverse head and shoulders neckline.
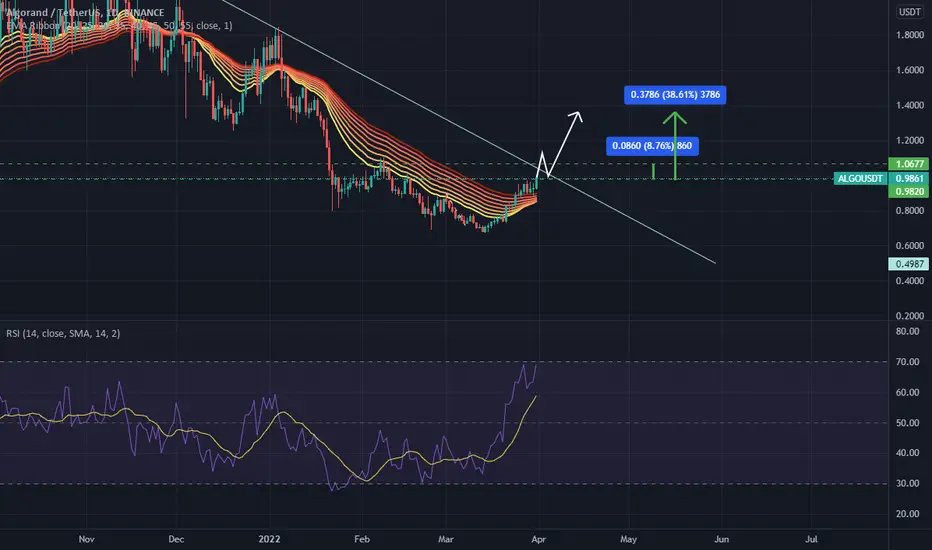
ALGO broke above the neckline and traded higher. Now for the bulls to take over from a long-term perspective, we need a daily candle close above the last high in gray and above 1.0 round number.
Meanwhile, until the bulls take over from Daily, the bears can still kick in to form another low.
Always follow your trading plan regarding entry, risk management, and trade management.
Good luck!
All Strategies Are Good; If Managed Properly!
~Rich
ALGOUSDT

Algorand ; pennant flag patternAlgorand pennant flag pattern formation after since it break out trend line and grew up well.
Currently unlikely for algorand the btc into correction structure and after finish it correct we expected algorand throught cross red line it will grow up to $1.2 _ $1.3 area at first bullish wave


ALGO Reversal Head and Shoulders patternOn 1h TF we can see a revrsal head and shoulder pattern. Would give us a pump this analysis ?

ALGO consolidation above monthly open LONGThe start of alt coin season is upon us.
Algo has little resistance above and looking for a smooth leg up here

ALGO - Breakout comingAlgo has been in a corrective sequence for some time. Still possible we are still correcting 5 waves were counted inside the triangle - a good indication that we may see a breakout

ALGORAND (ALGO/USDT) : 0,77 Key Tactical Support to watch ALGORAND (ALGO/USDT) : 0,77 Key Tactical Support to watch (3 to 12 Weeks view)
Many of you asked me to have a look on Algo, so lets go..
Context
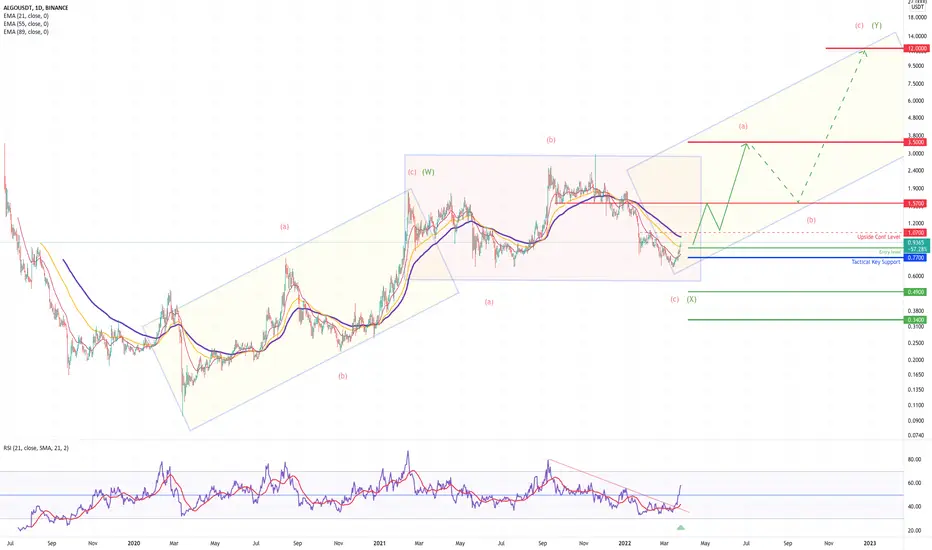
The structure of the trading range (2021 - second flat rectangle) is similar at we what we observed on many other L1/L2 Network protocol Token, however the previous wave structure is not totally similar (first ascending rectangle). It is important to notified this details because it help to articulate the two different scenrio around the key Pivot level set at 0,77.
In a correlated scenario to ETH or BTC the equivalent structure to be develop is new abc pattern to complet a Y major cycle. With ana equivalent of 1,57 and 3,50 as graphical level of the last ETH analysis - In terme of % th e potential is 3X more than ETH so it is quiet interesting to watch this coin in term of COIN PICKING.
However and not the less, the bullish element from graphical and indicators are not yet at the same level from what we are seeing on ETH at the moment , the bullish presignal is not yet strong and that why a break above 1,07 is mandatory to jeopardize any new negative price action (test and break of 0,77)
The global picture within a global macro approach is bullish in order to replicate an auto-similar move which could develop a rise to 12 area in log scale in the best case :)
Key Level to Watch on daily chart basis
0,77 Overlap + Key Fibonacci level (auto-similar short-term wave structure)
0,87 perfect entry level in setback (if we see it)
1,07 upside conf level = auto-similar move within a bearish structure
1,57 key first taking profit level = 3800 ETH + Overlap
Key Element to watch
RSI is providing clear pre-signal
EMA 21/34 are support but no golden cross
EMA89 is Resistance
Elliot Wave Structure is showing a potential strong bullish pattern on going (3rd ascending rectangle)
Tactical View 3 to 12 Weeks
As long as 0,77 remains support, accumulating around 0,87 make sense to anticipate a break above 1,07 and play 1,57 on a shorter run before developing a further upside potential towards 3,50 (Almost 300%)
Else A failed below 1,07 could reinforce the bearish scenario confirmed with a break of 0,77
Enjoy my friends
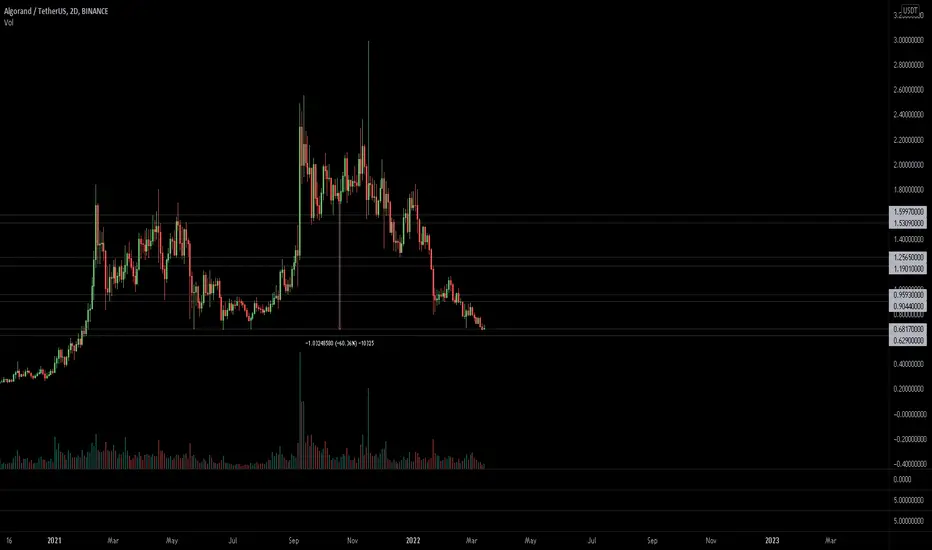
$ALGO, Lowest value since January 2021 $ALGO
Lowest value since January 2021 & sitting on something that could act as a strong support
Still has to show bounce/reversal signals so chilling till something happens
UCTS printed a Sell signal back in October (60% down since it happened)
#ALGO
Don't forget about Algorand! 🪐🪐Greetings,
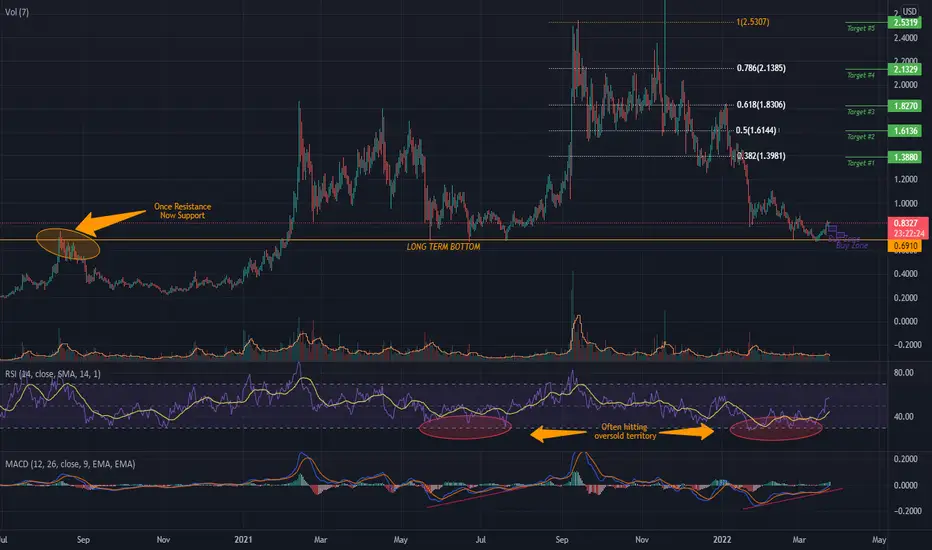
Today we're looking at ALGO/USD - Algorand is a decentralized blockchain-based network that supports a wide range of applications. Algorand purpose is to speed up transactions and improve efficiency, in response to the slow transaction times of Bitcoin and other blocks. It's design focus is lower transaction fees, as well as no mining (like Bitcoin's energy-intensive process), as it is based on a permissionless pure proof-of-stake (PoS) blockchain protocol.
If you have a look at the chart, our Long Term Bottom line is drawn in (orange) around 70c region. If we look at this price on the daily or weekly time frame we can see that 70c was once resistance, which has now become support. I look at this price as being a value buy, for Algo to fall below 70c again there would have to be a large crash across the market, which is always possible!
Current Price:
$0.84
Buy Zone:
#1 - $0.70 - $0.76
#2 - $0.76 - $0.84
Targets:
#1 - $1.38
#2 - $1.61
#3 - $1.82
#4 - $2.1
#5 - $2.53
On the smaller time frames 1-2 Hrs - we may also have an inverse head and shoulders playing out, which is a bullish pattern!
As you can see i've set targets quite high on this one - We won't be trading Algo with any leverage as the market can be volatile in both directions. Cryptocurrency market can be extremely violent, so keep in mind that we're always using our tools and indicators to decide the structure of the market to try and predict the future.
Remember, nothing is guaranteed, control the controllables.
Mogues
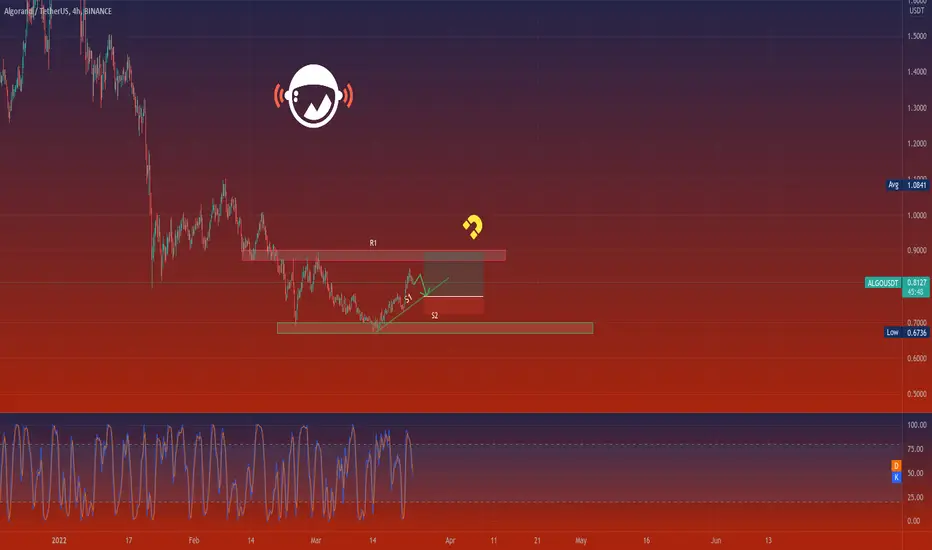
ALGOUSDTHello Crypto Lovers,
Mars Signals team wishes you high profits.
We are in the 4-hour time frame. The price has hit the S1 line two times and was supported. We expect the price to move down to S1 and then go up to our first target R1. If the price stabilizes below the S1 line, our scenario would fail and the Stop Loss would be hit. If S1 is lost, the price will have a heavy fall down to S2 which is less likely.
Warning: This is just a suggestion and we do not guarantee profits. We advise you analyze the chart before opening any position.
Wish you luck
AglousdtI see in Algousdt a good opportunity as a speculation. I see a positive head and shoulders pattern, as you can see, you can enter when retesting and targets are specified in the chart.
What do you think , let me know in comments.

ALGO/USDT - Potential 123% SetupHello Traders!
After finishing the downward movement, the price of ALGO returned to the zone of interest of buyers $0.695 - $0.890.
It is possible to consider medium-term purchases in the range of $0.695 - $0.800. Price movement under $0.58 will be a trigger for closing the position.
For a short-term trade it is better to wait for a breakdown of the downtrend, the price exit beyond the price level of $1.07 and MA100 on a daily timeframe.
Targets will be price levels of $1.46 and $1.79
Good luck and watch out for the market
P.S. This is an educational analysis that shall not be considered financial advice

ALGO - Video Top-Down Analysis!Hello TradingView Family / Fellow Traders. This is Richard, as known as theSignalyst.
Here is a detailed update top-down analysis for ALGO.
Which scenario do you think is more likely to happen? and Why?
Always follow your trading plan regarding entry, risk management, and trade management.
Good Luck!
All Strategies Are Good; If Managed Properly!
~Rich

algo/usdTesting/tracking elliot wave theory. Please do not trade off idea without S/L. Not financial advice.
The bottom is pretty much in. We have the first wave (1) completed and wave (2) is just about done. We should be working on wave (3). If you compare this chart to the previous, the price targets are relatively the same. I've added a new wave (5) target to make this chart more accurate.
Wave (1) - 2.5: done
Wave (2) - 0.60 : done or one more leg down 0.25 is lowest.
Wave (3) - 6.3-6.9
We are living in crazy times at the moment. We have a lot of crazy things going on such as pandemic and war etc so anything goes really. Your best bet is to dollar cost average down and stake. This is not financial advice.
Link to previous chart:

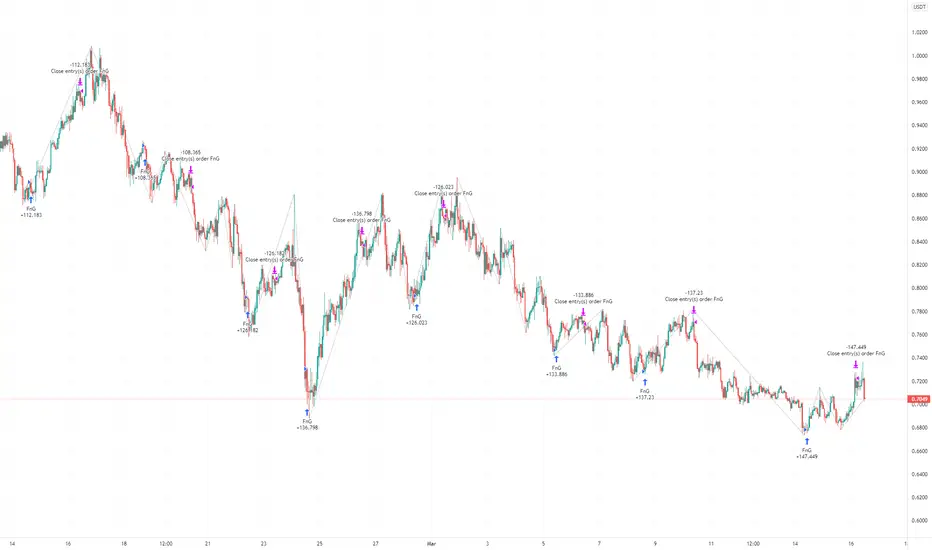
Trading strategy for ALGOUSDT.Trading strategy for ALGOUSDT.
This strategy utilizes fear and greed index at alternative.me
Why Measure Fear and Greed?
The crypto market behavior is very emotional. People tend to get greedy when the market is rising which results in FOMO (Fear of missing out). Also, people often sell their coins in irrational reaction of seeing red numbers. With our Fear and Greed Index, we try to save you from your own emotional overreactions. There are two simple assumptions:
Extreme fear can be a sign that investors are too worried. That could be a buying opportunity.
When Investors are getting too greedy, that means the market is due for a correction.
Therefore, we analyze the current sentiment of the Bitcoin market and crunch the numbers into a simple meter from 0 to 100. Zero means "Extreme Fear", while 100 means "Extreme Greed". See below for further information on our data sources.
UNDERSTANDING THE METRICS AT TRADING VIEW
Maximum Drawdown
The maximum drawdown metric refers to the "worst-case scenario" for a trading period. It measures the greatest distance, or loss, from a previous equity peak.5
What is a Good Profit Factor?
Any ratio greater than one means we can earn more than we lose. So, technically:
A factor higher than 1 denotes a winning system.
A factor lower than 1 denotes a losing system.
Percent Profitable
The percent profitable metric is also known as the probability of winning. This metric is calculated by dividing the number of winning trades by the total number of trades for a specified period.
See profit report below.
XRMUSDT 24HR WK #11 (ALT SECRET)XMR will continue to outperform the majority of altcoins.
#1 most altcoins are still +20% from 12/15/21
#2 XMR is still above the 50ema (thick purple)
To find out if your altcoin is worth a ish use this
total3 mkcap (minus btc and eth)
Is your alt trading lower than the total3?
Is your alt 50ema above, below, or indifferent to the total3 50ema
Is your alt moving with speed and conviction

ALGO/USDT 4 HOURS UPDATE Hi guys, This is CryptoMojo, One of the most active trading view authors and fastest-growing communities.
Do consider following me for the latest updates and Long /Short calls on almost every exchange.
I post short mid and long-term trade setups too.
Let’s get to the chart!
I have tried my best to bring the best possible outcome in this chart, Do not consider it as an
ALGO/USDT is making this falling wedge pattern.
Entry: $0.6830-$ 0.6950
Targets- 20%
LEVERAGE-5X - 10X
Stop Loss: $0.6690
This chart is likely to help you in making better trade decisions, if it did do consider upvoting this chart.
Would also love to know your charts and views in the comment section.
Thank you

ALGO/USDT by CryptoTradersWWThis morning, I'm attempting to discover some longer-term opportunities.
Algo/USDT is one of the coins that is close to historical support.
The price is currently testing $0.67 for the fourth time, but no meaningful reaction has yet to be seen. The zone between $0.50 and $0.56 is another level | am interested in for a long time.
There is ascending trendline support as well as many levels of confluence in this area. I've activated my alerts!
<---------------------------->
☑️ Follow, Comment & Like
☑️ Create a civil and healty discuss in the comments and share with me your thoughts
Thanks and Happy Trading!

ALGO/USDT SCALP TRADE STUP!0.695-$0.705Hello everyone, if you like the idea, do not forget to support with a like and follow.
Welcome to this ALGO/USDT SCALP setup. Our previous two scalp setups (CTK&GALA) gave us amazing more than 100% profit. Expecting the same with ALGO.
ALGO is breaking out from the falling wedge in an hourly time frame. Buy some now and add more in dips.
Entry range:- $0.695-$0.705
Target:- 10-12%
SL:- $0.682
Lev:- 10x
If you like this idea then do support it with like and follow.
Also, share your views in the comment section.
Thank You!

ALGO breakout shortALGO broke support floor on 4h chart, and retested breakout zone and 50% retracement level. After having a pullback to cradle zone, we had a bearish close below the 20 day ema on the 1h chart. On the 15 min chart, we had a break of structure and a bb break to the downside.
- This is a swing play that had a good day trade entry. I forsee some bearish action in the total market, but price may reverse and retest our previous breakout / support floor area more. My stop loss has compensated for that being above the highest volatility zone and above the previous breakout zone and consolidation area
- This trade will be managed discretionally

$ALGORight now we're at a key support for ALGO if we see a break down from it I imagine it'll be pretty bloody.

Expanding Diagonal for ALGOUSDLeading Expanding Diagonal (3-3-3-3-3)
Rules:
Wave 1 shorter than Wave 3
Wave 3 shorter than Wave 5 (sets 7$+ target for Wave 5)
Wave 4 must overlap into Wave 1 territory
Can overshoot or undershoot the top trendline
Additional comments:
Local bottoms seem to be equally spaced according to time cycles;
Stochastic RSI is deeply oversold on all major timeframes (Daily, 3D, Weekly and Monthly)
It might go lower than current price but a major move to the upside should be starting soon
There's also a lot of fundamental bullish news for Algorand in 2022
This chart is for educational purposes only, it's not financial advice
