algo usdtit is my idea about Algo. what do you think about that?
I choose LONG TRADE. but you can wait for best price for buy it.
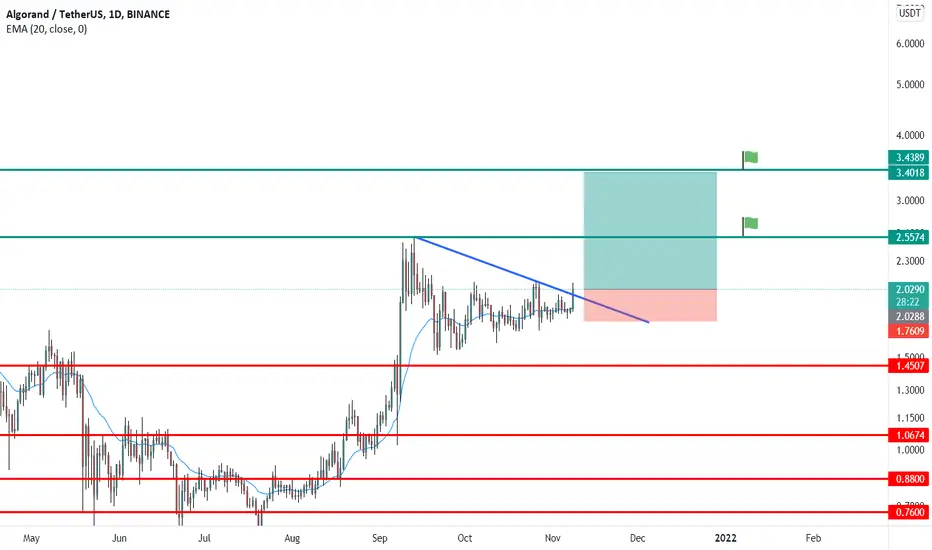
I will also wait until November 29th. I got November 29 with Fibonacci Time.
ALGOUSDT

Algorand (Breakout)Algorand has finally broken out of the sideways trading it's been tracking on.
Algo is now tracking on an ascending channel, leading back to $2.39.
Price $2.49-$2.60 within range by Mid-December.
Algorand is also trading nicely within the top bounders of a Fibonacci retracement pattern at the moment.
support at $1.94-$2.00.
related published ALGO idea linked below:

#AlgoUSDT. We'll wait until the RSI triangle breaks from above.it seems ALGO wants to reach the first target based on Fibonacci.
but we'll wait until the RSI triangle breaks from above, after that we open a long position.
The purple line is Fibonacci extension Target.🟣
Red lines are support and resistance level.🔴
Share this with your friends if you like it.
enjoy it.


ALGO/USD Long market entryLong market entry 1,21
SL 0,795
PT 2,31
BE 1,8
RRR 2,7:1
POC + PIVOT
BINANCE:ALGOUSDT

ALGOUSDT 4H BUY SETUPFinally after a long time a later ALGO breaks out from the tringle also its ready to fly.
BUY SETUP:
BUY: 1.91-1.97
SELL:
Target 1: 2.05
Target 2: 2.15
Target 3: 2.25
Target 4: 2.5+
STOP LOSS: 1.825
LIKE and Enjoy your profit.

ALGO could be headed to $3Algorand crypto, symbol $ALGO, has a nice ascending triangle breakout on the daily timeframe (assuming prices hold as of this time). My target for this is around $3 USD. Volume looks good so far.
This is not financial advice, do your own research.


ALGO/USDTAlgo has been showing strength since and it should bring profit.
Every detail on the chart and remember NFA.
Good luck

Huge Opportunity on ALGO 🚀ALGO looking absolutely great, after being in consolidation for a long time is ready to PUMP.
Looking extremely good, just need to wait for clear breakout with a good level of volume. In the meantime the massive ascending triangle will still going on, the more times we hit the resistance, the more likely it is that we will be able to break it and hit a new ATH.
This will be broke in the next few days/weeks (max). As soon as we breakout this resistance the price target would be around of $2.6 and as you know after breaking ATH there is no resistance 😉. If we use the Fibonacci retracement the targets would be $3.2 and $4.3.
Please guys be cautious but don't miss this awesome opportunity.

ALGOUSDT # 001 ( try test ATH , 90 % profit !!! ) Hello dear friends .
Good day .
ALGO successfully broken bearish triangle & retest which is rejected .
It will try to test one more time ATH which 90 % profit will be yours .
Target are defined with help of Gann Box .
Thanks for your comments.
Good luck .

ALGOUSDT Bullish Pennant Chart PatternALGOUSDT Bullish Pennant Chart Pattern
If you want to scan candlestick patterns, harmonic patterns , chart patterns, divergences, indicators automatically visit the our website cryptopy.net

ALGOUSDTALGO can be supported in the range of 1.9625 and seeN higher targets after breaking the downtrend line in one hour time frame.

Algo Pullback BuyThe price has faced a setback due to bitcoin scoring a new ATH. All altcoins are facing now a pullback and algo is testing a non horizontal daily support and the level "2" which makes it as a strong support. Go long to 2.08 and goodluck.

ALGO Moving in Symmertical TriangleSo here We're , Algo after the big move moving into the summertical triangle and now on the Good Support , So Just Wait to Volume and after Breakout the triangle , you can buy it , Please Share your Idea about this chart
NOT FINANCIAL ADVICE
HAVE A GOOD TIME Fellas

AlgoUsdt Bullish Ascending TriangleAlgo goes up inside the Ascending Triangle in a daily timeframe.
Current:1.84
Target: 2.05
SL: 1.68
R/R: 1.3

ALGOUSDTsee and watch :)
The trendline has been broken and it seems that the price can increase up to the specified limits ...
ALGO/USDT (daily chart)The algorand coin (ALGO) is facing a major resistance at 2.04$ closing the daily candle under this resistance will give us a chance
for a good entry at 1.89$ and 1.85$. confirming the breakout by closing a daily candle above the resistance at 2.04$ will move
the coin toward the targets shown in the chart.

ALGO TA NOV 4Algo is still showing bullish signs from crossing EMA's to building momentum. ALGO could potentially reach 2.0lvl to complete the bat pattern (green). Pls be noted also that the 2.09lvl is its resistance from prev high.

ALGO - Daily TFOn a daily TF, ALGO is oscillating in a triangle and it is at the price floor. If it breaks the $2.08 support, you can enter for $2.5, $2.8, and $3.1.

ALGO doing the move ?
ALGO seem to be breaking out of his triangle but i would stay cautious as long as we don't have a daily above 2.05$.
If it does close above then the plan would be to buy any retest of 1.95$ and target 2.5$ as 1st TP which would be what i would play since MACD daily is turning bullish.
If it close under then we would need to rethink the upper trendline of the pattern perhaps and exclude the price action of 10 to 12th september which is missleading.
Ideally we want a daily close at 2.1$ so both trendline would become potential support combine with the current resistance area 1.95$/2.05$
Let's see how this will play out
